Grade K

Unit 1: Count Sequence and Numbers to 5

Module 1: Represent Numbers to 5 with Objects

Lesson 1: Represent 1 and 2Connecting Cubes
Lesson 2: Represent 3 and 4Skye’s Style
Matching Groups
Designing Shoes With Skye

Unit 2: Count Sequence and Numbers to 10

Module 7: Represent Numbers 6 to 10 with Objects

Module 10: Compare Numbers to 10

Lesson 4: Compare Groups Within 10 by CountingMore, Fewer, or the Same
Fingers and Counters
Lesson 5: Compare Groups Within 10 by MatchingComparing Words
Forest Friends

Module 11: Add To and Take From Within 10

Module 12: Put Together and Take Apart Within 10

Lesson 3: Solve Put Together Problems Within 10How Many Objects in Pictures?
How Will You Count?
What Does It Mean to Add?
Lesson 4: Solve Take Apart Problems Within 10What Does It Mean to Subtract?
Lesson 5: Solve Word Problems Within 10The Bus Depot

Module 13: Ways to Make Numbers to 10

Lesson 4: Ways to Make 10Harry’s Hamster Wheel
Harry Explores Space
Lesson 5: Make 10 From a Given NumberShowing What We Know About 10
Lesson 1: Ways to Make 6 and 7Harry Explores the Ocean

Unit 3: Geometry

Module 14: Analyze and Compare Three-Dimensional Shapes

Module OpenerWhat’s That Shape?
Lesson 5: Build ShapesBuilding Solid Shapes

Module 15: Describe Position of Objects

Module 16: Analyze and Compare Two-Dimensional Shapes

Lesson 7: Compare Two-Dimensional and Three-Dimensional ShapesSo Much Sorting
What’s That Shape Called?
Another Shape

Unit 4: Number and Operations in Base Ten

Module 17: Place Value Foundations-Represent Numbers to 20

Lesson 3: Compose Ten Ones and Some More Ones to 19Investigate: Packing Snacks
Lesson 4: Represent Numbers to 20Getting Ready for the Game
How Many on the Field?
Pass, Shoot, Score

Module 18: Place Value Foundations-Represent Number to 20 with a Written Numeral

Lesson 1: Count and Write 11 to 14Jersey Jam!
Lesson 3: Count and Write 16-19People at the Park

Grade 1

Unit 1: Ways to Add and Subtract

Module 2: Subtraction Strategies

Lesson 2.1: Represent SubtractionPacking a Picnic
Lesson 2.2: Count BackWhat’s the Difference?
Lesson 2.3: Count on to SubtractLeaping Lily Pads!

Module 3: Properties of Operations

Lesson 3.6: Determin Equatl and Not EqualReplanting Huli

Module 4: Apply Addition and Subtraction Relationships

Lesson 4.2: Represent Related FactsSame Number, Different Ways
Lesson 4.3: Identify Related FactsKitten Coaster
Lesson 4.6: Solve for Unknow AddendTutu’s Garden in Maui

Module 5: Understand Add to and Take From Problems

Lesson 5.4: Solve Add To and Take From ProblemsA Community Working Together
Helping Others
Making 10

Module 6: Understand Put Together and Take Apart Problems

Lesson 6.3: Represent Addend and Unknown Problems with Objects and DrawingInvestigate: Let’s Grow!

Module 8: Data

Lesson: 8.2 Represent Data with Picture GraphsShapes Ying Saw

Unit 3: Numbers to 120

Module 10: Count and Represent Numbers

Lesson 10.4: Decompose Numbers in Different WaysInvestigate: Game Points
Lesson 10.5: Represent, Read, and Write Numbers from 100 to 110From Head to Claw
From Wing Tip to Wing Tip
Measuring More Wingspans
Lesson 10.5: Represent, Read, and Write Numbers from 110 to 120From Head to Claw
From Wing Tip to Wing Tip
Measuring More Wingspans

Unit 4: Addition and Subtractoin in Base Ten

Module 12: Understand Addition and Subtraction with Tens and Ones

Lesson 12.1: Representing Adding TensMeeting Yara
It’s a Match
From Park to Table
Lesson 12.3: Add and Subtract TensHow Many Cubes?
Boris’s Thimbles
How Many Tens?

Module 13: Two-Digita Addition and Subtraction

Lesson 13.1: Use Hundred Charts to Show Two-Digit Addtion and Subtraction.Investigate: Squashes at the Playground
Lesson 13.2: Understand and Explain Place Value AdditionTown Helpers
Making Squash Butter

Unit 6: Measurment

Module 16: Fraction Foundations

Lesson 16.1: TAke Apart Two-Dimensional ShapesFair and Square
Lesson 16.2: Identify Equal or Unequal PartsOne of the Parts, All of the Parts
Lesson 16.4: Partition Shapes into FourthsA Bigger Part

Grade 2

Unit 1: Numbers and Data

Module 1: Fluency for Addition and Subtraction Within 20

Lesson 1.5: Use the Make a Ten Strategy to AddExploring Within 10
Ways to Make 10

Module 1: Fluency for Addition and Subtraction Within 21

Lesson 1.6: Use a Tens Fact to SubtractExploring Within 10
Ways to Make 10

Module 2: Equal Groups

Lesson 2.1: Identify Even and Odd NumbersCan You Share?
Is It Even or Odd?
Lesson 2.2: Write Equations to Represent Even NumbersEverybody, Find A Partner!

Module 3: Data

Lesson 3.5: Draw bar graphs to Represent DataAwesome Aquariums

Unit 2: Place Value

Module 4: Understand Place Value

Lesson 4.1: Group Tens as HundredsWhat Makes a Hundred?
Lesson 4.2: Understand Three-Digit NumbersWhat’s the Value?
Lesson 4.4: Represent Numbers with Hundreds, Tens, and OnesMail Call!
What’s Your Name?

Module 5: Read, Write, and Show Numbers to 1000

Lesson 5.3: Different Ways to Write NumbersA New Representation
Lesson 5.4: Different Ways to Show NumbersAll the Ways!

Module 6: Use Place Value

Lesson 6.1: Count Within 1000Investigate
Turtle Hurdle
Lesson 6.5: Use Symbols to Compare NumbersTime to Line Up!

Unit 3: Money and Time

Module 7: Coins

Lesson 7.1: Relate Place Value to CoinsInvestigate
Lesson 7.2 Identify and Find Value of CoinsDiscovering Coins (Part 1)
Lesson 7.3: Compute the Value of Coin CombinationsHow Much Money?
Lesson 7.4: Show Amounts in Different WaysDiscovering Coins (Part 2)
The Toy Stand

Module 8: Dollar Amounts

Lesson 8.3: Solve Problems Involving MoneyThe Craft Stand at the Block Party

Unit 5: Three-Digita Addition and Subtraction

Module 16: Three-Digit Addition

Lesson 16.1: Use Drawing to Represent Three-Digit AdditionThere’s Something About Berries
Lesson 16.2: Decomposte Three-Digit AddendsBaking With Skunk

Unit 6: Measurement

Module 18: Lengths in Inches, Feet, and Yards

Lesson 18.4: Make Line Ploits to Show Measurement DataMessy Measurements
Bracelets and Wristbands

Module 20: Relate Addition and Subtraction to Length

Lesson 20.1: Relate Inches to a Number LineInvestigate
Time to Line Up!
What’s That Number?
Lesson 20.2: Add and Subtract Lengths in InchesLengths of Jungle Animals
Lesson 20.3: Relate Centimeters to a Number LineInvestigate
Time to Line Up!
In Full Bloom

Unit 7: Geometry and Fractions

Module 21: Two- and Three- Dimensional Shapes

Lesson 21.2 Identify and Draw Three-Dimensional ShapesMore to Measure
Lesson 21.2: Identify and Draw Two-Dimensional ShapesFrame It!
Measure It, Draw It

Grade 3

Unit 1: Understand Multiplication and Area

Module 1: Understand Multiplication

Lesson 1.1: Count Equal GroupsEqual Groups
Lesson 1.3: Represent Multiplication with ArraysArrays of Flavor
Lesson 1.4: Understand the Commutative Property of MultiplicationArrays of Flavor

Module 2: Relate Multiplication and Area

Lesson 2.1 Understand Area by Counting Unit SquareInvestigate: Comparing Rugs
Which Covers More Space?
Lesson 2.2: Measuring Area by Counting Unit SquaresTiling Figures
Area Hunt
Lesson 2.3: Relate Area to Addition and MultiplicationRectangles and Arrays

Unit 2: Multiplication and Division

Module 7: Relate Multiplication and Division

Lesson 7.7: Build Fluency with Multiplication and DivisionRelating Quotients to Familiar Products

Module 8: Apply Multiplication and Division

Lesson 8.3: Use Multiplication and Division to Solve Problem SituationsIt’s Chili in Here!
Lesson 8.4: Solve Two-Step ProblemsDivision and Multiplication Equations

Unit 3: Addition and Subtraction Strategies

Module 9: Addition and Subtraction Strategies

Lesson 9.3: Use Properties to AddHow Would You Solve It?
Lesson 9.4: Use Mental Math to Assess ReasonablenessAdding Strategically

Module 10: Addition and Subtraction Within 1000

Lesson 10.1: Use Expanded Form to AddWhat Is an Algorithm?
Lesson 10.2: Use Place Value to AddAdding Your Way
Using Fewer Digits
Lesson 10.5: Choose a Strategy to Add or SubtractDetermining Sums of 2 or More Addends

Unit 4: Fractions

Module 13: Understand Fractions as Numbers

Lesson 13.4: Represent and Name Fractions on a Number LineFractions on the Number Line
Lesson 13.5: Express Whole Numbers as FractionsCat Crossing
Lesson 13.6: Represent and Name Fractions Greater Than 1Location, Location, Location

Unit 5: Measurement and Data

Module 18: Represent and Interpret Data

Lesson 18.4: Make a Bar GraphPuppy Pile
2, 5, or 10?
Egg-cellent Pick
Lesson 18.5: Use Line Plots to Display Measurement DataHow Long Is It?
More Precise Measurements
Same Lengths, Different Names
Lesson 18.6: Make Line Plots to Display Measurement DataThe Plot Chickens
Let’s Make a Line Plot

Unit 6: Geometry

Module 19: Define Two-Dimensional Shapes

Lesson 19.1: Describe ShapesPiho’s Shapes
Lesson 19.4: Define QuadrilateralsRectangles, Squares, and Rhombuses

Module 20: Categorize Two-Dimensional Shapes

Lesson 20.1: Draw QuadrilateralsMore Quadrilaterals

Grade 4

Unit 1: Place Value and Whole Number Operations

Module 3: Interpret and Solve Problem Situations

Lesson 3.1: Explore Multiplicative ComparisonsSticker Mania
Lesson 3.4: Use Comparison to Solve Problem SituationsRepresenting “Times as Many”
Going Swimming

Unit 2: Multiplication and Division Problems

Module 4: Mental Math and Estimation Strategies

Lesson 4.3: Estimate Products by 1-Digit NumbersA Reasonable Answer

Module 5: Multiply by 1-Digit Numbers

Lesson 5.1: Represent MultiplicationInvestigate: Packing Lei
Lesson 5.2: Use Area Models and the Distributive Property to MultiplyCounting Flowers for Lei
Lesson 5.4: Multiplying Using Partial ProductsThree of a Kind
Lesson 5.6: Multiplying 3-Digit and 4-Digit NumbersA Lei Making Workshop

Unit 3: Extend and Apply Multiplication

Module 8: Extend and Apply Multiplication

Lesson 8.1: Multiply with TensGrowing Flowers for the Lei
Lesson 8.3: Relate Area Model and Partial ProductsDouble Decomposition
Lesson 8.4: Multiplying Using Partial ProductsRevisiting Strategies
Lesson 8.7: Solve Multi-step Problems and Assess ReasonablenessHow Many Supplies?

Unit 4: Fractions and Decimals

Module 10: Algebraic Thinking and Number Theory

Lesson 10.1: Investigate FactorsHamster Homes
Lesson 10.2: Identify FactorsFactor or Multiple?
Lesson 10.4: Identify Prime and Composite NumbersA Number Game
Lesson 10.5 Generate and Analyze Number PatternsHow Does It Grow?

Module 11: Fraction Equivalence and Comparison

Lesson 11.1: Compare Fractions Using Viaula ModelsInvestigate: Building Your Own Number Line
Lesson 11.2: Compare Fractions Using BenchmarksFraction Strips
Lesson 11.6: Compare Fractions Using Common DenominatorsChop It
Lesson 11.7: Use Comparison to Order FractionsAll Kinds of Fractions

Module 12: Relate Fractions and Decimals

Lesson 12.1: Represent Tenths as Fractions and DecimalsA New Way to Write Tenths
Lesson 12.2 Represent Hundredths as Fractions and DecimalsA New Way to Write Hundredths
Lesson 12.3: Identify Equivalent Fractions and DecimalsAre They Equivalent?
Lesson 12.4: Compare DecimalsHow Can You Compare?
Robot Factory
What’s the Order

Module 13: Use Fractions to Understand Angles

Lesson 13.2: Explore AnglesAngle Adventures
Lesson 13.3: Relate Angles to Fraction Part of a CircleThe Spin on Angles
Lesson 13.6: Join and Separate AnglesAngles in Motion

Module 14: Understand Addition and Subtraction of Fractions with Like Denominators

Lesson 14.2: Joining Parts of the Same WholePizza Problems

Module 15: Add and Subtract Fractions and Mixed Numbers with Like Denominators

Lesson 15.1: Add and Subtract Fractions to Solve ProblemsMath Pizzeria

Unit 6: Two-Dimensional Figures and Symmetry

Module 18: Symmetry and Patterns

Lesson 18.3: Generate and Identify Shape PattersHow Does It Grow?

Grade 5

Unit 1: Whole Numbers, Expressions, and Volume

Module 1: Whole Number Place Value and Multiplication

Lesson 1.3: Use a Pattern to Multiply by Multiplies of 10, 100, and 1000Partial Products Everywhere
Monarch Butterflies
All About That Base
Lesson 1.5: Multiply Multi-Digit NumbersHow Do They Compare?

Module 2: Understand Division of Whole Numbers

Lesson 2.4: Use Partial QuotientsEmptying the Water Tank

Module 5: Volume

Lesson 5.2: Understand VolumeWhich is Largest
Lesson 5.3: Estimate VolumePacking the Barge
Lesson 5.6: Find Volume of Composed FiguresPutting it Together
Figures Made of Prisms

Unit 3: Multiplying Fractions and Mixed Numbers

Module 8: Understand Multiplication of Fractions

Lesson 8.1: Explore Groups of Equal Shares to Show MultiplicationInvestigate: Sharing Sandwiches
Investigate: Folding Paper
Lesson 8.2: Represent Multiplication of Whole Numbers by FractionsSharing More Sandwiches
Lesson 8.3: Represent Multiplication with Unit FractionOne Part of One Part
Lesson 8.4: Represent Multiplication of FractionsDance Breaks
Parts of Parts
Making Food
Lesson 8.5: Use Representations of Area to Develop ProceduresOne Part of One Part
Installing Turf
Rows and Columns
Lesson 8.6: Interpret Fraction Multiplication as ScalingChores at Animal Haven
The Re-size-inator
Lesson 8.7: Multiplying FractionsMessy Multiplication

Module 9: Understand and Apply Multiplication of Mixed Numbers

Lesson 9.3: Practice Multiplication with Fractions and Mixed NumbersMessy Multiplication
Applying Fraction Multiplication

Unit 4: Divide Fractions and Convert Customary Units

Module 10: Understand Division with Whole Numbers and Unit Fractions

Lesson 10.1: Interpret a Fraction as DivisionDivision Story Problems
Making Generalizations

Unit 5: Add and Subtract Decimals

Module 13: Decimal Place Value

Lesson 13.1: Understand ThousandthsWhat Is One Thousandth?
Lesson 13.2: Read and Write Decimals to ThousandthsSay What?
Lesson 13.3: Round DecimalsWhich Way Down the Mountain?
Rounding Races
Lesson 13.4: Compare and Order DecimalsInvestigate: Numbers Between Numbers
The Claw
Selling Collectibles

Unit 6: Multiply Decimals

Module 15: Multiply Decimals and Whole Numbers

Lesson 15.1: Understand Decimal Multiplication PatternsPlace Value Patterns
Powers of 10 Parade

Unit 7: Divide Decimals and Convert Customary Units

Module 17: Understand Decimal Division Patterns

Lesson 17.1: Understand Decimal Division PatternsPowers of 10 Parade

Unit 8: Graphs, Patterns, and Geometry

Module 19: Graphs and Patterns

Lesson 19.1: Describe a Coordinate SystemCreating a Coordinate System
Lesson 19.2: Understand Ordered PairsBullseye!
Lesson19.4: Generate and Identify Numerical PattermsCoordinating Satellite Repairs

Grade 6

Unit 1: Number Systems and Operations

Module 1: Integer Concepts

Lesson 1: Identify and Interpret IntegersCan You Dig It?
Lesson 2: Compare and Order Integers on a Number LineOrder in the Class

Module 3: Fraction Division

Lesson 1: Understand Fraction DivisionFlour Planner
Fill the Gap

Module 4: Fluency with Multi-Digit Decimal Operations

Lesson 1: Add and Subtract Multi-Digit DecimalsDishing Out Decimals
Decimal Diagrams and Algorithms
Lesson 4: Divide Multi-Digit DecimalsMovie Time

Unit 2: Ratio and Rate Reasoning

Module 5: Ratio and Rates

Lesson 1: Understand the Concept and Language of RatiosPizza Maker
Lesson 2: Represent Ratios and Rates with Tables and GraphsFruit Lab
Disaster Preparation
Lesson 3: Compare Ratios and RatesModel Trains
Lesson 4: Find and Apply Unit RatesWorld Records
Lesson 5: Solve Ratio and Rate Problems Using Proportional ReasoningWelcome to the Robot Factory
More Soft Serve

Module 6: Apply Ratios and Rates to Measurement

Lesson 2: Use Rate Reasoning to Convert withing Measurement SystemsSoft Serve
Many Measurements

Module 7: Understand, Express, and Compare Percent Ratios

Lesson 1: Understand, Express, and Compare Percent RatiosLucky Duckies

Unit 3: Expressions, Equations, and Inequalities

Module 8: Numerical and Algebraic Expressions

Lesson 3: Write Algebraic Expressions to Model SituationsProducts and Sums

Module 9: Solve Problems Using Equations and Inequalities

Lesson 1: Write Equations to Represent SituationsWeight for It
Five Equations
Lesson 2: USe Additions and Subtraction Equations to Solve ProblemsHanging Around
Hanging It Up
Lesson 3: Use Multiplication and Division Equations to Solve ProblemsHanging Around
Hanging It Up
Lesson 4: Use One-Step Equations to Solve a Variety of ProblemsSwap and Solve
Lesson 5: Write and Graph InequalitiesTunnel Travels

Module 10: Real-World Relationships Between Variables

Lesson 1: Represent Equations in Tables and GraphsSubway Fares
Lesson 2: Write Equations from Verbal DescriptionsSubway Fares

Unit 4: Relationships in Geometry

Module 11: Polygons on the Coordinate Plane

Lesson 4: Find the Perimeter and Area on the Coordinate PlaneShapes on a Plane

Module 12: Area of Triangles and Special Quadrilaterals

Lesson 1: Develop and Use the Formula for Area of ParallelogramsExploring Parallelograms, Part 1
Exploring Parallelograms, Part 2
Off the Grid, Part 1
Lesson 2: Develop and Use the Formula for Area of TrianglesExploring Triangles
Triangles and Parallelograms
Off the Grid, Part 2
Lesson 3: Develop and Use the Formula for Area of TrapezoidsPile of Polygons
Lesson 4: Find Area of Composite FiguresPuzzling Areas
Letters

Module 13: Surface Area and Volume

Lesson 1: Explore Nets and Surface AreaRenata’s Stickers

Unit 5: Data Collection and Analysis

Module 14: Data Collection and Displays

Lesson 2: Display Data in Dot PlotsMinimum Wage
Lesson 3: Make Histograms and Frequency TablesThe Plot Thickens

Module 15: Measure of Center

Lesson 2: Find Measures of CenterToy Cars
Lesson 3: Choose a Measure of CenterHoops

Grade 7

Unit 1: Proportional Relationships

Module 1: Identify and Represent Proportional Relationships

Lesson 1: Explore RelationshipsPaint
Lesson 2: Recognize Proportional Relationships in TablesTwo and Two
Lesson 3: Compute Unit Rates Involving FractionsDinoPops
Lesson 4: Recognize Proportional Relationships in GraphsScale Factor Challenges
Lesson 5: Use Proportional Relationships to Solve Rate ProblemsScaling Robots
Lesson 6: Practice Proportional Reasoning with Scale DrawingsScaling Machines
Make it Scale
Tiles
Will It Fit

Module 2: Proportional Reasoning with Percents

Lesson 1: Percent ChangeMosaics
Percent Machines
Lesson 2: Markups and DiscountsMore and Less
All the Equations
Lesson 3: Taxes and Gratuities100%
Lesson 5: Simple InterestBack in My Day

Unit 2: Rational Number Operations

Module 3: Understand Addition and Subtraction of Rational Numbers

Lesson 1: Add or Subtract a Positive Integer on a Number lineFloats and Anchors
Lesson 3: Use a Number Line to Add and Subtract Rational NumbersDraw Your Own

Module 4: Add and Subtract Rational Numbers

Lesson 1: Compute Sums of IntegersMore Floats and Anchors
Lesson 2: Compute Differences of IntegersMore Floats and Anchors
Lesson 4: Apply Properties to Multi-step Addition and Subtraction ProblemsInteger Puzzles

Unit 3: Model with Expressions, Equations, and Inequalities

Module 7: Solve Problems Using Expressions and Equations

Lesson 1: Write Linear Expressions in Different Forms for Different SituationsCollect the Squares
Lesson 3: Write Two-Step Equations for SituationsKeeping it True
Lesson 5: Apply Two-Step Equations fo Find Angle MeasuresFriendly Angles
Missing Measures

Module 8: Solve Problems Using Inequalities

Lesson 1: Understand and Apply Properties to Solve One-Step InequalitiesI Saw the Signs
Lesson 2: Write Two-Step Inequalities for SituationsUnbalanced Hangers
Shira the Sheep
Lesson 3: Apply Two-Step Inequalities to Solve ProblemsBudgeting
Write Them and Solve Them

Unit 4: Geometry

Module 9: Draw and Analyze Two-Dimensional Figures

Lesson 2: Draw Circles and Other FiguresCan You Build It

Module 10: Analyze Figures to Find Circumference and Area

Lesson 1: Derive and Apply Formulas for CircumferenceMeasuring Around
Lesson 2: Derive and Apply a Formula for the Area of a CircleWhy Pi?
Lesson 4: Areas of Composite FiguresArea Challenges

Unit 5: Sampling and Data Analysis

Module 13: Use Statistics and Graphs to Compare Data

Lesson 3: Compare Means Using MAD and Repeated SamplingCrab Island

Module 14: Understand and Apply Experimental Probability

Lesson 1: Understand Probability of an EventHow Likely
Lesson 2: Find Experimental Probability of Simple EventsProb-bear-bilities

Module 15: Find Theoretical Probability of Simple Events

Lesson 1: Find Theoretical Probability of Simple EventsIs It Fair?

Grade 8

Unit 1: Transformational Geometry

Module 1: Transformations and Congruence

Module 2: Transformations and Similarity

Lesson 1: Investigate Reductions and EnlargementsSketchy Dilations
Lesson 2: Explore DilationsDilation Mini Golf
Lesson 3: Understand and Recognize Similar FiguresSocial Scavenger Hunt

Unit 2: Linear Equations and Applications

Module 3: Solve Linear Equations

Lesson 1: Solve Multi-Step Linear EquationsEquation Roundtable
Lesson 3: Apply Linear Equations

Module 4: Angle Relationships

Lesson 1: Develop Angle Relationships for TrianglesPuzzling It Out
Lesson 3: Explore Prarallel Lines Cut by a TransversalPuzzling It Out

Unit 3: Relationships and Functions

Module 5: Proportional Relationships

Lesson 2: Derive y = mxTurtle Time Trials
Lesson 3: Interpret and Graph Proportional RelationshipsTurtle Time Trials
Lesson 4: Compare Proportional RelationshipsTurtle Time Trials

Module 6: Understand and Analyze Functions

Lesson 1: Understand and Graph FunctionsGuess My Rule
Lesson 2: Derive and Interpret y = mx + bFlags
Translations
Lesson 3: Interpret Rat of Change and Initial ValueStacking Cups (Optional)
Lesson 4: Construct FunctionsWater Cooler
Lesson 5: Compare FunctionsUps and Downs
Lesson 6: Describe and Sketch Nonlinear FunctionsTurtle Crossing
The Tortoise and the Hare

Module 7: Systems of Linear Equations

Lesson 1: Represent Systems by GraphingMake Them Balance
Lesson 2: Solve Systems by GraphingLine Zapper

Unit 4: Statistics and Probability

Module 8: Scatter Plots

Lesson 1: Construct Scatter Plots and Examine AssociationRobots
Dapper Cats
Lesson 2: Draw and Analyze Trend LinesInterpreting Scatter Plots
Find the Fit (called Fit Fights in Desmos Math)
Lesson 3: Interpret Linear Data in ContextInterpreting Slopes
Scatter Plot City
Animal Brains

Module 9: Two-Way Tables

Lesson 1: Construct and Interpret Two-Way Frequency TablesFinding Associations
Lesson 3: Interpret Two-Way Relative Freqency TablesFinding Associations

Unit 5: Real Numbers and the Pythagorean Theorem

Module 10: Real Numbers

Lesson 2: Investigate RootsRoot Down

Module 11: The Pythagorean Theorem

Lesson 1: Prove the Pythagorean TheoremTriangle Tracing Turtle
Lesson 3: Apply the Pythagorean TheoremTaco Truck

Unit 6: Exponents, Scientific Notation, and Volume

Module 12: Exponents and Scientific Notation

Lesson 1: Know and Apply Properties of ExponentsCircles
Power Pairs
Lesson 2: Understand Scientific NotationSpecific and Scientific (formerly Solar System)
Lesson 3: Compute with Scientific NotationBalance the Scale

Module 13: Volume

Lesson 1: Find Volume of CylindersCylinders
Lesson 2: Find Volumes of ConesCones

Algebra 1

Intro/Launch

Unit 1: Real Numbers and Connections to Algebra

Module 2: Linear Equations and Inequalities in One Variable

Lesson 2.2: Write and Solve EquationsWorking Backwards
Solving Strategies
Same Position
Lesson 2.3: Rewrite Formulas and Solve Literal EquationsVarious Variables
Lesson 2.4: Write and Solve InequalitiesPizza Delivery

Unit 2: Linear Functions and Equations

Module 3: Linear Equations in Two Variables

Lesson 3.1: Linear Equations in Standard FormShelley the Snail
Five Representations
Lesson 3.2: Slopes of Lines and Rates of ChangePlane, Train, and Automobile

Module 4: Linear Functions and Models

Lesson 4.3: Characteristics of Linear FunctionsCraft-a-Graph

Module 5: Relationships Among Linear Functions

Lesson 5.3: Compare Linear FunctionsSubway Seats
Lesson 5.4: Inverses of Linear FunctionsChip the Robot

Unit 3: Build Linear Functions and Models

Module 6: Fit Linear Functions to Data

Lesson 6.1: Scatter Plots, Correlation, and Fitted LinesCorrelation Coefficient
How Hot Is It?
City Slopes
Behind the Headlines
City Data
Lesson 6.2: Residualts and Best-Fit LinesResidual Fruit
Penguin Populations

Module 7: Discrete Linear Functions

Lesson 7.1: Arithmetic Sequences Defined RecursivelySequence Carnival
Lesson 7.2: Arithmetic Sequences Defined ExplicitlyMore Visual Patterns

Module 8: Piecewise-Defined Functions

Lesson 8.1: Graph Piecewise-Defined FunctionsPumpkin Prices

Unit 4: Linear Systems

Module 9: Systems of Linear Equations

Lesson 9.1: Solve Linear Systems by GraphingLizard Lines
Lesson 9.2: Solve Linear Systems by SubstitutionShape It Up

Module 10: Linear Inequalities

Lesson 10.2: Graph Systems of Linear InequalitiesQuilts
Seeking Solutions

Unit 5: Exponential Functions and Equations

Module 11: Exponential Functions and Models

Lesson 11.1: Exponential Growth FunctionsCarlos’s Fish

Unit 6: Build Exponential Functions and Models

Module 13: Fit Exponential Functions to Data

Lesson 13.1: Scatter Plots and Fitted Exponential CurvesDetroit’s Population, Part 1
Detroit’s Population, Part 2

Module 14: Discrete Exponential Functions

Lesson 14.1: Geometric Sequences Defined RecursivelySequence Carnival
Lesson 14.2: Geometric Sequences Defined ExplicitlyMore Visual Patterns

Unit 8: Quadratic Functions and Equations

Module 17: Use Graphing and Factoring to Solve Quadratic Equations

Lesson 17.1: Solve Quadratic Equations by Graphing Quadratic FunctionsRevisiting Visual Patterns, Part 1
Quadratic Visual Patterns
On the Fence
Plenty of Parabolas
Lesson 17.3: Solve Quadratic Equations by Factoring ax^2+bx+cStomp Rockets
Two for One
Robot Launch
Lesson 17.4: Use Special Factoring Patterns to Solve Quadratic EquationsParabola Zapper
Shooting Stars

Module 18: Use Square Roots to Solve Quadratic Equations

Lesson 18.2: Solve Quadratic Equations by Completing the SquareSquare Tactic
Lesson 18.3: Use the Quadratic Formula to Solve EquationsStomp Rockets in Space

Unit 9: Function Analysis

Module 20: Function Analysis

Lesson 20.1: Choose Among Linear, Exponential, and Quadratic ModelsSorting Relationships

Unit 10: Data Analysis

Module 22: Numerical Data

Lesson 22.1: Data Distributions and Appropriate StatisticsFinding Desmo

Disclaimer

This document is for informational purposes only; references to third-party programs do not imply endorsement or affiliation, and all trademarks are the property of their respective owners.

Grade 6

Unit 1: Area and Surface Area

Illustrative MathematicsDesmos Math 6–A1
Topic A: Reasoning to Find Area 
Lesson 1: Tiling the PlaneUnit 1
Lesson 1: Shapes on a Plane [Free lesson]
Lesson 2: Finding Area by Decomposing and Rearranging
Lesson 3: Reasoning to Find Area
Unit 1
Lesson 2: Letters
Topic 2: Parallelograms
Lesson 4: Parallelograms
Lesson 5: Bases and Heights of Parallelograms
Lesson 6: Area of Parallelograms
Unit 1
Lesson 3: Exploring Parallelograms (Print available) [Free lesson]
Lesson 4: Off the Grid
Topic 3: Triangles
Lesson 7: From Parallelograms to TrianglesUnit 1
Lesson 3: Exploring Parallelograms (Print available) [Free lesson]
Lesson 4: Off the Grid
Lesson 6: Triangles and Parallelograms
Lesson 8: Area of TrianglesUnit 1
Lesson 5: Exploring Triangles (Print available)
Lesson 9: Formula for the Area of a Triangle
Lesson 10: Bases and Heights of Triangles
Unit 1
Lesson 4: Off the Grid
Lesson 6: Triangles and Parallelograms
Topic 4: Polygons
Lesson 11: PolygonsUnit 1
Lesson 2: Letters
Lesson 8: Pile of Polygons
Practice Day 1 (Print available)
Unit 7
Lesson 11: Polygon Maker
Topic 5: Surface Area
Lesson 12: What is Surface Area?Unit 1
Lesson 9: Renata´s Stickers [Free lesson]
Lesson 13: PolyhedraUnit 1Lesson 10: Plenty of Polyhedra
Lesson 14: Nets and Surface AreaUnit 1
Lesson 10: Plenty of Polyhedra
Lesson 11: Nothing But Nets (Print available)
Lesson 13: Take It To Go
Lesson 15: More Nets, More Surface AreaUnit 1
Lesson 10: Plenty of Polyhedra
Lesson 11: Nothing But Nets (Print available)
Lesson 12: Face Value
Lesson 13: Take It To Go (Print available)
Practice Day 2 (Print available)
Lesson 16: Distinguishing Between Surface Area and Volume
Topic 6: Squares and Cubes 
Lesson 17: Squares and CubesUnit 6
Lesson 12: Squares and Cubes
Lesson 18: Surface Area of a Cube 
Topic 7: Let’s Put It to Work 
Lesson 19: Designing a TentUnit 1
Lesson 13: Take It To Go (Print available)

Unit 2: Introducing Ratios

Topic 1: Introducing Ratios
Lesson 1: Introducing Ratios and Ratio LanguageUnit 2Lesson 1: Pizza Maker [Free lesson]Lesson 2: Ratio Rounds (Print available)
Lesson 2: Representing Ratios with DiagramsUnit 2Lesson 1: Pizza Maker [Free lesson]Lesson 2: Ratio Rounds (Print available)Lesson 3: Rice Ratios (Print available)
Topic 2: Equivalent Ratios
Lesson 3: RecipesUnit 2Lesson 1: Pizza Maker [Free lesson]Lesson 3: Rice Ratios (Print available)
Lesson 4: Color MixturesUnit 2Lesson 7: Mixing Paint, Part 1Lesson 12: Mixing paint, Part 2
Lesson 5: Defining Equivalent RatiosUnit 2Lesson 3: Rice Ratios (Print available)Lesson 4: Fruit Lab [Free lesson]Lesson 11: Community LifePractice Day 1 (Print available)
Topic 3: Representing Equivalent ratios
Lesson 6: Introducing Double Number Line DiagramsUnit 2Lesson 5: Balancing Act
Lesson 7: Creating Double Line DiagramsUnit 2Lesson 5: Balancing ActLesson 6: Product prices (Print available)
Lesson 8: How Much for One?Unit 2Lesson 6: Product prices (Print available)
Lesson 9: Constant SpeedUnit 2Lesson 8: World Records (Print available)
Lesson 10: Comparing Situations by Examining RatiosUnit 2Lesson 7: Mixing Paint, Part 1 
Topic 4: Solving Ratio and Rate Problems
Lesson 11: Representing Ratios with TablesUnit 2Lesson 9: Disaster Preparation [Free lesson]
Lesson 12: Navigating a Table of Equivalent Ratios
Lesson 13: Tables and Double Line Diagrams
Unit 2Lesson 6: Product prices (Print available)Lesson 7: Mixing Paint, Part 1
Lesson 14: Solving Equivalent Ratio ProblemsUnit 2Lesson 6: Product prices (Print available)Lesson 7: Mixing Paint, Part 1Lesson 10: BalloonsLesson 11: Community Life (Print available)
Topic 5: Part-Part-Whole Ratios
Lesson 15: Part-Part-Whole RatiosUnit 2Lesson 12: Mixing paint, Part 2Lesson 13: City Planning
Lesson 16: Solving More Ratio ProblemsUnit 2Lesson 13: City PlanningLesson 14: Lunch Waste (Print available)
Topic 6: Let’s Put It to Work 
Lesson 17: A Fermi ProblemUnit 2Lesson 13: City PlanningLesson 14: Lunch Waste (Print available)Practice Day 2 (Print available)

Unit 3: Rates and Percentages

Topic 1: Units of Measurement 
Lesson 1: The Burj KhalifaUnit 3
Lesson 4: Model Trains
Topic 2: Unit Conversion
Lesson 2: Anchoring Units of MeasurementUnit 3
Lesson 1: Many Measurements (Print available) [Free lesson]
Lesson 3: Measuring with Different-Sized Units
Lesson 4: Converting Units
Unit 3
Lesson 2: Counting Classrooms
Lesson 3: Pen Pals
Topic 3: Rates
Lesson 5: Comparing Speeds and PricesUnit 2
Lesson 8: World Records (Print available) 

Unit 3
Lesson 4: Model Trains
Lesson 5: Soft Serve [Free lesson]
Lesson 6: Welcome to the Robot Factory
Lesson 6: Interpreting Rates
Lesson 7: Equivalent Ratios Have the Same Unit Rates
Unit 3
Lesson 4: Model Trains
Lesson 5: Soft Serve [Free lesson]
Lesson 8: More About Constant SpeedUnit 2
Lesson 8: World Records (Print available) 

Unit 3
Lesson 4: Model Trains
Lesson 9: Solving Rate ProblemsUnit 3
Lesson 7: More Soft Serve
Topic 4: Percentages
Lesson 10: What Are percentagesUnit 3
Lesson 8: Lucky Duckies [Free lesson]
Lesson 9: Bicycle Goals
Lesson 11: Percentages and Double Number LinesUnit 3
Lesson 9: Bicycle Goals
Lesson 10: What’s Missing? (Print available)
Lesson 12: Percentages and Tape DiagramsUnit 3
Lesson 10: What’s Missing? (Print available)
Lesson 13: Benchmark percentagesUnit 3
Lesson 8: Lucky Duckies [Free lesson]
Lesson 14: Solving Percentage Problems
Lesson 15: Finding This Percent of That
Lesson 16: Finding the Percentage
Unit 3
Lesson 10: What’s Missing? (Print available)
Lesson 11: Cost Breakdown
Lesson 12: More Bicycle Goals
Lesson 13: A Country as a Village
Topic 5: Let’s Put It to Work 
Lesson 17: Painting a RoomUnit 3
Lesson 13: A Country as a Village
Lesson 7: Equivalent Ratios Have the Same Unit RatesUnit 3
Lesson 4: Model Trains
Lesson 5: Soft Serve [Free lesson]

Unit 4: Dividing Fractions

Topic 1: Making Sense of Division 
Lesson 1: Size of Divisor and Size of Quotient
Lesson 2: Meanings of Division
Unit 4Lesson 1: Cookie Cutter
Lesson 3: Interpreting Division SituationsUnit 4Lesson 2: Making Connections (Print available)
Topic 2: Meanings of Fraction Division
Lesson 4: How Many Groups (Part 1)Unit 4Lesson 3: Flour Planner [Free lesson]Lesson 4: Flower Planters 
Lesson 5: How Many Groups (Part 2)Unit 4Lesson 5: Garden Bricks (Print available)
Lesson 6: Using Diagrams to Find the Number of GroupsUnit 4Lesson 5: Garden Bricks (Print available)Lesson 6: Fill the Gap [Free lesson]
Lesson 7: What Fraction of a Group?
Lesson 8: How Much in Each Group? (Part 1)
Lesson 9: How Much in Each Group? (Part 2)
Unit 4Lesson 8: Potting Soil
Topic 3: Algorithm for Fraction Division
Lesson 10: Dividing by Unit and Non-Unit FractionsUnit 4Lesson 7: Break It DownLesson 8: Potting SoilLesson 9: Division Challenges 
Lesson 11: Using an Algorithm to Divide FractionsUnit 4Lesson 9: Division ChallengesPractice Day
Topic 4: Fractions in Lengths, Areas, and Volumes
Lesson 12: Fractional LengthsUnit 4Lesson 11: Classroom Comparisons
Lesson 13: Rectangles with Fractional Side LengthsUnit 4Lesson 12: Puzzling Areas (Print available) [Free lesson]
Lesson 14: Fractional Lengths in Triangles and Prisms
Lesson 15: Volume of PrismsUnit 4Lesson 13: Volume Challenges
Topic 5: Let’s Put It to Work
Lesson 16: Solving Problems with FractionsUnit 4Lesson 10: Swap Meet (Print available)
Lesson 17: Fitting Boxes into BoxesUnit 4Lesson 14: Planter Planner (Print available)

Unit 5: Arithmetic in Base Ten

Topic 1: Warming Up to Decimals 
Lesson 1: Using Decimals in a Shopping ContextUnit 5Lesson 1: Dishing Out Decimals (Print available) [Free lesson]
Topic 2: Adding and Subtracting Decimals
Lesson 2: Using Decimals to Represent Addition and SubtractionUnit 5Lesson 3: Fruit by the PoundLesson 4: Missing Digits
Lesson 3: Adding and Subtracting Decimals with Few Non-Zero DigitsUnit 5Lesson 4: Missing Digits
Lesson 4: Adding and Subtracting Decimals with Many Non-Zero Digits 
Topic 3: Multiplying Decimals
Lesson 5: Decimal Points in ProductsUnit 5Lesson 5: Decimal Multiplication
Lesson 6: Methods for Multiplying DecimalsUnit 5Lesson 5: Decimal MultiplicationLesson 6: Multiplying with AreasLesson 7: Multiplication methods (Print available)
Lesson 7: Using Diagrams to Represent MultiplicationUnit 5Lesson 5: Decimal MultiplicationLesson 6: Multiplying with Areas
Lesson 8: Calculating Products of DecimalsUnit 5Lesson 6: Multiplying with Areas
Topic 4: Dividing Decimals
Lesson 9: Using the Partial Quotients MethodUnit 5Lesson 8: Division Diagrams
Lesson 10: Using Long DivisionUnit 5Lesson 8: Division DiagramsLesson 9: Long Division Launch (Print available)Lesson 10: Return of the Long Division (Print available)
Lesson 11: Dividing Numbers That Result in Decimals
Lesson 12: Dividing Decimals by Whole Numbers
Lesson 13: Dividing Decimals by Decimals
Unit 5Lesson 9: Long Division Launch (Print available)Lesson 10: Return of the Long Division (Print available)
Topic 5: Let’s Put It to Work
Lesson 14: Using Operations on Decimals to Solve ProblemsUnit 5Lesson 11: Movie Time [Free lesson]
Lesson 15: Making and Measuring Boxes
Lesson 12: Dividing Decimals by Whole Numbers 
Lesson 13: Dividing Decimals by DecimalsUnit 5Lesson 9: Long Division Launch (Print available)Lesson 10: Return of the Long Division (Print available)

Unit 6: Expressions and Equations

Lesson 1: Tape Diagrams and Equations
Lesson 2: Truth and Equations
Unit 6Lesson 1: Weight for It [Free lesson]Lesson 2: Five Equations (Print available)
Lesson 3: Staying in BalanceUnit 6Lesson 1: Weight for It [Free lesson]Lesson 2: Five Equations (Print available)Lesson 3: Hanging Around
Lesson 4: Practice Solving Equations and Representing Situations with EquationsUnit 6Lesson 3: Hanging AroundLesson 4: Hanging It UpLesson 5: Swap and Solve (Print available)
Lesson 5: A New Way to Interpret a and bUnit 6Lesson 4: Hanging It UpLesson 5: Swap and Solve (Print available)
Topic 2: Equal and Equivalent
Lesson 6: Write Expressions Where Letters Stand for NumbersUnit 6Lesson 6: Vari-applesLesson 7: Border Tiles
Lesson 7: Revisit PercentagesUnit 3Lesson 10: What’s Missing?Lesson 11: Cost BreakdownLesson 12: More Bicycle Goals
Lesson 8: Equal and EquivalentUnit 6Lesson 1: Weight for It [Free lesson]Lesson 2: Five Equations (Print available)Lesson 3: Hanging AroundLesson 6: Vari-apples
Topic 9: The Distributive Property, Part 1Unit 6Lesson 8: Products and Sums [Free lesson]
Lesson 10: The Distributive Property, Part 2
Lesson 11: The Distributive Property, Part 3
Unit 6Lesson 8: Products and Sums [Free lesson]Lesson 9: Products, Sums, and Differences (Print available)
Topic 3: Expressions with Exponents
Lesson 12: Meaning of ExponentsUnit 6Lesson 10: PowersLesson 11: Exponent Expressions (Print available)
Lesson 13: Expressions with Exponents
Lesson 14: Evaluating Expressions with Exponents
Lesson 15: Equivalent Exponential Expressions
Unit 6Lesson 11: Exponent Expressions (Print available)Lesson 12: Squares and Cubes
Topic 4: Relationships Between Quantities 
Lesson 16: Two Related Quantities, Part 1
Lesson 17: Two Related Quantities, Part 2
Lesson 18: More Relationships
Unit 6Lesson 13: Turtles All the WayLesson 14: Representing RelationshipsLesson 15: Connecting Representations (Print available)
Topic 5: Let’s Put It to Work
Lesson 19: Tables, Equations, and Graphs, Oh My!Unit 6Lesson 16: Subway fares (Print available) [Free lesson]

Unit 7: Rational Numbers

Topic 1: Positive and Negative Numbers
Lesson 1: Positive and Negative NumbersUnit 7Lesson 1: Can You Dig In [Free lesson]Lesson 2: Digging Deeper
Lesson 2: Points on the Number LineUnit 7Lesson 2: Digging Deeper
Lesson 3: Comparing Positive and Negative Numbers
Lesson 4: Ordering Rational Numbers
Unit 7Lesson 3: Order in the Class (Print available) [Free lesson]
Lesson 5: Using Negative Numbers to make Sense of ContextsUnit 7 Lesson 4: Sub-Zero
Lesson 6: Absolute Value of Numbers
Lesson 7: Comparing Numbers and Distance from Zero
Unit 7Lesson 5: Distance on the Number Line
Topic 2: Inequalities
Lesson 8: Writing and Graphing InequalitiesUnit 7Lesson 13: Popcorn Possibilities
Lesson 9: Solutions of Inequalities
Lesson 10: Interpreting Inequalities
Unit 7Lesson 6: Tunnel Travel [Free lesson]Lesson 7: Comparing WeightsLesson 8: Shira´s Solutions
Topic 3: The Coordinate Plane
Lesson 11: Points on the Coordinate Plane
Lesson 12: Constructing the Coordinate Plane
Unit 7Lesson 9: Sand Dollar SearchLesson 10: The A-maze-ing Coordinate Plane
Lesson 13: Interpreting Points on a Coordinate PlaneUnit 7Lesson 9: Sand Dollar SearchLesson 10: The A-maze-ing Coordinate PlaneLesson 11: Polygon Maker
Lesson 14: Distances on a Coordinate PlaneUnit 7Lesson 11: Polygon MakerLesson 12: Graph Telephone (Print available)
Lesson 15: Shapes on the Coordinate PlaneUnit 1Lesson 1: Shapes on a Plane [Free lesson]Lesson 2: LettersLesson 5: Exploring Triangles (Print available)Lesson 6: Triangles and ParallelogramsUnit 7Lesson 3: Exploring Parallelograms (Print available)Lesson 11: Polygon MakerLesson 12: Graph Telephone (Print available)
Topic 4: Common Factors and Common Multiples
Lesson 16: Common FactorsUnit 5Lesson 15: Common factors
Lesson 17: Common MultiplesUnit 5Lesson 14: Common Multiples
Lesson 18: Using Common Multiples and Common FactorsUnit 5Lesson 14: Common MultiplesLesson 15: Common factorsPractice Day 2 (Print available)
Topic 5: Let’s Put It to Work
Lesson 19: Drawing on the Coordinate PlaneUnit 7Lesson 11: Polygon MakerLesson 12: Graph Telephone (Print available)

Unit 8: Data Sets and Distributions

Topic 1: Data, Variability, and Statistical Questions
Lesson 1: Got Data?
Lesson 2: Statistical Questions
Unit 8Lesson 1: Screen TimeLesson 2: Dot Plots
Topic 2: Dot Plots and Distributions
Lesson 3: Representing Data Graphically
Lesson 4: Dot Plots
Lesson 5: Using Dot Plots to Answer Statistical Questions
Unit 8Lesson 2: Dot PlotsLesson 3: Minimum Wage (Print available) [Free lesson]Lesson 4: Lots More Dots
Lesson 6: Interpreting Histograms
Lesson 7: Using Histograms to Answer Statistical Questions
Lesson 8: Describing Distributions on Histograms
Unit 8Lesson 5: The Plot Thickens [Free lesson]Lesson 6: DIY Histograms (Print available)
Topic 3: Measures of Center and Variability
Lesson 9: Mean
Lesson 10: Finding and Interpreting the Mean as a Balance Point
Unit 8Lesson 7: Snack Time
Lesson 11: Variability and MADUnit 8Lesson 8: Pop It!
Lesson 12: Using Mean and MAD to Make ComparisonsUnit 8Lesson 9: Hoops
Topic 4: Median and IQR
Lesson 13: MedianUnit 8Lesson 11: Toy Cars [Free lesson]Lesson 12: In the News
Lesson 14: Comparing Mean and MedianUnit 8Lesson 12: In the News
Lesson 15: Quartiles and Interquartile RangeUnit 8Lesson 13: Pumpkin Patch
Lesson 16: Box PlotsUnit 8Lesson 14: Car, Plane, Bus, or Train? (Print available)
Lesson 17: Using Box PlotsUnit 8Lesson 14: Car, Plane, Bus, or Train? (Print available)Lesson 15: Hollywood Part 2Lesson 16: Hollywood Part 3 (Print available)Practice Day 2 (Print available)
Topic 5: Let’s Put It to Work
Lesson 18: Using Data to Solve ProblemsUnit 8Lesson 16: Hollywood Part 3 (Print available)

Unit 9: Putting It All Together

Topic 1: Making Connections
Lesson 1: Fermi Problems
Lesson 2: In Our Class Were the World
Unit 3Lesson 13: A Country as a Village
Lesson 3: Rectangle MadnessUnit 5Lesson 14: Common MultiplesLesson 15: Common factors
Topic 2: Voting
Lesson 4: How Do We Choose?Unit 2Lesson 13: City PlanningLesson 14: Lunch Waste (Print available)
Lesson 5: More than Two ChoicesUnit 3Lesson 13: A Country as a Village
Lesson 6: Picking RepresentativesUnit 8Lesson 16: Hollywood Part 3 (Print available)

Grade 7

Unit 1: Scale Drawings

Illustrative MathematicsDesmos Math 6–A1
Topic 1: Scaled Copies 
Lesson 1: What are Scaled Copies?Unit 1Lesson 1: Scaling Machines [Free lesson]
Lesson 2: Corresponding Parts and Scale FactorsUnit 1Lesson 2: Scaling Robots Unit 3Lesson 1: Toothpicks
Lesson 3: Making Scaled Copies
Lesson 4: Scaled Relationship
Unit 1Lesson 3: Make It Scale Unit 4Lesson 3: Sticker Sizes
Lesson 5: The Size and the Scale FactorUnit 1Lesson 4: Scale Factor Challenges
Lesson 6: Scaling and AreaUnit 1Lesson 5: TilesPractice Day 1 (Print available)
Topic 2: Scale Drawings 
Lesson 7: Scale DrawingsUnit 1Lesson 6: Introducing ScaleLesson 7: Will It Fit? (Print available) [Free lesson]
Lesson 8: Scale Drawings and Maps 
Lesson 9: Creating Scale Drawings
Lesson 10: Changing Scales in Scale Drawings
Unit 1Lesson 8: Scaling StatesLesson 9: Scaling BuildingsLesson 10: Room Redesign (Print available)
Lesson 11: Scales without Units 
Lesson 12: Units in Scale DrawingsUnit 1Lesson 8: Scaling StatesLesson 9: Scaling BuildingsLesson 10: Room Redesign (Print available)Practice Day 2 (Print available)
Topic 3: Let’s Put It to Work
Lesson 13: Draw It to ScaleUnit 1Lesson 10: Room Redesign (Print available)

Unit 2: Introducing Proportional Relationships

Topic 1: Representing Proportional Relationships with Tables
Lesson 1: One of These Things Is Not Like the OthersUnit 2Lesson 1: Paint [Free lesson] 
Lesson 2: Introducing Proportional Relationships with TablesUnit 2Lesson 2: Balloon FloatLesson 3: Sugary Drinks (Print available)Lesson 4: Robot Factory
Lesson 3: More About Constant of ProportionalityUnit 2Lesson 3: Sugary Drinks (Print available)Unit 4Lesson 3: Sticker Sizes
Topic 2: Representing Proportional Relationships with Equations 
Lesson 4: Proportional Relationships with EquationsUnit 2Lesson 4: Robot FactoryLesson 5: SnapshotsLesson 6: Two and Two (Print available) [Free lesson]Lesson 7: All Kinds of Equations
Lesson 5: Two Equations for Each Relationship
Lesson 6: Using Equations to Solve Problems
Unit 2Lesson 6: Two and Two (Print available) [Free lesson]Lesson 7: All Kinds of EquationsPractice Day
Topic 3: Comparing Proportional and Nonproportional Relationships 
Lesson 7: Comparing Relationships with TablesUnit 2Lesson 2: Balloon FloatLesson 3: Sugary Drinks (Print available)Lesson 4: Robot Factory
Lesson 8: Comparing Relationships with EquationsUnit 2Lesson 4: Robot FactoryLesson 5: SnapshotsLesson 6: Two and Two (Print available) [Free lesson]Lesson 7: All Kinds of EquationsLesson 11: Four RepresentationsLesson 12: Water Efficiency
Lesson 9: Solving Problems About Proportional RelationshipsUnit 2Lesson 12: Water Efficiency
Topic 4: Representing Proportional Relationships with Graphs
Lesson 10: Introducing Graphs of Proportional Relationships
Lesson 11: Interpreting Graphs of Proportional Relationships
Lesson 12: Using Graphs to Compare Relationships
Lesson 13: Two Graphs for Each Relationship
Unit 2Lesson 8: Dino Pops [Free lesson]Lesson 9: Gallon ChallengeLesson 10: Three TurtlesLesson 11: Four RepresentationsLesson 12: Water Efficiency
Topic 5: Let’s Put It to Work
Lesson 14: For RepresentationsUnit 2Lesson 11: Four Representations (Print available)
Lesson 15: Using Water EfficiencyUnit 2Lesson 12: Water Efficiency

Unit 3: Measuring Circles

Topic 1: Circumference of a Circle 
Lesson 1: How Well Can You Measure?Unit 3Lesson 1: Toothpicks
Lesson 2: Exploring Circles
Lesson 3: Exploring Circumference
Lesson 4: Applying Circumference
Unit 3Lesson 2: Is It a Circle?Lesson 3: Measuring Around [Free lesson]
Lesson 5: Circumference and Wheels 
Topic 2: Area of a Circle
Lesson 6: Estimating AreasUnit 3Lesson 5: Area Strategies
Lesson 7: Exploring the Area of a Circle
Lesson 8: Relating Area to Circumference
Unit 3Lesson 5: Area StrategiesLesson 6: Radius Squares (Print available)Lesson 7: Why Pi?Lesson 8: Area Challenges [Free lesson]Lesson 9: Circle vs. SquarePractice Day 2 (Print available)
Lesson 9: Applying Area of CirclesUnit 3Lesson 6: Radius Squares (Print available)
Topic 3: Let’s Put It to Work
Lesson 10: Distinguishing Circumference and AreaUnit 3Lesson 7: Why Pi?
Lesson 11: Stained-Glass WindowsUnit 3Lesson 5: Area StrategiesLesson 6: Radius Squares (Print available)

Unit 4: Proportional Relationships and Percentages

Topic 1: Proportional Relationships with Fractions 
Lesson 1: Lots of Flags
Lesson 2: Ratios and Rates with Fractions
Lesson 3: Revisiting Proportional Relationships
Lesson 4: Half as Much Again
Unit 4Lesson 1: Mosaics [Free lesson]Lesson 2: Peach Cobbler (Print available)Lesson 3: Sticker Sizes
Lesson 5: Say It with Decimals 
Topic 2: Percent Increase and Decrease 
Lesson 6: Increasing and DecreasingUnit 4Lesson 4: More and LessLesson 5: All the EquationsLesson 6: 100% (Print available)Lesson 7: Percent machines [Free lesson]Lesson 8: Tax and TipLesson 9: Minimum Wage (Print available)Lesson 10: Cost of College (Print available)Lesson 11: Bookcase BuilderLesson 12: Posing Percent Problems [Free lesson]
Lesson 7: One Hundred percentUnit 4Lesson 6: 100% (Print available)
Lesson 8: Percent Increase and Decrease with EquationsUnit 4Lesson 5: All the Equations
Lesson 9: More and Less than 1% 
Topic 3: Applying Percentages
Lesson 10: Tax and Tip
Lesson 11: Percentage Contexts
Unit 4Lesson 8: Tax and TipLesson 9: Minimum Wage (Print available)Lesson 10: Cost of College (Print available)Lesson 11: Bookcase BuilderLesson 12: Posing Percent Problems [Free lesson]
Lesson 12: Finding the PercentagesUnit 4Lesson 4: More and Less
Lesson 13: Measurement Error
Lesson 14: Percent Error
Lesson 15: Error Intervals
Unit 4Lesson 11: Bookcase Builder
Topic 4: Let’s Put It to Work 
Lesson 16: Posing Percent ProblemsUnit 4Lesson 8: Tax and TipLesson 9: Minimum Wage (Print available)Lesson 10: Cost of College (Print available)Lesson 11: Bookcase BuilderLesson 12: Posing Percent Problems [Free lesson]Practice Day

Unit 5: Rational Number Arithmetic

Topic 1: Interpreting Negative Numbers 
Lesson 1: Interpreting Negative NumbersUnit 5Lesson 1: Floats and Anchors [Free lesson]
Topic 2: Adding and Subtracting Rational Numbers
Lesson 2: Changing Temperatures
Lesson 3: Changing Elevation
Unit 5Lesson 2: More Floats and AnchorsLesson 3: BumpersLesson 4: Draw Your Own (Print available) [Free lesson]
Lesson 4: Money and Debts 
Lesson 5: Representing SubtractionUnit 5Lesson 5: Number Puzzles
Lesson 6: Subtracting Rational Numbers
Lesson 7: Adding and Subtracting to Solve Problems
Unit 5Lesson 3: BumpersLesson 4: Draw Your Own (Print available) [Free lesson]Lesson 5: Number PuzzlesLesson 10: Integer Puzzles [Free lesson]Lesson 11: Changing TemperaturesLesson 13: Solar Panels and More (Print available)Practice Day 1 (Print available)
Topic 3: Multiplying and Dividing Rational Numbers
Lesson 8: Position, Speed, and Direction
Lesson 9: Multiplying Rational Numbers
Lesson 10: Multiply!
Unit 5Lesson 7: Back in Time
Lesson 11: Dividing Rational NumbersUnit 5Lesson 8: Speeding Turtles
Lesson 12: Negative Rates 
Topic 4: Four Operations with Rational Numbers 
Lesson 13: Expressions with Rational NumbersUnit 5Lesson 9: Expressions (Print available)
Lesson 14: Solving Problems with Rational NumbersLesson 11: Changing Temperatures
Lesson 12: Arctic Ice Sea (Print available)
Lesson 13: Solar Panels and More (Print available)
Topic 5: Solving Equations When There Are Negative Numbers 
Lesson 15: Making and Measuring Boxes 
Lesson 16: Representing Contexts with Equations 
Topic 6: Let’s Put It to Work 
Lesson 17: The Stock market

Unit 6: Expressions, Equations, and Inequalities

Topic 1: Representing Situations of the Form px + q and p(+ q) = r
Lesson 1: Relationships Between Quantities
Unit 2 Lesson 1: Paint [Free lesson] Lesson 2: Balloon Float
Unit 4 Lesson 1: Mosaics [Free lesson] Lesson 2: Peach Cobbler (Print available)
Unit 6 Lesson 1: Toothpicks and Tiles
Lesson 2: Reasoning about Contexts with Tape Diagrams
Lesson 3: Reasoning about Equations with Tape Diagrams
Lesson 4: Reasoning about Equations and Tape Diagrams (Part 1)
Lesson 5: Reasoning about Equations and Tape Diagrams (Part 2)
Unit 6Lesson 2: Smudged ReceiptsLesson 3: EquationsLesson 4: Seeing Structure (Print available)
Lesson 6: Distinguishing between Two Types of SituationsUnit 6Lesson 6: Balancing EquationsLesson 7: Keeping It True (Print available)
Topic 2: Solving Equations of the Form px + q and p(+ q) = and Problems That lead to Those Equations 
Lesson 7: Reasoning about Solving Equations (Part 1)Unit 6Lesson 5: Balancing MovesLesson 6: Balancing EquationsLesson 7: Keeping It True (Print available) 
Lesson 8: Reasoning about Solving Equations (Part 2)Unit 6Lesson 5: Balancing MovesLesson 6: Balancing EquationsLesson 7: Keeping It True (Print available)Lesson 9: Always-Equal Machines
Topic 9 Dealing with Negative Numbers 
Lesson 10: Different Options for Solving One EquationUnit 6Lesson 7: Keeping It True (Print available)Lesson 9: Always-Equal MachinesLesson 10: Collect the Squares [Free lesson]Lesson 11: Equation Roundtable (Print available)
Lesson 11: Using Equations to Solve ProblemsUnit 6Lesson 12: Community Day (Print available)
Lesson 12: Solving Problems about Percent Increase or DecreaseUnit 4Lesson 10: Cost of College (Print available)
Topic 3: Inequalities 
Lesson 13: Reintroducing InequalitiesUnit 6Lesson 13: I Saw the SignsLesson 15: BudgetingLesson 16: Shira the Sheep [Free lesson]
Lesson 14: Finding Solutions to Inequalities in Context
Lesson 15: Efficiency Solving Inequalities
Unit 6Lesson 14: Unbalanced HangersLesson 15 Budgeting (Print available)Lesson 16: Shira the Sheep [Free lesson]Lesson 17: Write Them and Solve Them (Print available)
Lesson 16: Interpreting Inequalities
Lesson 17: Modeling with Inequalities
Unit 6Lesson 16: Shira the Sheep [Free lesson]Lesson 17: Write Them and Solve Them (Print available)Practice Day 2 (Print available)
Topic 4: Writing Equivalent Expressions 
Lesson 18: Subtraction in Equivalent ExpressionsUnit 6Lesson 9: Always-Equal MachinesLesson 10: Collect the Squares [Free lesson]Lesson 11: Equation Roundtable (Print available) 
Lesson 19: Expanding and FactoringUnit 6Lesson 8: Factoring and Expanding (Print available)Lesson 11: Equation Roundtable (Print available)
Lesson 20: Combining Like Terms (Part 1)
Lesson 21: Combining Like Terms (Part 2)
Lesson 22: Combining Like Terms (Part 3)
Unit 6Lesson 2: Smudged ReceiptsLesson 6: Balancing EquationsLesson 8: Factoring and Expanding (Print available)Lesson 9: Always-Equal MachinesLesson 10: Collect the Squares [Free lesson]Lesson 11: Equation Roundtable (Print available)Practice Day 1 (Print available)
Topic 5: Let’s Put It to Work
Lesson 23: Applications of ExpressionsUnit 6Lesson 12: Community Day (Print available)

Unit 7: Angles, Triangles, and Prisms

Topic 1: Angle Relationships
Lesson 1:Relationships of Angles
Unit 7 Lesson 1: Pinwheels Lesson 2: Friendly Angles [Free lesson] Lesson 3: Angle Diagrams
Lesson 2: Adjacent Angles
Lesson 3: Nonadjacent Angles
Unit 7Lesson 2: Friendly Angles [Free lesson]Lesson 3: Angle Diagrams
Lesson 4: Solving for Unknown AnglesUnit 7Lesson 2: Friendly Angles [Free lesson]Lesson 3: Angle DiagramsLesson 4: Missing Measures (Print available)
Lesson 5: Using Equations to Solve for Unknown AnglesUnit 7Lesson 3: Angle DiagramsLesson 4: Missing Measures (Print available) [Free lesson]
Topic 2: Drawing Polygons with Given Conditions 
Lesson 6: Building Polygons (Part 1)
Lesson 7: Building Polygons (Part 2)
Unit 7Lesson 6: Is It Enough?
Lesson 8: Triangles with 3 Common MeasuresUnit 7Lesson 13: Popcorn Possibilities
Lesson 9: Drawing Triangles (Part 1)
Lesson 10: Drawing Triangles (Part 2)
Unit 7Lesson 5: Can You Build It? [Free lesson]Lesson 6: Is It Enough?Lesson 7: More Than OneLesson 8: Can You Draw It? (Print available)Practice Day 1 (Print available)
Topic 3: Solid Geometry
Lesson 11: Slicing SolidsUnit 7Lesson 9: Slicing Solids
Lesson 12: Volume of Right PrismsUnit 7Lesson 10: Simple Prisms
Lesson 13: Decomposing Bases for AreasUnit 7Lesson 11: More Complicated Prisms
Lesson 14: Surface Area of Right PrismsUnit 7Lesson 10: Simple PrismsLesson 11: More Complicated PrismsLesson 12: Surface Area Strategies (Print available)
Lesson 15: Distinguishing Volume and Surface Area
Lesson 16: Applying Volume and Surface AreaUnit 7Lesson 13: Popcorn Possibilities
Topic 4: Let’s Put It to Work
Lesson 17: Building Prisms

Unit 8: Probability and Sampling

Topic 1: Probabilities of Single Step Events
Lesson 1: Mystery Bags
Lesson 2: Chance Experiments
Lesson 3: What Are Probabilities?
Unit 8 Lesson 1: How Likely? (Print available) [Free lesson] Lesson 2: Prob-bear-bilities [Free lesson] Lesson 3: Mystery Bag
Lesson 4: Estimating Probabilities Through Repeated ExperimentsUnit 8Lesson 4: Spin ClassLesson 5: Is It Fair?Lesson 6: Fair Games
Lesson 5: More Estimating ProbabilitiesUnit 8Lesson 6: Fair GamesLesson 7: Weather or NotLesson 9: Car, Bike, or Train? (Print available)
Lesson 6: Estimating Probabilities Using SimulationUnit 8Lesson 6: Fair GamesLesson 7: Weather or NotLesson 8: Simulate ItLesson 9: Car, Bike, or Train? (Print available)
Topic 2: Probabilities of Multi-step Events
Lesson 7: Simulating Multi-step EventsUnit 8Lesson 7: Weather or NotLesson 8: Simulate ItLesson 9: Car, Bike, or Train? (Print available)
Lesson 8: Keeping Track of All Possible OutcomesUnit 8Lesson 4: Spin ClassLesson 5: Is It Fair?Lesson 6: Fair Games
Topic 9: Multi-step experiments
Lesson 10: Designing SimulationsUnit 8Lesson 7: Weather or NotLesson 8: Simulate ItLesson 9: Car, Bike, or Train? (Print available)
Topic 3: Sampling
Lesson 11: Comparing Groups
Lesson 12: Larger Populations
Lesson 13: What Makes a Good Sample?
Lesson 14: Sampling in a Fair Way
Unit 8Lesson 10: Crab Island [Free lesson]Lesson 11: Headlines
Topic 4: Using Samples
Lesson 15: Estimating Population Measures of Center
Lesson 16: Estimating Population Proportions
Unit 8 Lesson 9: Car, Bike, or Train? (Print available)Lesson 10: Crab Island [Free lesson]Lesson 11: HeadlinesLesson 12: Flower Power
Lesson 17: More about Sampling Variability
Lesson 18: Comparing Populations Using Samples
Lesson 19: Comparing Populations with Friends
Unit 8Lesson 9: Car, Bike, or Train? (Print available)Lesson 10: Crab Island [Free lesson]Lesson 13: Plots and SamplesLesson 14: School Newspaper (Print available)Lesson 15: Asthma Rates (Print available)
Topic 5: Let’s Put It to Work
Lesson 20: Memory TestUnit 8Lesson 14: School Newspaper (Print available)Lesson 15: Asthma Rates (Print available)

Grade 8

Unit 1: Rigid Transformations and Congruence

Illustrative MathematicsDesmos Math 6–A1
Topic 1: Rigid Transformations 
Lesson 1: Moving in the PlaneUnit 1Lesson 1: Transformers [Free lesson]
Lesson 2: Naming the MovesUnit 1Lesson 2: Spinning, Flipping, Sliding [Free lesson]
Lesson 3: Grid MovesUnit 1Lesson 3: Transformation GolfLesson 4: Moving Day (Print available) [Free lesson]Lesson 5: Getting CoordinatedUnit 3Lesson 6: Translations
Lesson 4: Making the MovesUnit 1Lesson 1: Transformers [Free lesson]Lesson 2: Spinning, Flipping, Sliding [Free lesson]Lesson 4: Moving Day (Print available) [Free lesson]Lesson 5: Getting Coordinated
Lesson 5: Coordinate MovesUnit 1Lesson 4: Moving Day (Print available) [Free lesson]Lesson 5: Getting Coordinated
Lesson 6: Describing TransformationsUnit 1Lesson 5: Getting CoordinatedLesson 6: Connecting the Dots [Free lesson]
Topic 2: Properties of Rigid Transformations 
Lesson 7: No Bending or StretchingUnit 1Lesson 7: No Bending, No Stretching
Lesson 8: Rotation PatternsUnit 1Lesson 1: Transformers [Free lesson]Lesson 2: Spinning, Flipping, Sliding [Free lesson]Lesson 4: Moving Day (Print available) [Free lesson]Lesson 5: Getting Coordinated
Lesson 9: Moves in Parallel
Lesson 10: Composing Figures
Unit 1 Lesson 10: Transforming Angles
Topic 3: Congruence 
Lesson 11: What is the Same?
Lesson 12: Congruent Polygons
Lesson 13: Congruence
Unit 1 Lesson 7: Are They the Same?Lesson 9: Are They Congruent?Practice Day (Print available)
Topic 4: Angles in a Triangle
Lesson 14: Alternate Interior Angles
Lesson 15: Adding the Angles in a Triangle
Unit 1 Lesson 11: Tearing It Up (Print available)
Lesson 16: Parallel Lines and the Angles in a TriangleUnit 1 Lesson 10: Transforming Angles
Topic 5: Let’s Put It to Work
Lesson 17: Rotate and TessellateLesson 13: Tessellate [Free lesson]

Unit 2: Dilations, Similarity, and Introducing Slope

Topic 1: Dilations
Lesson 1: Projecting and ScalingUnit 2Lesson 1: Sketchy Dilations [Free lesson]Lesson 2: Dilation Mini Golf (Print available) [Free lesson]
Lesson 2: Circular Grid
Lesson 3: Dilations with No Grid
Lesson 4: Dilations on a Square Grid
Lesson 5: More Dilations
Unit 2Lesson 1: Sketchy Dilations [Free lesson]Lesson 2: Dilation Mini Golf (Print available) [Free lesson]Lesson 3: Match My DilationLesson 4: Dilations on a Plane
Topic 2: Similarity 
Lesson 6: SimilarityUnit 2Lesson 5: Transformations Golf with DilationsLesson 6: Social Scavenger Hunt (Print available) [Free lesson]
Lesson 7: Similar Polygons 
Lesson 8: Similar Triangles
Lesson 9: Side Length Quotients in Similar Triangles
Unit 2Lesson 7: Are Angles Enough?Lesson 8: Shadows
Topic 3: Slope
Lesson 10: Meet SlopeUnit 2Lesson 9: Water SlideLesson 10: Points on a PlanePractice Day (Print available)Unit 3Lesson 3: PostersLesson 4: Stacking CupsLesson 5: Flags [Free lesson]Lesson 6: Translations Unit 4Lesson 8: When Are They the Same?
Lesson 11: Writing Equations of LinesUnit 3Lesson 3: PostersLesson 6: TranslationsLesson 10: SolutionsLesson 11: Pennies and Quarters Unit 4Lesson 3: Balanced MovesLesson 4: More Balanced Moves (Print available)
Lesson 12: Using Equations of LinesUnit 3Lesson 9: Coin Capture
Topic 4: Let’s Put It to Work
Lesson 13: The Shadow KnowsUnit 2Lesson 8: Shadows

Unit 3: Linear Relationships

Topic 1: Proportional Relationships 
Lesson 1: Understanding Proportional RelationshipsUnit 3Lesson 1: Turtle Time Trials [Free lesson]
Lesson 2: Graphs of Proportional RelationshipsUnit 3Lesson 1: Turtle Time Trials [Free lesson]Lesson 2: Water Tank Unit 5Lesson 4: Window Frames
Lesson 3: Representing Proportional RelationshipsUnit 3Lesson 1: Turtle Time Trials [Free lesson] Unit 5Lesson 4: Window FramesLesson 6: Graphing StoriesLesson 7: Feel the Burn (Print available) [Free lesson]Lesson 8: Charge! (Print available)
Lesson 4: Comparing Proportional RelationshipsUnit 3Lesson 3: Posters
Topic 2: Representing Linear Relationships
Lesson 5: Introduction to Linear RelationshipsUnit 3Lesson 1: Turtle Time Trials [Free lesson]Lesson 4: Stacking CupsUnit 5Lesson 6: Graphing StoriesLesson 7: Feel the Burn (Print available) [Free lesson]Lesson 8: Charge! (Print available)
Lesson 6: More Linear RelationshipsUnit 5Lesson 6: Graphing StoriesLesson 7: Feel the Burn (Print available) [Free lesson]Lesson 8: Charge! (Print available)
Lesson 7: Representations of Linear RelationshipsUnit 3Lesson 5: Flags [Free lesson]Lesson 6: Graphing StoriesLesson 7: Feel the Burn (Print available) [Free lesson]Lesson 8: Charge! (Print available)
Lesson 8: Translating mx + bUnit 3Lesson 3: PostersLesson 6: Translations
Topic 3: Finding Slopes 
Lesson 9: Slopes Don’t Have to be PositiveUnit 3Lesson 5: Flags [Free lesson]Lesson 6: TranslationsLesson 7: Water CoolerLesson 8: Landing Planes
Lesson 10: Calculating SlopeUnit 3Lesson 7: Water CoolerLesson 8: Landing Planes
Lesson 11: Equations of All Kinds of LinesUnit 3Lesson 3: PostersLesson 4: Stacking CupsLesson 5: Flags [Free lesson]Lesson 6: Translations
Topic 4: Linear Equations 
Lesson 12: Solutions to Linear EquationsUnit 3Lesson 3: PostersLesson 6: TranslationsLesson 10: Solutions Unit 4Lesson 3: Balanced MovesLesson 4: More Balanced Moves (Print available)
Lesson 13: More Solutions to Linear EquationsUnit 3 Lesson 4: Stacking CupsLesson 5: Flags [Free lesson]Lesson 6: TranslationsLesson 7: Water CoolerLesson 10: Solutions
Topic 5: Let’s Put It to Work 
Lesson 14: Using Linear Relations to Solve ProblemsUnit 3 Lesson 11: Pennies and Quarters

Unit 4: Linear Equations and Linear Systems

Topic 1: Puzzle Problems 
Lesson 1: Number PuzzlesUnit 4Lesson 1: Number machines
Topic 2: Linear Equation in One Variable 
Lesson 2: Keeping the Equation BalancedUnit 4Lesson 2: Keep It Balanced
Lesson 3: Balanced MovesUnit 4Lesson 3: Balanced Moves
Lesson 4: More Balanced MovesUnit 4Lesson 4: More Balanced Moves (Print available)
Lesson 5: Solving Any Linear EquationUnit 4Lesson 4: More Balanced Moves (Print available)Lesson 5: Equation Roundtable (Print available) [Free lesson]Lesson 6: Strategic Solving (Print available)
Lesson 6: Strategic SolvingUnit 4Lesson 5: Equation Roundtable (Print available) [Free lesson]Lesson 6: Strategic Solving (Print available)
Lesson 7: All, Some, or No Solutions
Lesson 8: How many Solutions?
Unit 4Lesson 7: All, Some, or None?
Lesson 9: When Are They the SameUnit 4Lesson 8: When Are They the Same?
Topic 3: Systems of Linear Equations
Lesson 10: On or Off the Line?Unit 4Lesson 7: All, Some, or None?Lesson 8: When Are They the Same?Lesson 13: All, Some, or None? Part 2
Lesson 11: On Both of the Lines
Lesson 12: Systems of Equations
Lesson 13: Solving Systems of Equations
Unit 4 Lesson 9: On or Off the Line?Lesson 10: On Both LinesLesson 11: Make Them Balance [Free lesson]Lesson 12: Line Zapper [Free lesson]Lesson 13: All, Some, or None? Part 2Practice Day 2 (Print available)
Lesson 14: Solving More Systems 
Lesson 15: Writing Systems of EquationsUnit 4 Lesson 14: Strategic Solving, Part 2 (Print available)
Topic 4: Let’s Put It to Work 
Lesson 16: Posing Problems with Systems of EquationsUnit 4 Lesson 14: Strategic Solving, Part 2 (Print available)

Unit 5: Functions and Volume

Topic 1: Inputs and Outputs 
Lesson 1: Inputs and OutputsUnit 5Lesson 1: Turtle Crossing [Free lesson]Lesson 2: Guess My Rule [Free lesson]
Lesson 2: Introduction to FunctionsUnit 5Lesson 1: Turtle Crossing [Free lesson]Lesson 2: Guess My Rule [Free lesson]Lesson 3: Function or Not?
Topic 2: Representing and Interpreting Functions 
Lesson 3: Equations of FunctionsUnit 3Lesson 1: Turtle Time Trials [Free lesson] Unit 5Lesson 3: Function or Not?Lesson 4: Window Frames
Lesson 4: Tables, Equations, and Graphs of Functions
Lesson 5: More Graphs of Functions
Unit 5Lesson 4: Window FramesLesson 5: The Tortoise and the Hare [Free lesson]Lesson 6: Graphing StoriesLesson 7: Feel the Burn (Print available) [Free lesson]Lesson 8: Charge! (Print available)
Lesson 6: Even More Graphs of Functions 
Lesson 7: Connecting Representations of FunctionsUnit 5Lesson 7: Feel the Burn (Print available) [Free lesson]Lesson 8: (Print available)Charge!
Topic 3: Linear Functions and Rates of Change
Lesson 8: Linear FunctionsUnit 2Lesson 9: Water SlideLesson 10: Points on a PlaneUnit 3Lesson 4: Stacking CupsLesson 5: Flags [Free lesson]Lesson 6: Translations
Lesson 9: Linear ModelsUnit 5Lesson 3: PostersLesson 5: The Tortoise and the Hare [Free lesson]Lesson 6: Graphing StoriesLesson 7: Feel the Burn (Print available) [Free lesson]
Lesson 10: Piecewise Linear FunctionsUnit 5Lesson 9: Piecing It Together
Topic 4: Cylinder and Cones 
Lesson 11: Filling Containers 
Lesson 12: How Much Will Fit? 
Lesson 13: The Volume of a CylinderUnit 5Lesson 10: Volume LabLesson 11: Cylinders [Free lesson]Lesson 12: Scaling Cylinders
Lesson 14: Finding Cylinder DimensionsUnit 5Lesson 10: Volume LabLesson 11: Cylinders [Free lesson]Lesson 12: Scaling CylindersLesson 14: Missing Dimensions (Print available)
Lesson 15: The Volume of a ConeUnit 5Lesson 10: Volume LabLesson 13: Cones [Free lesson]Lesson 14: Missing Dimensions (Print available)
Lesson 16: Finding Cone DimensionsUnit 5Lesson 12: Scaling CylindersLesson 13: Cones [Free lesson]Lesson 14: Missing Dimensions (Print available)
Topic 5: Dimensions and Spheres 
Lesson 17: Scaling One DimensionUnit 5Lesson 12: Scaling Cylinders
Lesson 18: Scaling Two Dimensions 
Lesson 19: Estimating a Hemisphere 
Lesson 20: The Volume of a Sphere
Lesson 21: Cylinders, Cones, and Spheres
Unit 5Lesson 15: SpheresPractice Day 2 (Print available)
Topic 6: Let’s Put It to Work 
Lesson 22: Volume As a Function of …Unit 5Lesson 15: Spheres

Unit 6: Associations in Data

Topic 1: Does This Predict That? 
Lesson 1: Organizing DataUnit 6 Lesson 1: Click Battle
Lesson 2: Plotting DataUnit 6 Lesson 2: Wing Span
Topic 2: Associations in Numerical Data 
Lesson 3: What a Point in a Scatter Plot MeansUnit 6 Lesson 1: Click BattleLesson 2: Wing SpanLesson 3: Robots [Free lesson]Lesson 7: Scatter Plot City
Lesson 4: Fitting a LineUnit 6 Lesson 4: Dapper Cats [Free lesson]Lesson 5: Fit Fights [Free lesson]Lesson 6: Interpreting SlopesLesson 8: Animal BrainsPractice Day 1 (Print available) [Free lesson]Practice Day 2 (Print available)
Lesson 5: Describing Trends in Scatter PlotsUnit 6 Lesson 1: Click BattleLesson 2: Wing SpanLesson 3: Robots [Free lesson]Lesson 7: Scatter Plot City(Print available)Practice Day 1 [Free lesson]
Lesson 6: The Slope of a Fitted LineUnit 6 Lesson 6: Interpreting SlopesLesson 7: Scatter Plot CityPractice Day 1 (Print available) [Free lesson]Practice Day 2 (Print available)
Lesson 7: Observing More patterns in Scatter PlotsUnit 6 Lesson 1: Click BattleLesson 2: Wing SpanLesson 3: Robots [Free lesson]Lesson 7: Scatter Plot City
Lesson 8: Analyzing Bivariate DataUnit 6Lesson 9: Tasty Fruit
Topic 3: Associations in Categorical data 
Lesson 9: Looking for AssociationsUnit 6Lesson 10: Finding Associations [Free lesson]Lesson 11: Federal BudgetsPractice Day 3 (Print available)
Lesson 10: Using Data Displays to Find associationsUnit 6Lesson 10: Finding Associations [Free lesson]Lesson 9: Tasty Fruit
Topic 4: Let’s Put It to Work
Lesson 11: Gone in 30 SecondsUnit 6Lesson 11: Federal Budgets

Unit 7: Exponents and Scientific Notation

Topic 1: Exponent Review 
Lesson 1: Exponent ReviewUnit 7 Lesson 1: Circles [Free lesson]Lesson 2: Combining Exponents
Topic 2: Exponent Rules 
Lesson 2: Multiplying Powers of 10
Lesson 3: Powers of Powers of 10
Lesson 4: Dividing Powers of 10
Unit 7 Lesson 3: Power Pairs (Print available) [Free lesson]Lesson 4: Rewriting Powers  
Lesson 5: Negative Exponents with Powers of 10Unit 7 Lesson 5: Zero and Negative ExponentsLesson 6: Write a Rule (Print available)Practice Day 1 (Print available)
Lesson 6: What about Other Bases? 
Lesson 7: Practice with Rational Bases
Lesson 8: Combining Bases 
Topic 3: Scientific Notation 
Lesson 9: Describing Large and Small Numbers using Powers of 10Unit 7 Lesson 7: Scales and Weights
Lesson 10: Representing Large Numbers on the Number Line
Lesson 11: Representing Small Numbers on the Number Line
Unit 7 Lesson 8: Point Zapper
Lesson 12: Applications of Arithmetic with Powers of 10Unit 7  Lesson 8: Point ZapperLesson 9: Use Your Powers
Lesson 13: Defining Scientific Notation
Lesson 14: Multiplying, Dividing, and Estimating with Scientific Notation
Unit 7 Lesson 10: Solar System [Free lesson]Lesson 11: Balance the Scales [Free lesson]Lesson 13: Star Power
Lesson 15: Adding and Subtracting with Scientific NotationUnit 7 Lesson 10: Solar System [Free lesson]Lesson 11: Balance the Scales [Free lesson]Lesson 12: City LightsLesson 13: Star Power
Topic 4: Let’s Put It to Work
Lesson 16: Is a Smartphone Smart Enough to Go to the Moon?Lesson 13: Star Power Practice Day 2 (Print available)

Unit 8: Pythagorean Theorem and Irrational Numbers

Topic 1: Side Lengths and Areas of Squares
Lesson 1: The Areas of Squares and Their Side LengthsUnit 8Lesson 1: Tilted Squares
Lesson 2: Side Lengths and AreasUnit 8Lesson 2: From Squares to RootsLesson 3: Between Squares
Lesson 3: Rational and Irrational Numbers
Lesson 4: Square Roots on the Number Line
Lesson 5: Reasoning about Square RootsUnit 8Lesson 2: From Squares to RootsLesson 3: Between SquaresLesson 4: Root Down [Free lesson]Practice Day 1 (Print available)
Topic 2: The Pythagorean Theorem
Lesson 6: Finding Side Lengths of TrianglesUnit 8Lesson 6: The Pythagorean TheoremLesson 7: Pictures to Prove ItLesson 8: Triangle-Tracing Turtle [Free lesson]
Lesson 7: A Proof of the Pythagorean TheoremUnit 8Lesson 7: Pictures to Prove It
Lesson 8: Finding Unknown Side LengthsUnit 8Lesson 11: Pond Hopper
Lesson 9: The ConverseUnit 8Lesson 9: Make It Right
Lesson 10: Applications of the Pythagorean TheoremUnit 8Lesson 10: Taco Truck [Free lesson]
Lesson 11: Finding Distances in the Coordinate PlaneUnit 8Lesson 11: Pond Hopper
Topic 3: Side Lengths and Volumes of Cubes
Lesson 12: Edge Lengths and Volumes
Lesson 13: Cube Roots
Unit 8Lesson 5: Filling Cubes
Topic 4: Decimal Representation of Rational and Irrational Numbers
Lesson 14: Decimal Representation of Rational and Numbers
Lesson 15: Infinite Decimal expansions
Unit 8Lesson 12: Fractions to DecimalsLesson 13: Decimals to Fractions
Topic 5: Let’s Put It to Work
Lesson 16: When Is the Same Size Not the Same Size?Unit 8Lesson 10: Taco Truck [Free lesson]

Unit 9: Putting It All Together

Topic 1: Tessellations
Lesson 1: Tessellations of the Plane
Lesson 2: Regular Tessellations
Lesson 3: Tessellating Polygons
Topic 2: The Weather
Lesson 4: What Influences Temperature?
Lesson 5: Plotting the Weather
Lesson 6: Using and Interpreting a Mathematical Model

Grade 6

Module 1: Ratios and Unit Rates

Eureka MathDesmos Math 6–A1
Topic A Representing and Reasoning About Ratios 
Lesson 1: Ratios
Lesson 2: Ratios
Unit 2
Lesson 1: Pizza Maker [Free lesson]
Lesson 2: Ratio Rounds (Print available)
Lesson 3: Equivalent Ratios
Lesson 4: Equivalent Ratios
Unit 2
Lesson 3: Rice Ratios
Lesson 4: Fruit Lab [Free lesson]
Lesson 5: Balancing Act
Lesson 7: Mixing Paint, Part 1
Lesson 8 World Records (Print available)
Lesson 11 Community Life (Print available)
Practice Day 1 (Print available)
Lesson 5: Solving Problems by Finding Equivalent Ratios
Lesson 6: Solving Problems by Finding Equivalent Ratios
Unit 2
Lesson 5 Balancing Act
 
Lesson 7: Associated Ratios and the Value of a Ratio
Lesson 8: Equivalent Ratios Defined Through the Value of a Ratio
Unit 2
Lesson 6: Product Prices (Print available)
Lesson 7: Mixing Paint, Part 1
Topic B Collections of Equivalent Ratios 
Lesson 9: Tables of Equivalent RatiosUnit 2
Lesson 6: Product Prices (Print available)
Lesson 7: Mixing Paint, Part 1
Lesson 10: The Structure of Ratio Tables-Additive and MultiplicativeUnit 2
Lesson 10: Balloons
Lesson 11: Community Life (Print available)
Lesson 11: Comparing Ratios Using Ratio TablesUnit 2
Lesson 10: Balloons
Lesson 12: From Ratio Tables to Double Number Line DiagramsUnit 2
Lesson 6: Product Prices (Print available)
Lesson 8: World Records (Print available)
Lesson 12: Mixing Paint, Part 2
Lesson 14: Lunch Waste (Print available)
Practice Day 2 (Print available)
Lesson 13: From Ratio Tables to Equations Using the Value of a Ratio 
Lesson 14: From Ratio Tables, Equations, and Double Number Line Diagrams to Plots on the Coordinate Plane 
Lesson 15: A Synthesis of Representations of Equivalent Ratio Collections 
Topic C Unit Rates 
Lesson 16: From Ratio to RatesUnit 2
Lesson 8: World Records (Print available)
 
Unit 3
Lesson 4: Model Trains
Lesson 5: Soft Serve [Free lesson]
Lesson 6: Welcome to the Robot Factory
Lesson 17: From Rates to Ratios 
Lesson 18: Finding a Rate by Dividing Two QuantitiesUnit 3
Lesson 4: Model Trains
Lesson 5: Soft Serve [Free lesson]
Lesson 6: Welcome to the Robot Factory
Lesson 7: More Soft Serve
Lesson 19: Comparison Shopping-Unit Price and Related Measurement Conversions
Lesson 20: Comparison Shopping-Unit Price and Related Measurement Conversions
Lesson 21: Getting the Job Done—Speed, Work, and Measurement Units
Lesson 22: Getting the Job Done—Speed, Work, and Measurement Units
Unit 3
Lesson 2: Counting Classrooms
Lesson 3: Pen Pals
Lesson 23: Problem-Solving Using Rates, Unit Rates, and Conversions.Unit 3
Lesson 13: A Country as a Village
Topic D Percent 
Lesson 24: Percent and Rates per 100Unit 3
Lesson 8: Lucky Duckies [Free lesson]
Lesson 9: Bicycle Goals
Lesson 25: A Fraction as a Percent 
Lesson 26: Percent of a Quantity.Unit 3
Lesson 10: What´s Missing? (Print available)
Lesson 11: Cost Breakdown
Lesson 27: Solving Percent Problems
Lesson 28: Solving Percent Problems
Lesson 29: Solving Percent Problems
Unit 3
Lesson 10: What´s Missing? (Print available)
Lesson 11: Cost Breakdown
Lesson 12: More Bicycle Goals
Lesson 13: A Country as a Village
Practice Day 2 (Print available)

Module 2: Arithmetic Operations Including Division of Fractions

Lesson 1: Interpreting Division of a Fraction by a Whole Number—Visual Models.Unit 4
Lesson 2: Making Connections (Print available)
Lesson 2: Interpreting Division of a Whole Number by a Fraction —Visual Models.Unit 4
Lesson 1: Cookie Cutter
Lesson 3: Flour Planner [Free lesson]
Lesson 4: Flower Planters
Lesson 5: Garden Bricks (Print available)
Lesson 3: Interpreting and Computing Division of a Fraction by a Fraction—More Models
Lesson 4: Interpreting and Computing Division of a Fraction by a Fraction—More Models
Unit 4
Lesson 5: Garden Bricks
Lesson 6: Fill the Gap [Free lesson]
Lesson 7: Break It Down
Lesson 8: Potting Soil
Lesson 9: Division Challenges
Lesson 10: Swap Meet (Print available)
Practice Day
Lesson 5: Creating Division Stories. 
Lesson 6: More Division Stories. 
Lesson 7: The Relationship Between Visual Fraction Models and Equations 
Lesson 8: Dividing Fractions and Mixed NumbersUnit 4
Lesson 5: Garden Bricks (Print available)
Lesson 6: Fill the Gap [Free lesson]
Topic B Multi-Digit Decimal Operations—Adding, Subtracting, and Multiplying
Lesson 9: Sums and Differences of DecimalsUnit 5
Lesson 2: Decimal Diagrams [Free lesson]
Lesson 3: Fruit by the Pound
Lesson 4: Missing Digits
Lesson 10: The Distributive Property and the Products of DecimalsUnit 5
Lesson 5: Decimal Multiplication
Lesson 6: Multiplying with Areas
Lesson 7: Multiplication Methods (Print available)
Lesson 11: Fraction Multiplication and the Products of DecimalsUnit 5
Lesson 7: Multiplication Methods (Print available)
Topic C Dividing Whole Numbers and Decimals
Lesson 12: Estimating Digits in a Quotient 
Lesson 13: Dividing Multi-Digit Numbers Using the AlgorithmUnit 5
Lesson 9: Long Division Launch
Practice Day 1 (Print available)
Practice Day 2 (Print available)
Lesson 14: The Division Algorithm—Converting Decimal Division into Whole Number Division Using Fractions. 
Lesson 15: The Division Algorithm—Converting Decimal Division into Whole Number Division Using Mental Math 
Topic D Number Theory—Thinking Logically About Multiplicative Arithmetic 
Lesson 16: Even and Odd Numbers 
Lesson 17: Divisibility Tests for 3 and 9 
Lesson 18: Least Common Multiple and Greatest Common FactorUnit 5
Lesson 14: Common Multiples
Lesson 15: Common Factors
Practice Day 2 (Print available)
Lesson 19: The Euclidean Algorithm as an Application of the Long Division Algorithm 

Module 3: Rational Numbers

Lesson 1: Positive and Negative Numbers on the Number Line—Opposite Direction and ValueUnit 7Lesson 2: Digging Deeper
Lesson 2: Real-World Positive and Negative Numbers and Zero.
Lesson 3: Real-World Positive and Negative Numbers and Zero.
Unit 7 Lesson 4: Sub-Zero
Lesson 4: The Opposite of a Number
Lesson 5: The Opposite of a Number’s Opposite
Lesson 6: Rational Numbers on the Number Line
Unit 7Lesson 2: Digging Deeper
Topic B Order and Absolute Value
Lesson 7: Ordering Integers and Other Rational Numbers
Lesson 8: Ordering Integers and Other Rational Numbers
Lesson 9: Comparing Integers and Other Rational Numbers
Unit 7Lesson 3: Order in the Class (Print available) [Free lesson]
Lesson 10: Writing and Interpreting Inequality Statements Involving Rational Numbers 
Lesson 11: Absolute Value—Magnitude and Distance
Lesson 12: The Relationship Between Absolute Value and Order
Unit 7Lesson 5: Distance on the Number Line
Lesson 13: Statements of Order in the Real World. 
Topic C Rational Numbers and the Coordinate Plane 
Lesson 14: Ordered Pairs
Lesson 15: Locating Ordered Pairs on the Coordinate Plane
Unit 7Lesson 9: Sand Dollar SearchLesson 10: The A-maze-ing Coordinate PlaneLesson 11: Polygon Maker
Lesson 16: Symmetry in the Coordinate Plane. 
Lesson 17: Drawing the Coordinate Plane and Points on the PlaneLesson 10: The A-maze-ing Coordinate Plane
Lesson 18: Distance on the Coordinate PlaneUnit 7Lesson 11: Polygon Maker
Lesson 19: Problem Solving and the Coordinate PlaneUnit 7Lesson 12: Graph Telephone (Print available)Practice Day 2 (Print available)

Module 4: Expressions and Equations

Topic A Relationships of the Operations 
Lesson 1: The Relationship of Addition and Subtraction 
Lesson 2: The Relationship of Multiplication and Division 
Lesson 3: The Relationship of Multiplication and Addition. 
Lesson 4: The Relationship of Division and Subtraction 
Topic B Special Notations of Operations 
Lesson 5: ExponentsUnit 6Lesson 10: PowersLesson 11: Exponent Expressions (Print available)Practice Day 2 (Print available)
Lesson 6: The Order of Operations 
Topic C Replacing Letters and Numbers 
Lesson 7: Replacing Letters with Numbers
Lesson 8: Replacing Numbers with Letters
Unit 6Lesson 7: Border TilesLesson 12: Squares and Cubes
Topic D Expanding, Factoring, and Distributing Expressions 
Lesson 9: Writing Addition and Subtraction ExpressionsUnit 6Lesson 6: Vari-applesLesson 8: Products and Sums [Free lesson]Lesson 9: Products, Sums, and Differences
Lesson 10: Writing and Expanding Multiplication Expressions
Lesson 11: Factoring Expressions
Lesson 12: Distributing Expressions
Unit 6Lesson 8: Products and Sums [Free lesson]Lesson 9: Products, Sums, and Differences
Lesson 13: Writing Division Expressions 
Lesson 14: Writing Division Expressions 
Topic E Expressing Operations in Algebraic Form 
Lesson 15: Read Expressions in Which Letters Stand for Numbers
Lesson 16: Write Expressions in Which Letters Stand for Numbers
Lesson 17: Write Expressions in Which Letters Stand for Numbers
Unit 6Lesson 6: Vari-applesLesson 7: Border Tiles
Topic F Writing and Evaluating Expressions and Formulas 
Lesson 18: Writing and Evaluating Expressions—Addition and Subtraction
Lesson 19: Substituting to Evaluate Addition and Subtraction Expressions
Lesson 20: Writing and Evaluating Expressions—Multiplication and Division
Lesson 21: Writing and Evaluating Expressions—Multiplication and Addition
Unit 6Lesson 7: Border TilesLesson 8: Products and Sums [Free lesson]Lesson 9: Products, Sums, and DifferencesLesson 12: Squares and Cubes
Lesson 22: Writing and Evaluating Expressions—ExponentsUnit 6Lesson 10: PowersLesson 11: Exponent Expressions (Print available)Lesson 12: Squares and CubesPractice Day 2 (Print available)
Topic G Solving Equations 
Lesson 23: True and False Number Sentences
Lesson 24: True and False Number Sentences
Unit 6Lesson 1: Weight for It [Free lesson]
Lesson 25: Finding Solutions to Make Equations TrueUnit 6Lesson 1: Weight for It [Free lesson]Lesson 2: Five Equations
Lesson 26: One-Step Equations—Addition and SubtractionUnit 6Lesson 1: Weight for It [Free lesson]Lesson 2: Five EquationsLesson 3: Hanging Around
Lesson 27: One-Step Equations—Multiplication and Division
Lesson 28: Two-Step Problems—All Operations
Lesson 29: Multi-Step Problems—All Operations
Unit 6Lesson 3: Hanging AroundLesson 4: Hanging It UpLesson 5: Swap and Solve
Topic H Applications of Equations 
Lesson 30: One-Step Problems in the Real World
Lesson 31: Problems in Mathematical TermsLesson Lesson 32: Multi-Step Problems in the Real World
Unit 6Lesson 3: Hanging AroundLesson 4: Hanging It UpLesson 5: Swap and SolvePractice Day 1 (Print available)
Lesson 33: From Equations to Inequalities
Lesson 34: Writing and Graphing Inequalities in Real-World Problems
Unit 7Lesson 6: Tunnel Travel [Free lesson]Lesson 7: Comparing WeightsLesson 8: Shira´s Solutions

Module 5: Area, Surface Area, and Volume Problems

Topic A: Area of Triangles, Quadrilaterals, and Polygons
Lesson 1: The Area of Parallelograms Through Rectangle FactsUnit 1Lesson 3: Exploring Parallelograms (Print available) [Free lesson]Lesson 4: Off the Grid
Lesson 2: The Area of Right Triangles
Lesson 3: The Area of Acute Triangles Using Height and Base
Unit 1Lesson 5: Exploring Triangles (Print available)Lesson 6: Triangles and ParallelogramsLesson 7: Off the Grid, Part 2
Lesson 4: The Area of All Triangles Using Height and BaseUnit 1Lesson 6: Triangles and ParallelogramsLesson 7: Off the Grid, Part 2
Lesson 5: The Area of Polygons Through Composition and DecompositionUnit 1Lesson 2: LettersLesson 8: Pile of PolygonsPractice Day 1 (Print available)
Lesson 6: Area in the Real World 
Topic B Polygons on the Coordinate Plane 
Lesson 7: Distance on the Coordinate PlaneUnit 1Lesson 8: Pile of Polygons
Lesson 8: Drawing Polygons in the Coordinate PlaneUnit 7Lesson 11: Polygon Maker
Lesson 9: Determining Perimeter and Area of Polygons on the Coordinate PlaneUnit 1Lesson 8: Pile of Polygons
Lesson 10: Distance, Perimeter, and Area in the Real World 
Topic C Volume of Right Rectangular Prisms 
Lesson 11: Volume with Fractional Edge Lengths and Unit CubesUnit 4Lesson 11: Classroom ComparisonsLesson 12: Puzzling Areas (Print available) [Free lesson]Lesson 13: Volume ChallengesLesson 14: Planter Planner (Print available)
Lesson 12: From Unit Cubes to the Formulas for Volume  
Lesson 13: The Formulas for Volume 
Lesson 14: Volume in the Real WorldUnit 4Lesson 14: Planter Planner (Print available)
Topic D Nets and Surface Area 
Lesson 15: Representing Three-Dimensional Figures Using Nets
Lesson 16: Constructing Nets
Lesson 17: From Nets to Surface Area
Unit 1Lesson 10: Plenty of PolyhedraLesson 11: Nothing But Nets (Print available)Lesson 13: Take It To Go (Print available)
Lesson 18: Determining Surface Area of Three-Dimensional FiguresUnit 1Lesson 9: Renata´s Stickers [Free lesson]Lesson 10: Plenty of PolyhedraLesson 11: Nothing But Nets (Print available)Lesson 13: Take It To Go (Print available)Practice Day 2 (Print available)
Lesson 19: Surface Area and Volume in the Real World 
Lesson 19a: Addendum Lesson for Modeling―Applying Surface Area and Volume to Aquariums 
Lesson 3: The Area of Acute Triangles Using Height and BaseUnit 1Lesson 5 Exploring TrianglesLesson 6 Triangles and ParallelogramsLesson 7 Off the Grid, Part 2

Module 6: Statistics

Topic A Understanding Distributions 
Lesson 1: Posing Statistical QuestionsUnit 8 Lesson 1: Screen TimeLesson 2: Dot Plots
Lesson 2: Displaying a Data Distribution
Lesson 3: Creating a Dot Plot
Unit 8 Lesson 2: Dot PlotsLesson 3: Minimum Wage (Print available) [Free lesson]Lesson 4: Lots More Dots
Lesson 4: Creating a Histogram
Lesson 5: Describing a Distribution Displayed in a Histogram
Unit 8Lesson 5: The Plot Thickens [Free lesson]Lesson 6: DIY Histograms (Print available)
Topic B Summarizing a Distribution That Is Approximately Symmetric Using the Mean and Mean Absolute Deviation 
Lesson 6: Describing the Center of a Distribution Using the Mean
Lesson 7: The Mean as a Balance Point
Unit 8Lesson 7: Snack Time
Lesson 8: Variability in a Data DistributionUnit 8Lesson 8: Pop It!
Topic 9: The Mean Absolute Deviation (MAD).Unit 8Lesson 9: Hoops
Lesson 10: Describing Distributions Using the Mean and MAD
Lesson 11: Describing Distributions Using the Mean and MAD
Unit 8Lesson 10 Hollywood Part 1Practice Day 1 (Print available)
Topic C Summarizing a Distribution That Is Skewed Using the Median and the Interquartile Range 
Lesson 12: Describing the Center of a Distribution Using the MedianUnit 8Lesson 11: Toy Cars [Free lesson]Lesson 12: In the News
Lesson 13: Describing Variability Using the Interquartile Range (IQR)Unit 8Lesson 13: Pumpkin Patch
Lesson 14: Summarizing a Distribution Using a Box Plot
Lesson 15: More Practice with Box Plots
Unit 8Lesson 14: Car, Plane, Bus, or Train? (Print available)
Lesson 16: Understanding Box PlotsUnit 8Lesson 14: Car, Plane, Bus, or Train? (Print available)Lesson 15: Hollywood Part 2Lesson 16: Hollywood Part 3 (Print available)Practice Day 2 (Print available)
Topic D Summarizing and Describing Distributions 
Lesson 17: Developing a Statistical Project 
Lesson 18: Connecting Graphical Representations and Numerical SummariesUnit 8Lesson 5: The Plot Thickens [Free lesson]
Lesson 19: Comparing Data DistributionsUnit 8Lesson 15: Hollywood Part 2
Lesson 20: Describing Center, Variability, and Shape of a Data Distribution from a Graphical Representation
Lesson 21: Summarizing a Data Distribution by Describing Center, Variability, and Shape
Unit 8Lesson 16: Hollywood Part 3 (Print available)
Lesson 22: Presenting a Summary of a Statistical Project 
Lesson 3: Creating a Dot PlotUnit 8Lesson 2 Dot PlotsLesson 3 Minimum Wage [Free lesson]Lesson 4 Lots More Dots

Grade 7

Module 1: Ratios and Proportional Relationships

Eureka MathDesmos Math 6–A1
Topic A Proportional Relationships 
Lesson 1: An Experience in Relationships as Measuring RateUnit 2
Lesson 1: Paint [Free lesson]
Lesson 2: Balloon Float
 
Unit 4
Lesson 1: Mosaics [Free lesson]
Lesson 2: Peach Cobbler (Print available)
Lesson 2: Proportional RelationshipsUnit 2  
Lesson 2: Balloon Float
Lesson 3: Sugary Drinks (Print available)
 
Unit 4
Lesson 3: Sticker Sizes
Lesson 3: Identifying Proportional and Non-Proportional Relationships in Tables
Lesson 4: Identifying Proportional and Non-Proportional Relationships in Tables
Unit 2
Lesson 2: Balloon Float
Lesson 3: Sugary Drinks (Print available)
Lesson 4: Robot Factory
Lesson 5: Identifying Proportional and Non-Proportional Relationships in Graphs
Lesson 6: Identifying Proportional and Non-Proportional Relationships in Graphs
Unit 2
Lesson 8: Dino Pops [Free lesson]
Lesson 9: Gallon Challenge
Lesson 10: Three Turtles
Lesson 11: Four Representations (Print available)
Lesson 12: Water Efficiency
Topic B Unit Rate and the Constant of Proportionality 
Lesson 7: Unit Rate as the Constant of ProportionalityUnit 2
Lesson 2: Balloon Float
Lesson 8: Representing Proportional Relationships with Equations
Lesson 9: Representing Proportional Relationships with Equations
Unit 2
Lesson 4: Robot Factory
Lesson 5: Snapshots
Lesson 6: Two and Two (Print available) [Free lesson]
Lesson 7: All Kinds of Equations
Lesson 10: Interpreting Graphs of Proportional RelationshipsUnit 2
Lesson 8: Dino Pops [Free lesson]
Lesson 9: Gallon Challenge
Lesson 10: Three Turtles
Lesson 11: Four Representations (Print available)
Lesson 12: Water Efficiency
Topic C Ratios and Rates Involving Fractions 
Lesson 11: Ratios of Fractions and Their Unit Rates
Lesson 12: Ratios of Fractions and Their Unit Rates
Unit 2
Lesson 3: Sugary Drinks (Print available)
Lesson 4: Robot Factory
Lesson 5: Snapshots
Lesson 6: Two and Two [Free lesson]
Lesson 13: Finding Equivalent Ratios Given the Total QuantityUnit 2  
Lesson 2: Balloon Float
Lesson 3: Sugary Drinks (Print available)
Lesson 14: Multi-Step Ratio Problems 
Lesson 15: Equations of Graphs of Proportional Relationships Involving FractionsUnit 2
Lesson 8: Dino Pops [Free lesson]
Lesson 9: Gallon Challenge
Lesson 10: Three Turtles
Lesson 11: Four Representations
Lesson 12: Water Efficiency
Topic D Ratios of Scale Drawings 
Lesson 16: Relating Scale Drawings to Ratios and RatesUnit 1
Lesson 1: Scaling Machines [Free lesson]
Lesson 17: The Unit Rate as the Scale FactorUnit 1
Lesson 2: Scaling Robots
Lesson 3: Make It Scale
Lesson 4: Scale Factor Challenges
Practice Day 1 (Print available)
Lesson 18: Computing Actual Lengths from a Scale DrawingUnit 1
Lesson 6: Introducing Scale
Lesson 7: Will It Fit? (Print available) [Free lesson]
Lesson 19: Computing Actual Areas from a Scale DrawingUnit 1
Lesson 5: Tiles
Lesson 6: Introducing Scale
Lesson 7: Will It Fit? (Print available) [Free lesson]
Lesson 8: Scaling States (Print available)
Lesson 20: An Exercise in Creating a Scale Drawing
Lesson 21: An Exercise in Changing Scales
Lesson 22: An Exercise in Changing Scales
Unit 1
Lesson 8: Scaling States (Print available)
Lesson 9: Scaling Buildings
Lesson 10: Room Redesign (Print available)
Practice Day 2 (Print available)

Module 2: Rational Numbers

Topic A Addition and Subtraction of Integers and Rational Numbers 
Lesson 1: Opposite Quantities Combine to Make ZeroUnit 5
Lesson 1: Floats and Anchors [Free lesson]
Lesson 2: Using the Number Line to Model the Addition of Integers
Lesson 3: Understanding Addition of Integers
Lesson 4: Efficiently Adding Integers and Other Rational Numbers
Lesson 5: Understanding Subtraction of Integers and Other Rational Numbers
Unit 5
Lesson 2: More Floats and Anchors
Lesson 4: Draw Your Own (Print available) [Free lesson]
Lesson 5: Number Puzzles
Lesson 10: Integer Puzzles [Free lesson]
Lesson 11: Changing Temperatures
Lesson 13: Solar Panels and More (Print available)
Lesson 6: The Distance Between Two Rational Numbers 
Lesson 7: Addition and Subtraction of Rational NumbersUnit 5
Lesson 3: Bumpers
Lesson 4: Draw Your Own (Print available) [Free lesson]
Lesson 5: Number Puzzles
Lesson 10; Integer Puzzles [Free lesson]
Lesson 11: Changing Temperatures
Lesson 13: Solar Panels and More (Print available)
Practice Day 1 (Print available)
Lesson 8: Applying the Properties of Operations to Add and Subtract Rational Numbers 
Lesson 9: Applying the Properties of Operations to Add and Subtract Rational Numbers 
Topic B Multiplication and Division of Integers and Rational Numbers 
Lesson 10: Understanding Multiplication of Integers
Lesson 11: Develop Rules for Multiplying Signed Numbers
Unit 5
Lesson 6: Floating in Groups
Lesson 7: Back in Time
Lesson 8: Speeding Turtles
Lesson 10: Integer Puzzles [Free lesson]
Practice Day 2 (Print available)
Lesson 12: Division of IntegersUnit 5
Lesson 8: Speeding Turtles
Lesson 13: Converting Between Fractions and Decimals Using Equivalent Fractions 
Lesson 14: Converting Rational Numbers to Decimals Using Long DivisionUnit 4
Lesson 13: Decimal Deep Dive (Print available)
Lesson 15: Multiplication and Division of Rational NumbersUnit 5
Lesson 8: Speeding Turtles
Lesson 10: Integer Puzzles [Free lesson]
Lesson 12: Arctic Sea Ice (Print available)
Lesson 13: Solar Panels and More (Print available)
Practice Day 2 (Print available)
Lesson 16: Applying the Properties of Operations to Multiply and Divide Rational Numbers 
Topic C Applying Operations with Rational Numbers to Expressions and Equations 
Lesson 17: Comparing Tape Diagram Solutions to Algebraic SolutionsUnit 6
Lesson 2: Smudged Receipts
Lesson 3: Equations
Lesson 4: Seeing Structure (Print available)
Lesson 18: Writing, Evaluating, and Finding Equivalent Expressions with Rational Numbers
Lesson 19: Writing, Evaluating, and Finding Equivalent Expressions with Rational Numbers
Unit 5
Lesson 9 Expressions
Lesson 20: Investments—Performing Operations with Rational Numbers
Lesson 21: If-Then Moves with Integer Number Cards
Lesson 22: Solving Equations Using Algebra
Lesson 23: Solving Equations Using Algebra
Unit 6
Lesson 3: Equations
Lesson 4: Seeing Structure (Print available)
Lesson 6: Balancing Equations
Lesson 7: Keeping It True (Print available)
Lesson 12: Community Day (Print available)
 
Unit 5
Lesson 3: Bumpers

Module 3: Expressions and Equations

Topic A Use Properties of Operations to Generate Equivalent Expressions 
Lesson 1: Generating Equivalent Expressions
Lesson 2: Generating Equivalent Expressions
Unit 5 Lesson 9: Expressions (Print available)Unit 6Lesson 9: Always-Equal MachinesLesson 11: Equation Roundtable (Print available)
Lesson 3: Writing Products as Sums and Sums as Products
Lesson 4: Writing Products as Sums and Sums as Products
Unit 6 Lesson 2: Smudged ReceiptsLesson 6: Balancing EquationsLesson 7: Keeping It True (Print available)Lesson 8: Factoring and ExpandingLesson 9: Always-Equal MachinesLesson 10: Collect the Squares [Free lesson]Lesson 11: Equation Roundtable (Print available)Lesson 12: Community Day (Print available)
Lesson 5: Using the Identity and Inverse to Write Equivalent Expressions 
Lesson 6: Collecting Rational Number Like Terms 
Topic B Solve Problems Using Expressions, Equations, and Inequalities 
Lesson 7: Understanding EquationsUnit 6Lesson 2: Smudged ReceiptsLesson 5: Balancing MovesLesson 6: Balancing Equations
Lesson 8: Using If-Then Moves in Solving Equations
Lesson 9: Using If-Then Moves in Solving Equations
Unit 6Lesson 2: Smudged ReceiptsLesson 6: Balancing EquationsLesson 7: Keeping It True (Print available)Lesson 8: Factoring and Expanding (Print available)Lesson 9: Always-Equal MachinesLesson 10: Collect the Squares [Free lesson]Lesson 11: Equation Roundtable (Print available)Lesson 12: Community Day (Print available)Practice Day 1 (Print available)
Lesson 10: Angle Problems and Solving EquationsUnit 7Lesson 2: Friendly Angles [Free lesson]Lesson 3: Angle DiagramsLesson 4: Missing Measures (Print available) [Free lesson]
Lesson 11: Angle Problems and Solving Equations 
Lesson 12: Properties of Inequalities
Lesson 13: Inequalities
Lesson 14: Solving Inequalities
Unit 6Lesson 14: Unbalanced HangersLesson 15: Budgeting (Print available)Lesson 16: Shira the Sheep [Free lesson]Lesson 17: Write Them and Solve Them (Print available)
Lesson 15: Graphing Solutions to InequalitiesUnit 6Lesson 13: I Saw the SignsPractice Day 2 (Print available)
Topic C Use Equations and Inequalities to Solve Geometry Problems 
Lesson 16: The Most Famous Ratio of AllUnit 3Lesson 2: Is It a Circle?Lesson 3: Measuring Around [Free lesson]
Lesson 17: The Area of a CircleUnit 3Lesson 5: Area StrategiesLesson 6: Radius Squares (Print available)Lesson 7: Why Pi? (Print available)Lesson 8: Area Challenges [Free lesson]Lesson 9: Circle vs. SquarePractice Day 2 (Print available)
Lesson 18: More Problems on Area and CircumferenceUnit 3Lesson 4: Perimeter ChallengesLesson 5: Area StrategiesLesson 6: Radius Squares (Print available)Lesson 7: Why Pi? (Print available)Lesson 8: Area Challenges [Free lesson]Lesson 9: Circle vs. Square
Lesson 19: Unknown Area Problems on the Coordinate Plane
Lesson 20: Composite Area Problems
Unit 3Lesson 4: Perimeter ChallengesPractice Day 2 (Print available)
Lesson 21: Surface Area
Lesson 22: Surface Area
Lesson 23: The Volume of a Right Prism
Lesson 24: The Volume of a Right Prism
Unit 7Lesson 10: Simple PrismsLesson 11: More Complicated Prisms Lesson 12: Surface Area Strategies (Print Available)Lesson 13: Popcorn PossibilitiesPractice Day 2 (Print available)
Lesson 25: Volume and Surface Area
Lesson 26: Volume and Surface Area
Unit 7Lesson 13: Popcorn PossibilitiesPractice Day 2

Module 4: Percent and Proportional Relationships

Topic A Finding the Whole 
Lesson 1: PercentUnit 4Lesson 1: Mosaics [Free lesson]Lesson 2: Peach Cobbler (Print available)Lesson 3: Sticker Sizes
Lesson 2: Part of a Whole as a PercentUnit 4Lesson 1: Mosaics [Free lesson]Lesson 2: Peach Cobbler (Print available)
Lesson 3: Comparing Quantities with PercentUnit 4Lesson 1: Mosaics [Free lesson]Lesson 2: Peach Cobbler (Print available)Lesson 3: Sticker Sizes
Lesson 4: Percent Increase and DecreaseUnit 4Lesson 4: More and LessLesson 5: All the EquationsLesson 6: 100% (Print available)Lesson 7: Percent machines [Free lesson]Lesson 8: Tax and TipLesson 9: Minimum Wage (Print available)Lesson 10: Cost of College (Print available)Lesson 11: Bookcase BuilderLesson 12: Posing Percent Problems [Free lesson]
Lesson 5: Finding One Hundred Percent Given Another Percent 
Lesson 6: Fluency with PercentsUnit 4Lesson 7: Percent machines [Free lesson]Lesson 8: Tax and TipLesson 9: Minimum Wage (Print available)Lesson 10: Cost of College (Print available)Lesson 11: Bookcase BuilderLesson 12: Posing Percent Problems [Free lesson]
Topic B Percent Problems Including More Than One Whole 
Lesson 7: Markup and Markdown ProblemsUnit 4Lesson 7: Percent machines [Free lesson]Lesson 8: Tax and TipLesson 9: Minimum Wage (Print available)Lesson 10: Cost of College (Print available)Lesson 11: Bookcase BuilderLesson 12: Posing Percent Problems [Free lesson]
Lesson 8: Percent Error Problems
Lesson 9: Problem Solving When the Percent Changes
Unit 4Lesson 4: More and LessLesson 5: All the EquationsLesson 6: 100% (Print available)Lesson 7: Percent machines [Free lesson]Lesson 8: Tax and TipLesson 9: Minimum Wage (Print available)Lesson 10: Cost of College (Print available)Lesson 11: Bookcase BuilderLesson 12: Posing Percent Problems [Free lesson]
Lesson 10: Simple Interest 
Lesson 11: Tax, Commissions, Fees, and Other Real-World Percent ApplicationsUnit 4Lesson 8: Tax and TipLesson 9: Minimum Wage (Print available)Lesson 10: Cost of College (Print available)Lesson 11: Bookcase BuilderLesson 12: Posing Percent Problems [Free lesson]Practice Day (Print available)
Topic C Scale Drawings 
Lesson 12: The Scale Factor as a Percent for a Scale Drawing 
Lesson 13: Changing ScalesUnit 1Lesson 1: Scaling Machines [Free lesson]Lesson 2: Scaling RobotsLesson 3: Make It ScaleLesson 4: Scale Factor ChallengesLesson 5: TilesLesson 6: Introducing ScaleLesson 7: Will It Fit? (Print available) [Free lesson]Lesson 8: Scaling States (Print available)Lesson 9: Scaling BuildingsLesson 10: Room Redesign (Print available)Practice Day 1 (Print available)Practice Day 2 (Print available) Unit 3Lesson 1 Toothpicks
Lesson 14: Computing Actual Lengths from a Scale DrawingUnit 1Lesson 6: Introducing ScaleLesson 7: Will It Fit? (Print available) [Free lesson]Lesson 8: Scaling States (Print available)Lesson 9: Scaling BuildingsLesson 10: Room Redesign (Print available) Unit 3Lesson 1: Toothpicks
Lesson 15: Solving Area Problems Using Scale DrawingsUnit 1Lesson 5: Tiles
Topic D Population, Mixture, and Counting Problems Involving Percents 
Lesson 16: Population ProblemsUnit 8Lesson 10: Crab Island [Free lesson]Lesson 11: Headlines
Lesson 17: Mixture Problems 
Lesson 18: Counting Problems 

Module 5: Statistics and Probability

Topic A Calculating and Interpreting Probabilities 
Lesson 1: Chance ExperimentsUnit 8Lesson 1: How Likely? (Print available) [Free lesson]Lesson 2: Prob-bear-bilities [Free lesson]Lesson 3: Mystery Bag
Lesson 2: Estimating Probabilities by Collecting Data
Lesson 3: Chance Experiments with Equally Likely Outcomes
Lesson 4: Calculating Probabilities for Chance Experiments with Equally Likely Outcomes
Unit 8Lesson 3: Mystery BagLesson 4: Spin ClassLesson 5: Is It Fair?Lesson 6: Fair Games
Lesson 5: Chance Experiments with Outcomes That Are Not Equally LikelyUnit 8Lesson 4: Spin ClassLesson 5: Is It Fair?Lesson 6: Fair GamesLesson 7: Weather or Not
Lesson 6: Using Tree Diagrams to Represent a Sample Space and to Calculate ProbabilitiesUnit 8Lesson 6: Fair GamesLesson 7: Weather or Not
Lesson 7: Calculating Probabilities of Compound EventsUnit 8Lesson 8: Simulate It! (Print available)Lesson 9: Car, Bike, or Train? (Print available)Practice Day 1 (Print available)
Topic B Estimating Probabilities 
Lesson 8: The Difference Between Theoretical Probabilities and Estimated Probabilities
Lesson 9: Comparing Estimated Probabilities to Probabilities Predicted by a Model
Unit 8Lesson 6: Fair GamesLesson 7: Weather or NotLesson 8: Simulate It! (Print available)Lesson 9: Car, Bike, or Train? (Print available)
Lesson 10: Conducting a Simulation to Estimate the Probability of an EventUnit 8Lesson 7: Weather or NotLesson 8: Simulate It! (Print available)Lesson 9: Car, Bike, or Train? (Print available)
Lesson 11: Conducting a Simulation to Estimate the Probability of an Event
Lesson 12: Applying Probability to Make Informed Decisions
Unit 8Lesson 7: Weather or NotLesson 8: Simulate It! (Print available)
Topic C Random Sampling and Estimating Population Characteristics 
Lesson 13: Populations, Samples, and Generalizing from a Sample to a PopulationUnit 8Lesson 9: Car, Bike, or Train? (Print available)Lesson 10: Crab Island [Free lesson]Lesson 11: HeadlinesLesson 12: Flower Power
Lesson 14: Selecting a Sample
Lesson 15: Random Sampling
Lesson 16: Methods for Selecting a Random Sample
Unit 8Lesson 10: Crab Island [Free lesson]Lesson 11: Headlines
Lesson 17: Sampling VariabilityUnit 8Lesson 9: Car, Bike, or Train? (Print available)Lesson 13: Plots and Samples
Lesson 18: Sampling Variability and the Effect of Sample Size
Lesson 19: Understanding Variability When Estimating a Population Proportion
Unit 8Lesson 9: Car, Bike, or Train? (Print available)Lesson 13: Plots and SamplesLesson 14: School Newspaper (Print available)
Lesson 20: Estimating a Population Proportion 
Topic D Comparing Populations 
Lesson 21: Why Worry About Sampling Variability?Unit 8Lesson 9: Car, Bike, or Train? (Print available)Lesson 13: Plots and SamplesLesson 14: School Newspaper (Print available)
Lesson 22: Using Sample Data to Compare the Means of Two or More Populations
Lesson 23: Using Sample Data to Compare the Means of Two or More Populations
Unit 8Lesson 9: Car, Bike, or Train? (Print available)Lesson 10: Crab Island [Free lesson]Lesson 13: Plots and SamplesLesson 14: School Newspaper (Print available)Lesson 15: Asthma Rates (Print available)

Module 6: Geometry

Topic A Unknown Angles 
Lesson 1: Complementary and Supplementary AnglesUnit 7Lesson 2: Friendly Angles [Free lesson]Lesson 3: Angle Diagrams
Lesson 2: Solving for Unknown Angles Using Equations
Lesson 3: Solving for Unknown Angles Using Equations
Lesson 4: Solving for Unknown Angles Using Equations
Unit 7Lesson 1: PinwheelsLesson 2: Friendly AnglesLesson 3: Angle DiagramsLesson 4: Missing Measures (Print available) [Free lesson]
Topic B Constructing Triangles 
Lesson 5: Identical TrianglesUnit 7Lesson 6: Is It Enough?Lesson 7: More Than One
Lesson 6: Drawing Geometric ShapesUnit 7Lesson 6: Is It Enough?Lesson 7: More Than OneLesson 8: Can You Draw It? (Print available)
Lesson 7: Drawing Parallelograms 
Lesson 8: Drawing TrianglesUnit 7Lesson 5: Can You Build It? [Free lesson]Lesson 6: Is It Enough?Lesson 7: More Than OneLesson 8: Can You Draw It? (Print available)Practice Day 1 (Print available)
Lesson 9: Conditions for a Unique Triangle―Three Sides and Two Sides and the Included
Lesson 10: Conditions for a Unique Triangle—Two Angles and a Given Side Angle
Unit 7Lesson 8: Can You Draw It? (Print available)
Lesson 11: Conditions on Measurements That Determine a TriangleUnit 7Lesson 5: Can You Build It? [Free lesson]Lesson 6: Is It Enough?Lesson 7: More Than OneLesson 8: Can You Draw It? (Print available)Practice Day 1 (Print available)
Lesson 12: Unique Triangles―Two Sides and a Non-Included Angle 
Lesson 13: Checking for Identical Triangles
Lesson 14: Checking for Identical Triangles
Unit 7Lesson 6: Is It Enough?Lesson 7: More Than OnePractice Day 1
Lesson 15: Using Unique Triangles to Solve Real-World and Mathematical Problems 
Topic C Slicing Solids 
Lesson 16: Slicing a Right Rectangular Prism with a Plane
Lesson 17: Slicing a Right Rectangular Pyramid with a Plane
Lesson 18: Slicing on an Angle
Unit 7Lesson 9: Slicing Solids
Lesson 19: Understanding Three-Dimensional Figures 
Topic D Problems Involving Area and Surface Area 
Lesson 20: Real-World Area ProblemsUnit 3Lesson 5: Area Strategies
Lesson 21: Mathematical Area ProblemsUnit 3Lesson 5: Area StrategiesLesson 6: Radius Squares (Print available)
Lesson 22: Area Problems with Circular RegionsUnit 3Lesson 5: Area StrategiesLesson 8: Area Challenges [Free lesson]
Lesson 23: Surface Area
Lesson 24: Surface Area
Unit 7Lesson 12: Surface Area Strategies (Print available)Lesson 13: Popcorn Possibilities
Topic E Problems Involving Volume 
Lesson 25: Volume of Right PrismsUnit 7Lesson 10: Simple PrismsLesson 11: More Complicated PrismsLesson 13: Popcorn Possibilities
Lesson 26: Volume of Composite Three-Dimensional ObjectsUnit 7Lesson 11: More Complicated Prisms
Lesson 27: Real-World Volume ProblemsUnit 7Lesson 13: Popcorn Possibilities

Grade 8

Module 1: Integer Exponents and Scientific Notation

Eureka MathDesmos Math 6–A1
Topic A Exponential Notation and Properties of Integer Exponents 
Lesson 1: Exponential NotationUnit 7 Lesson 1 Circles [Free lesson]Lesson 2 Combining Exponents
Lesson 2: Multiplication of Numbers in Exponential Form
Lesson 3: Numbers in Exponential Form Raised to a Power
Unit 7 Lesson 2 Combining ExponentsLesson 3 Power Pairs (Print available) [Free lesson]Lesson 4 Rewriting Powers
Lesson 4: Numbers Raised to the Zeroth Power
Lesson 5: Negative Exponents and the Laws of Exponents
Unit 7 Lesson 5 Zero and Negative ExponentsLesson 6 Write a Rule (Print available)Practice Day 1 (Print available)
Lesson 6: Proofs of Laws of Exponents 
Topic B Magnitude and Scientific Notation 
Lesson 7: MagnitudeUnit 7 Lesson 7 Scales and Weights
Lesson 8: Estimating QuantitiesUnit 7 Lesson 7: Scales and WeightsLesson 8: Point ZapperLesson 9: Use Your Powers
Lesson 9: Scientific Notation
Lesson 10: Operations with Numbers in Scientific Notation
Unit 7 Lesson 10: Solar System [Free lesson]Lesson 11: Balance the Scales [Free lesson]Lesson 13: Star Power
Lesson 11: Efficacy of Scientific NotationUnit 7 Lesson 13: Star Power
Lesson 12: Choice of Unit 
Lesson 13: Comparison of Numbers Written in Scientific Notation and Interpreting Scientific Notation Using TechnologyUnit 7  Lesson 13: Star Power Practice Day 2 (Print available)

Module 2: The Concept of Congruence

Topic A Definitions and Properties of the Basic Rigid Motions 
Lesson 1: Why Move Things Around?
Lesson 2: Definition of Translation and Three Basic Properties
Unit 1Lesson 1: Transformers [Free lesson]Lesson 2: Spinning, Flipping, Sliding [Free lesson]
Lesson 3: Translating LinesUnit 1Lesson 1: Transformers [Free lesson]Lesson 2: Spinning, Flipping, Sliding [Free lesson] Unit 3Lesson 6: Translations
Lesson 4: Definition of Reflection and Basic Properties
Lesson 5: Definition of Rotation and Basic Properties
Lesson 6: Rotations of 180 Degrees
Unit 1Lesson 1: Transformers [Free lesson]Lesson 2: Spinning, Flipping, Sliding [Free lesson]Lesson 4: Moving Day (Print available) [Free lesson]Lesson 5: Getting Coordinated
Topic B Sequencing the Basic Rigid Motions 
Lesson 7: Sequencing Translations
Lesson 8: Sequencing Reflections and Translations
Unit 1Lesson 3: Transformation GolfLesson 6: Connecting the Dots [Free lesson]
Lesson 9: Sequencing Rotations
Lesson 10: Sequences of Rigid Motions
Unit 1Lesson 3: Transformation GolfLesson 6: Connecting the Dots [Free lesson]Lesson 13: Tessellate [Free lesson]Practice Day
Topic C Congruence and Angle Relationships 
Lesson 11: Definition of Congruence and Some Basic PropertiesUnit 1 Lesson 7: Are They the Same?Lesson 8: No Bending, No StretchingLesson 9: Are They Congruent?Practice Day
Lesson 12: Angles Associated with Parallel LinesUnit 1 Lesson 10: Transforming Angles  
Lesson 13: Angle Sum of a TriangleUnit 1 Lesson 11: Tearing It Up (Print available)
Lesson 14: More on the Angles of a TriangleUnit 1 Lesson 11: Tearing It Up (Print available)Lesson 12: Puzzling It Out [Free lesson]
Topic D: The Pythagorean Theorem 
Lesson 15: Informal Proof of the Pythagorean TheoremUnit 8Lesson 7: Pictures to Prove It
Lesson 16: Applications of the Pythagorean TheoremUnit 8Lesson 10: Taco TruckPractice Day 2 (Print available)

Module 3: Similarity

Topic A Dilation 
Lesson 1: What Lies Behind “Same Shape”?Unit 2Lesson 1: Sketchy Dilations [Free lesson]Lesson 2: Dilation Mini Golf [Free lesson]
Lesson 2: Properties of Dilations
Lesson 3: Examples of Dilations
Unit 2Lesson 1: Sketchy Dilations [Free lesson]Lesson 2: Dilation Mini Golf [Free lesson]Lesson 3: Match My DilationLesson 4: Dilations on a Plane (Print available)
Lesson 4: Fundamental Theorem of Similarity
Lesson 5: First Consequences of FTS
Unit 2Lesson 5: Transformations Golf with DilationsLesson 6: Social Scavenger Hunt (Print available) [Free lesson]
Lesson 6: Dilations on the Coordinate PlaneUnit 8Lesson 4: Dilations on a Plane (Print available)
Lesson 7: Informal Proofs of Properties of Dilations 
Topic B Similar Figures 
Lesson 8: Similarity
Lesson 9: Basic Properties of Similarity
Unit 2Lesson 5: Transformations Golf with DilationsLesson 6: Social Scavenger Hunt (Print available) [Free lesson]
Lesson 10: Informal Proof of AA Criterion for SimilarityUnit 2Lesson 7: Are Angles Enough?
Lesson 11: More About Similar TrianglesUnit 2Lesson 7: Are Angles Enough?Lesson 8: Shadows
Lesson 12: Modeling Using SimilarityUnit 2Lesson 8: ShadowsLesson 9: Water SlideLesson 10: Points on a PlanePractice Day 
Topic C The Pythagorean Theorem 
Lesson 13: Proof of the Pythagorean TheoremUnit 8Lesson 6: The Pythagorean TheoremLesson 7: Pictures to Prove ItLesson 8: Triangle-Tracing Turtle [Free lesson]
Lesson 14: The Converse of the Pythagorean TheoremUnit 8 Lesson 9: Make It Right

Module 4: Linear Equations

Topic A Writing and Solving Linear Equations 
Lesson 1: Writing Equations Using Symbols 
Lesson 2: Linear and Nonlinear Expressions in x 
Lesson 3: Linear Equations in xUnit 4Lesson 3: Balanced MovesLesson 4: More Balanced Moves (Print available)
Lesson 4: Solving a Linear EquationUnit 4Lesson 3: Balanced MovesLesson 4: More Balanced MovesLesson 4: More Balanced Moves (Print available)Lesson 5: Equation Roundtable (Print available) [Free lesson]Lesson 6: Strategic Solving (Print available)
Lesson 5: Writing and Solving Linear EquationsUnit 3Lesson 1: Turtle Time Trials Unit 4Lesson 3: Balanced MovesLesson 4: More Balanced Moves (Print available)Lesson 5: Equation Roundtable (Print available) [Free lesson]Lesson 6: Strategic Solving (Print available)
Lesson 6: Solutions of a Linear EquationUnit 3Lesson 10: Solutions Unit 4Lesson 3: Balanced MovesLesson 4: More Balanced Moves (Print available)Lesson 5: Equation Roundtable (Print available) [Free lesson]Lesson 6: Strategic Solving (Print available)
Lesson 7: Classification of SolutionsUnit 4Lesson 7: All, Some, or None?
Lesson 8: Linear Equations in Disguise 
Lesson 9: An Application of Linear Equations 
Topic B Linear Equations in Two Variables and Their GraphsUnit 3Lesson 2: Water TankLesson 3: PostersLesson 4: Stacking CupsLesson 5: Flags [Free lesson]Lesson 6: Translations
Lesson 10: A Critical Look at Proportional RelationshipsUnit 3Lesson 1: Turtle Time Trials [Free lesson]Lesson 2: Water TankLesson 4: Stacking CupsLesson 5: Flags [Free lesson]Lesson 7: Water CoolerLesson 8: Landing PlanesLesson 9: Coin Capture
Lesson 11: Constant RateUnit 2Lesson 9: Water SlideLesson 10: Points on a PlanePractice Day  Unit 3Lesson 3: PostersLesson 4: Stacking CupsLesson 5: Flags [Free lesson]Lesson 6: Translations Unit 4Lesson 8: When Are They the Same?
Lesson 12: Linear Equations in Two VariablesUnit 3Lesson 3: PostersLesson 6: Translations Unit 4Lesson 3: Balanced MovesLesson 4: More Balanced Moves (Print available)
Lesson 13: The Graph of a Linear Equation in Two VariablesUnit 3 Lesson 4: Stacking CupsLesson 5: Flags [Free lesson]Lesson 6: TranslationsLesson 7: Water CoolerLesson 10: SolutionsLesson 11: Pennies and Quarters
Lesson 14: The Graph of a Linear Equation―Horizontal and Vertical LinesUnit 3 Lesson 9: Coin CapturePractice Day  [Free lesson]
Topic C Slope and Equations of Lines 
Lesson 15: The Slope of a Non-Vertical LineUnit 3Lesson 5: Flags [Free lesson]Lesson 6: TranslationsLesson 7: Water CoolerLesson 8: Landing Planes
Lesson 16: The Computation of the Slope of a Non-Vertical LineUnit 3Lesson 7: Water CoolerLesson 8: Landing Planes
Lesson 17: The Line Joining Two Distinct Points of the Graph 𝑦 = 𝑚x + 𝑏 Has Slope mUnit 3Lesson 7: Water Cooler
Lesson 18: There Is Only One Line Passing Through a Given Point with a Given SlopeUnit 3Lesson 5: Flags [Free lesson]Lesson 7: Water Cooler
Lesson 19: The Graph of a Linear Equation in Two Variables Is a LineUnit 3Lesson 4: Stacking CupsLesson 5: Flags [Free lesson]Lesson 6: Translations
Lesson 20: Every Line Is a Graph of a Linear EquationUnit 3Lesson 3: PostersLesson 4: Stacking CupsLesson 5: Flags [Free lesson]Lesson 6: Translations
Lesson 21: Some Facts About Graphs of Linear Equations in Two VariablesUnit 3Lesson 3: PostersLesson 6: TranslationsPractice Day 
Lesson 22: Constant Rates RevisitedUnit 2Lesson 9: Water SlideLesson 10: Points on a Plane Unit 3Lesson 1: Turtle Time Trials [Free lesson]Lesson 2: Water TankLesson 3: Posters
Lesson 23: The Defining Equation of a LineUnit 3Lesson 10: SolutionsLesson 11: Pennies and Quarters
Topic D Systems of Linear Equations and Their Solutions 
Lesson 24: Introduction to Simultaneous EquationsUnit 4Lesson 7: All, Some, or None?Lesson 8: When Are They the Same?Lesson 13: All, Some, or None? Part 2
Lesson 25: Geometric Interpretation of the Solutions of a Linear SystemUnit 4  Lesson 9: On or Off the Line?Lesson 10: On Both LinesLesson 11: Make Them Balance [Free lesson]Lesson 12: Line Zapper [Free lesson]Lesson 13: All, Some, or None? Part 2Practice Day 2 (Print available)
Lesson 26: Characterization of Parallel LinesUnit 3 Lesson 6: Translations
Lesson 27: Nature of Solutions of a System of Linear EquationsUnit 4  Lesson 9: On or Off the Line?
Lesson 28: Another Computational Method of Solving a Linear System 
Lesson 29: Word Problems 
Lesson 30: Conversion Between Celsius and Fahrenheit 
Topic E Pythagorean Theorem 
Lesson 31: System of Equations Leading to Pythagorean Triples 

Module 5: Examples of Functions from Geometry

Topic A Functions 
Lesson 1: The Concept of a FunctionUnit 5 Lesson 1: Turtle Crossing [Free lesson]Lesson 2: Guess My Rule [Free lesson]
Lesson 2: Formal Definition of a FunctionUnit 5 Lesson 1: Turtle Crossing [Free lesson]Lesson 2: Guess My Rule [Free lesson] Lesson 3: Function or Not?
Lesson 3: Linear Functions and ProportionalityUnit 3Lesson 1: Turtle Time Trials [Free lesson] Unit 5Lesson 4: Window Frames
Lesson 4: More Examples of FunctionsUnit 5Lesson 3: Function or Not?Lesson 4: Window Frames
Lesson 5: Graphs of Functions and EquationsUnit 5Lesson 4: Window FramesLesson 5: The Tortoise and the Hare [Free lesson]Lesson 6: Graphing StoriesLesson 7: Feel the Burn (Print available) [Free lesson]Lesson 8: Charge! (Print available)
Lesson 6: Graphs of Linear Functions and Rate of ChangeUnit 2Lesson 9: Water SlideLesson 10: Points on a Plane Unit 3Lesson 4: Stacking CupsLesson 5: Flags [Free lesson]Lesson 6: Translations
Lesson 7: Comparing Linear Functions and GraphsUnit 5Lesson 3: PostersLesson 5: The Tortoise and the Hare [Free lesson]Lesson 6: Graphing StoriesLesson 7: Feel the Burn (Print available) [Free lesson]
Lesson 8: Graphs of Simple Nonlinear Functions 
Topic B Volume 
Lesson 9: Examples of Functions from GeometryUnit 8Lesson 1: Tilted SquaresLesson 2: From Squares to Roots
Lesson 10: Volumes of Familiar Solids—Cones and CylindersUnit 5Lesson 10: Volume LabLesson 11: Cylinders [Free lesson]Lesson 12: Scaling CylindersLesson 13: Cones [Free lesson]Lesson 14: Missing Dimensions (Print available)
Lesson 11: Volume of a SphereUnit 5 Lesson 15: Spheres Practice Day 2 (Print available)

Module 6: Linear Functions

Topic A Linear Functions 
Lesson 1: Modeling Linear RelationshipsUnit 5 Lesson 6: Graphing StoriesLesson 7: Feel the Burn (Print available) [Free lesson]Lesson 8: Charge! (Print available)
Lesson 2: Interpreting Rate of Change and Initial ValueUnit 2Lesson 9: Water SlideLesson 10: Points on a Plane Unit 3Lesson 1: Turtle Time Trials [Free lesson]Lesson 2: Water TankLesson 3: PostersLesson 4: Stacking Cups
Lesson 3: Representations of a LineUnit 5Lesson 6: Graphing StoriesLesson 7: Feel the Burn (Print available) [Free lesson]Lesson 8: Charge! (Print available)
Lesson 4: Increasing and Decreasing Functions
Lesson 5: Increasing and Decreasing Functions
Unit 5Lesson 1: Turtle Crossing [Free lesson]Lesson 5: The Tortoise and the Hare [Free lesson]Lesson 6: Graphing Stories
Topic B Bivariate Numerical Data 
Lesson 6: Scatter Plots
Lesson 7: Patterns in Scatter Plots
Unit 6 Lesson 1: Click BattleLesson 2: Wing SpanLesson 3: Robots [Free lesson]Practice Day 1 (Print available) [Free lesson]
Lesson 8: Informally Fitting a LineUnit 6 Lesson 4: Dapper Cats [Free lesson]Lesson 5: Fit Fights [Free lesson]Lesson 6: Interpreting SlopesLesson 7: Scatter Plot CityLesson 8: Animal BrainsPractice Day 1 (Print available) [Free lesson]Practice Day 2 (Print available)
Lesson 9: Determining the Equation of a Line Fit to Data 
Topic C Linear and Nonlinear Models 
Lesson 10: Linear Models
Lesson 11: Using Linear Models in a Data Context
Unit 5 Lesson 4: Window FramesLesson 5: The Tortoise and the Hare [Free lesson]Lesson 6: Graphing StoriesUnit 6 Lesson 6: Interpreting SlopesLesson 8: Animal BrainsPractice Day 2 (Print available)
Lesson 12: Nonlinear Models in a Data Context 
Topic D Bivariate Categorical Data 
Lesson 13: Summarizing Bivariate Categorical Data in a Two-Way TableUnit 6 Lesson 9: Tasty Fruit
Lesson 14: Association Between Categorical VariablesUnit 6 Lesson 10: Finding Associations [Free lesson] Lesson 11: Federal Budgets Practice Day 3

Module 7: Introduction to Irrational Numbers Using Geometry

Topic A Square and Cube Roots 
Lesson 1: The Pythagorean TheoremUnit 8
Lesson 6: The Pythagorean Theorem
Lesson 2: Square RootsUnit 8
Lesson 2: From Squares to Roots
Lesson 3: Between Squares
Lesson 4: Root Down [Free lesson]
Lesson 3: Existence and Uniqueness of Square Roots and Cube RootsUnit 8
Lesson 5: Filling Cubes
Lesson 4: Simplifying Square RootsUnit 8
Lesson 2: From Squares to Roots
Lesson 3: Between Squares
Lesson 4: Root Down [Free lesson]
Practice Day 1 (Print available)
Lesson 5: Solving Equations with Radicals 
Topic B Decimal Expansions of Numbers 
Lesson 6: Finite and Infinite Decimals
Lesson 7: Infinite Decimals
Lesson 8: The Long Division Algorithm
Lesson 9: Decimal Expansions of Fractions, Part 1
Lesson 10: Converting Repeating Decimals to Fractions
Unit 8
Lesson 12: Fractions to Decimals
Lesson 13: Decimals to Fractions
Lesson 11: The Decimal Expansion of Some Irrational Numbers 
Lesson 12: Decimal Expansions of Fractions, Part 2 
Lesson 13: Comparing Irrational NumbersUnit 8
Lesson 14: Hit the Target
Lesson 14: Decimal Expansion of π 
Topic C The Pythagorean Theorem 
Lesson 15: Pythagorean Theorem, RevisitedUnit 8
Lesson 6: The Pythagorean Theorem
Lesson 7: Pictures to Prove It
Lesson 16: Converse of the Pythagorean TheoremUnit 8
Lesson 9: Make It Right
Lesson 17: Distance on the Coordinate PlaneUnit 8
Lesson 11: Pond Hopper
Lesson 18: Applications of the Pythagorean TheoremUnit 8
Lesson 10: Taco Truck [Free lesson]
Practice Day 2 (Print available)
Topic D Applications of Radicals and Roots 
Lesson 19: Cones and Spheres 
Lesson 20: Truncated Cones 
Lesson 21: Volume of Composite Solids 
Lesson 22: Average Rate of Change 
Lesson 23: Nonlinear Motion 

Families and caregivers, welcome to Amplify Desmos Math K–5!

Welcome to the Amplify Desmos Math K–5 Caregiver Hub. We hope your student enjoys exploring math, working with friends to solve problems, and learning new and interesting concepts. And we hope you enjoy the math journey with them! Below are some suggestions and resources for how you can support their learning at home.

Learn more about Amplify Desmos Math.

Para la versión en español, haga clic aquí.

Three children are engaging in a math activity with a grid and orange markers. One child holds a "9-3" card. The background includes beach elements and abstract math symbols.

Caregiver Unit Resources

For every unit of the program, we’ve created a Caregiver Resource that provides a summary of key concepts, plus a problem from the lesson practice set you can work through with your student. You’ll find a Caregiver Resource for each unit, in both English and Spanish.

Unit 1: Math in Our World

Unit 2: Numbers 1–10

Unit 3: Flat Shapes All Around Us

Unit 4: Understanding Addition and Subtraction

Unit 5: Make and Break Apart Numbers Within 10

Unit 6: Numbers 0–20

Unit 7: Solid Shapes All Around Us

Unit 1: Adding, Subtracting, and Working With Data

Unit 2: Addition and Subtraction Story Problems

Unit 3: Adding and Subtracting Within 20

Unit 4: Numbers to 99

Unit 5: Adding Within 100

Unit 6: Measuring Lengths of Up to 120 Length Units

Unit 7: Geometry and Time

Unit 1: Working With Data and Solving Comparison Problems

Unit 2: Adding and Subtracting Within 100

Unit 3: Measuring Length

Unit 4: Addition and Subtraction on the Number Line

Unit 5: Numbers to 1,000

Unit 6: Geometry and Time

Unit 7: Adding and Subtracting Within 1,000

Unit 8: Equal Groups

Unit 1: Introducing Multiplication

Unit 2: Area and Multiplication

Unit 3: Wrapping Up Addition and Subtraction Within 1,000

Unit 4: Relating Multiplication to Division

Unit 5: Fractions as Numbers

Unit 6: Measuring Length, Time, Liquid Volume, and Weight

Unit 7: Two-Dimensional Shapes and Perimeter

Unit 1: Factors and Multiples

Unit 2: Fraction Equivalence and Comparison

Unit 3: Extending Operations to Fractions

Unit 4: From Hundredths to Hundred Thousands

Unit 5: Multiplicative Comparison and Measurement

Unit 6: Multiplying and Dividing Multi-Digit Numbers

Unit 7: Angles and Properties of Shapes

Unit 1: Volume

Unit 2: Fractions as Quotients and Fraction Multiplication

Unit 3: Multiplying and Dividing Fractions

Unit 4: Multiplication and Division With Multi-Digit Whole Numbers

Unit 5: Place Value Patterns and Decimal Operations

Unit 6: More Decimal and Fraction Operations

Unit 7: Shapes on the Coordinate Plane

Unit refresh videos

Unit 1

  • Sub-Unit 2 – Answering the Question “Are There Enough?”
  • Sub-Unit 3 – Counting and Cardinality

Unit 2

  • Sub-Unit 1 – Comparing 2 Groups Using the Terms More, Fewer, and Same
  • Sub-Unit 2 – Counting Objects in Different Orders
  • Sub-Unit 3 – Making Groups to Represent Numerals
  • Sub-Unit 4 – Comparing Written Numbers

Unit 3

  • Sub-Unit 1 – Identifying Circles and Triangles in Different Sizes and Orientations
  • Sub-Unit 2 – Using Positional Words to Describe the Location of Shapes

Unit 4

  • Sub-Unit 1 – Adding and Subtracting Within 10
  • Sub-Unit 2 – Representing Addition and Subtraction Story Problems
  • Sub-Unit 3 – Finding the Values of Expressions

Unit 5

Unit 1

  • Sub-Unit 1 – Organizing Data to Count How Many in Each Category
  • Sub-Unit 2 – Counting on to Add and Counting Back to Subtract
  • Sub-Unit 3 – Representing 2 Categories of Data With Addition Equations

Unit 2

  • Sub-Unit 1 – Representing and Solving Add To, Change Unknown Story Problems
  • Sub-Unit 2 – Using Addition or Subtraction to Find an Unknown Part of a Total Amount
  • Sub-Unit 3 – Solving Compare, Difference Unknown Problems
  • Sub-Unit 4 – Making Sense of Story Problems With Different Questions

Unit 3

  • Sub-Unit 1 – Finding a Difference Using the Relationship Between Addition and Subtraction
  • Sub-Unit 2 – Using the Structure of Teen Numbers to Find Missing Addends
  • Sub-Unit 3 – Breaking Apart Addends to Make 10 When Adding
  • Sub-Unit 4 – Subtracting From Teen Numbers in Parts to Get to 10

Unit 4

  • Sub-Unit 1 – Adding a Ten To and Subtracting a Ten From Multiples of 10
  • Sub-Unit 2 – Representing and Writing Two-Digit Numbers
  • Sub-Unit 3 – Comparing Two-Digit Numbers
  • Sub-Unit 4 – Representing the Same Two-Digit Number With Different Amounts of Tens and Ones

Unit 5

  • Sub-Unit 1 – Adding a Number of Tens or Ones to a Two-Digit Number
  • Sub-Unit 2 – Adding a Two-Digit Number and a One-Digit Number When Composing a Ten is Necessary
  • Sub-Unit 3 – Adding a Two-Digit Number and a Two-Digit Number When Composing a Ten is Necessary

Unit 1

  • Sub-Unit 1 – Choosing Strategies to Add Within 20
  • Sub-Unit 2 – Representing Data in a Picture Graph and Bar Graph
  • Sub-Unit 3 – Finding the Difference Between 2 Categories Shown on a Bar Graph

Unit 2

  • Sub-Unit 1 – Strategies to Solve Story Problems Involving Money
  • Sub-Unit 2 – Decomposing a Ten When Subtracting by Place
  • Sub-Unit 3 – Making Sense of Story Problems About Comparing That Use the Word More
  • Sub-Unit 4 – Making Sense of One- and Two-Step Story Problems

Unit 3

  • Sub-Unit 1 – Measuring the Length of an Object in Centimeters Using a Ruler
  • Sub-Unit 2 – Measuring Objects in Inches and Feet
  • Sub-Unit 3 – Representing Measurement Data on a Line Plot

Unit 4

  • Sub-Unit 1 – Locating Numbers on Number Lines
  • Sub-Unit 2 – Representing Addition and Subtraction Strategies on a Number Line

Unit 5

  • Sub-Unit 1 – Composing Hundreds to Represent Three-Digit Numbers
  • Sub-Unit 2 – Comparing Three-Digit Numbers

Unit 1

  • Sub-Unit 1 – Representing Equal-Groups Situations With Equal-Groups Drawings
  • Sub-Unit 2 – Representing Arrays With Multiplication Equations
  • Sub-Unit 3 – Representing Data Using Scaled Bar Graphs

Unit 2

  • Sub-Unit 1 – Determining the Area of a Rectangle Using Counting and Skip Counting
  • Sub-Unit 2 – Determining the Area of a Rectangle Using Multiplication
  • Sub-Unit 3 – Decomposing to Determine the Area of Rectilinear Figures

Unit 3

  • Sub-Unit 1 – Using the Expanded Form and Partial Sums Algorithms to Add
  • Sub-Unit 2 – Using the Expanded Form Algorithm to Subtract
  • Sub-Unit 3 – Rounding Numbers to the Nearest Hundred and Ten Using Number Lines
  • Sub-Unit 4 – Representing and Solving Two-Step Story Problems Involving Multiplication

Unit 4

  • Sub-Unit 1 – Representing Division Situations With Equal-Groups Drawings
  • Sub-Unit 2 – Representing an Equal-Groups Problem With a Division and Multiplication Equation
  • Sub-Unit 3 – Using the Distributive Property of Multiplication to Multiply a One-Digit Number by a Teen Number
  • Sub-Unit 4 – Decomposing Dividends to Divide

Unit 5

  • Sub-Unit 1 – Writing Unit and Non-Unit Fractions
  • Sub-Unit 2 – Locating Non-Unit Fractions on the Number Line
  • Sub-Unit 3 – Identifying Equivalent Fractions
  • Sub-Unit 4 – Comparing Fractions With the Same Denominator or Same Numerator

Unit 1

  • Sub-Unit 1 – Using Factor Pairs to Determine All the Possible Side Lengths of a Rectangle With a Given Area
  • Sub-Unit 2 – Finding Multiples and Common Multiples

Unit 2

  • Sub-Unit 1 – Locating Fractions with Different Denominators On the Same Number Line
  • Sub-Unit 2 – Using Multiples or Factors to Determine Equivalent Fractions
  • Sub-Unit 3 – Comparing Fractions Using Equivalent Fractions With Common Denominators

Unit 3

  • Sub-Unit 1 – Adding and Subtracting Fractions with the Same Denominator
  • Sub-Unit 2 – Multiplying Whole Numbers and Fractions
  • Sub-Unit 3 – Adding Fractions with Denominators of 10 and 100

Unit 4

  • Sub-Unit 1 – Writing Fractions With Denominators of 10 and 100 as Decimals
  • Sub-Unit 2 – Relationships Between Place Values in Multi-Digit Whole Numbers
  • Sub-Unit 3 – Comparing Multi-Digit Numbers
  • Sub-Unit 4 – Using the Standard Algorithm to Subtract When Decomposing is Required

Unit 5

  • Sub-Unit 1 – Representing Multiplicative Comparison Situations
  • Sub-Unit 2 – Converting Measurements in the Metric System
  • Sub-Unit 3 – Comparing Measurements

Unit 1

  • Sub-Unit 1 – Using the Layered Structure of a Rectangular Prism to Determine the Volume
  • Sub-Unit 2 – Determining the Volume of a Rectangular Prism
  • Sub-Unit 3 – Determining the Volume of Figures Composed of Rectangular Prisms

Unit 2

  • Sub-Unit 1 – Representing Equal-Sharing Story Problems with Fractional Quotients
  • Sub-Unit 2 – Representing Fractions with Equivalent Multiplication and Division Expressions
  • Sub-Unit 3 – Determining the Area of a Rectangle With a Fractional Side Length

Unit 3

  • Sub-Unit 1 – Representing Multiplication of 2 Unit Fractions with Diagrams
  • Sub-Unit 2 – Dividing Whole Numbers by Unit Fractions

Unit 4

  • Sub-Unit 1 – Multiplying Multi-digit Whole Numbers Using the Partial Products and Standard Algorithms
  • Sub-Unit 2 – Dividing Multi-Digit Whole Numbers Using Partial Quotients
  • Sub-Unit 3 – Representing Multi-Step Story Problems with Equations

Unit 5

  • Sub-Unit 1 – Comparing Decimals
  • Sub-Unit 2 – Using the Standard Algorithms to Add and Subtract Decimals
  • Sub-Unit 3 – Multiplying a Whole Number and a Decimal Using the Distributive Property
  • Sub-Unit 4 – Dividing Whole Numbers by Decimals Less Than 1

Access Amplify Desmos Math at home.

In addition to a print Student Edition workbook, your student will have digital access to all learning, practice, and assessment materials through the Amplify platform. The digital curriculum can be accessed in school and at home by following these instructions:

  • Click the Amplify Desmos Math button.
  • Select Log in with Amplify.
  • Enter your student’s username and password provided by your student’s teacher.
  • Select the desired grade level.

Once logged in, caregivers can view student work by opening previous assignments.

Learn how to navigate the student home page.

Materials overview

Amplify Desmos Math supports blended learning with supporting print materials and a unique digital experience. All K–5 lessons are available in a write-in Student Edition book. Many of the lessons include hands-on activities with manipulatives, tools that help students understand abstract concepts by making them tangible. Your student will also work with digital devices for an age-appropriate number of lessons.

When students use devices, teachers can monitor their work in real time, making sure they get the exact support that they need at every part of the lesson, in and outside of class.

Una interfaz digital que muestra los nombres anónimos de los estudiantes y su estado de participación en diversas actividades. La interfaz incluye opciones para realizar resúmenes, capturas de pantalla y vistas individuales de los estudiantes.

Components of a lesson

Students in an Amplify Desmos Math classroom can be seen (and heard!) asking questions, debating answers, justifying their thinking, grappling with problems, and working together and independently.

A typical Amplify Desmos Math lesson includes:

  • Warm-up: A short, attention-getting problem to pique students’ interest in the lesson.
  • Activities: One to two mini-activities that challenge students’ problem-solving skills.
  • Synthesis: Discussion to review and bring together the important concepts from the lesson.
  • Show What You Know and Reflection: Questions for students to show what they know from the lesson. (Note: The Show What You Know lesson assessment is optional for kindergarten and grade 1.)
  • Centers: Student-led activity stations that reinforce the math learned during lesson activities through interactive and often game-like formats. In kindergarten and grade 1, time for Centers is built into the last 15 minutes of every lesson.

To support, strengthen, and stretch students’ learning after the lesson, Amplify Desmos Math offers options for:

  • Differentiation: Mini-Lessons, Centers, Extensions, Boost Personalized Learning, and Fluency Practice.
  • Practice: Additional problems your student’s teacher may assign for classwork or homework.

Support math learning at home.

You can support your student’s math learning outside of school in many ways:

Your student’s teacher may assign practice problems at the end of each lesson for classwork or homework. If your student has already completed the practice problems for the lesson, ask them to walk you through how they solved each problem, or talk about any parts that were challenging for them. Ask your student follow-up questions to encourage the use of math language as they explain their thinking, such as, “How do you know?,” “How can you show your thinking?,” or “How would you describe that?” If students are stuck, ask support questions, such as, “What information do you know here?” or “How could you represent this problem?”

Your student’s teacher may introduce a Center game with students in the lesson or beyond the lesson. These games are aligned to the math of the unit and can be played with students outside of class. Your student’s teacher may introduce a Center game to students during or after completing a lesson, or you may need to teach the game before you play by using easy-to-follow instructions. Sign up for a free account to explore Centers and additional K–5 content in our Featured Collections.

Each unit in Amplify Desmos Math begins with a read-aloud story to engage students and provide context for the math of the unit. Elements and characters from the Unit Story then appear in lessons throughout the unit.

Kindergarten

Grade 1

Grade 2

Grade 3

Grade 4

Grade 5

Relate math to daily activities at home, whether grocery shopping, preparing a meal, or planning for a trip to the store. Your student can help you figure out how many more apples there are than oranges in the grocery cart, show how to split a sandwich into fourths, or figure out how much change you’ll receive in exchange for a $10 bill. Encourage your student to point out ways that you use math in your daily tasks.

Remind your student that getting stuck is part of the process and a necessary—beneficial, even!—part of learning. Many students (and adults) fear making mistakes. But research shows that making mistakes helps our brains grow. When your student gets stuck on a problem, encourage them to keep trying different strategies, even if they’re not sure if they are right.

Get more information.

Have a question about Amplify Desmos Math? Visit our help library to search for articles with answers to your program questions. For additional support, please contact your student’s teacher.

Grade K

Unit 1: Position, Length, Height, and Sorting

Lesson 2: Describe and Compare Length and Height, Session 3Connecting Cubes

Unit 2: Numbers to 5, Shapes and Weight

Lesson 4: Count, Show and Write Numbers to 5, Session 2Skye’s Style
Lesson 5: Compare Numbers to 5, Session 4Matching Groups
Lesson 5: Compare Numbers to 5, Session 5Designing Shoes With Skye
Lesson 6: Three-Dimensional Shapes and Weight, Session 1What’s That Shape?
Lesson 6: Three-Dimensional Shapes and Weight, Session 2Building Solid Shapes
Lesson 6: Three-Dimensional Shapes and Weight, Session 5Putting Solid Shapes Together

Unit 3: Addition and Subtractions with 5 and Shapes,

Lesson 8: Two-Dimensional Shapes,
Session 1
So Much Sorting
Lesson 8: Two-Dimensional Shapes,
Session 2
What’s That Shape Called?
Another Shape

Unit 4: Numbers to 10 and Shapes

Lesson 11: Count, Show, and Write Numbers to 10, Session 1Investigate: Cafeteria Math
Fingers as Math Tools
Lesson 12: Compare Numbers to 10, Session 1Moving and Grooving
Fingers and Counters
Lesson 12: Compare Numbers to 10, Session 2More, Fewer, or the Same
Comparing Words
Lesson 12: Compare Numbers to 10, Session 5Forest Friends
Lesson 14: Compose and Decompose 10, Session 2Harry’s Hamster Wheel
Lesson 14: Compose and Decompose 10, Session 3Harry Explores Space
Lesson 14: Compose and Decompose 10, Session 4Showing What We Know About 10
Lesson 14: Compose and Decompose 10, Session 5Harry Explores the Ocean

Unit 6: Addition and Subtraction Within 10

Lesson 20: Add Within 10, Session 1Investigate: Casey’s Town
What Does It Mean to Add?
Lesson 20: Add Within 10, Session 2How Many Objects?
Lesson 20: Add Within 10, Session 3How Many Objects in Pictures?
How Will You Count?
Lesson 21: Subtract Within 10, Session 1What Does It Mean to Subtract?
Lesson 22: Add and Subtract to Solve Wold Problems, Session 1The Bus Depot

Unit 7: Teen Numbers and Shapes

Lesson 23: Compose and Decompose Teen Numbers with Tools and Drawings, Session 2Investigate: Packing Snacks
Getting Ready for the Game
Pass, Shoot, Score
Lesson 23: Compose and Decompose Teen Numbers with Tools and Drawings, Session 3How Many on the Field?
Lesson 25: Compose and Decompose Teen Numbers with Symbols, Session 2Jersey Jam!
People at the Park

Grade 1

Unit 1: Relating Addition and Subtraction

Lesson 2: Add and Subtract Within 10, Session 1What’s the Difference?
Leaping Lily Pads!
Investigate: Let’s Grow!
Lesson 2: Add and Subtract Within 10, Session 3Packing a Picnic
Lesson 5: Solve Word Problems to 10, Session 2Tutu’s Garden in Maui
Lesson 5: Solve Word Problems to 10, Session 2Replanting Huli
Lesson 5: Solve Word Problems to 10, Session 3The Kalo Plants
Lesson 5: Solve Word Problems to 10, Session 4A Community Working Together
Lesson 5: Solve Word Problems to 10, Session 5Helping Others

Unit 2: Addition and Subtraction Within 20

Lesson 6: Teen Numbers, Session 2Same Number, Different Ways
Lesson 7: Add Three Numbers, Session 2Making 10
Kitten Coaster

Unit 4: Using Tens and Ones to Organize and Count

Lesson 15: Tens and Ones, Session 1Investigate: Game Points
Lesson 15: Tens and Ones, Session 3Meeting Yara
It’s a Match
Lesson 16: Numbers to 120, Session 1How Many Cubes?
Boris’s Thimbles
Lesson 21: Add Two-Digit Numbers, Session 1How Many Tens?
Investigate: Squashes at the Playground
Lesson 21: Add Two-Digit Numbers,
Session 2
Town Helpers
Lesson 21: Add Two-Digit Numbers,
Session 3
Making Squash Butter

Unit 5: Operations with Tens and Ones

Lesson 19: Addition with Two-Digit Numbers, Session 2From Park to Table

Unit 6: Geometry and Measurement

Lesson 22: Shapes, Session 1Shapes Ying Saw
Lesson 23: Break Shapes Into Equal Parts, Session 2Fair and Square
One of the Parts, All of the Parts
Lesson 23: Break Shapes Into Equal Parts, Session 5A Bigger Part

Grade 1 (ADM G2)

Unit 1: Relating Addition and Subtraction

Lesson 1: Partner Pairs for 10, Session 3Ways to Make 10
Lesson 2: Add and Subtract Within 10, Session 3Exploring Within 10

Grade 2

Unit 1: Numbers Within 20

Lesson 2: Using Mental Math Strategies to Subtract, Session 1Awesome Aquariums

Unit 2: Numbers Within 100

Lesson 10: Solve Word Problems Involving Money, Session 1Investigate
Lesson 10: Solve Word Problems Involving Money, Session 2Discovering Coins (Part 1)
The Toy Stand
Lesson 10: Solve Word Problems Involving Money, Session 3How Much Money?
Discovering Coins (Part 2)
Lesson 10: Solve Word Problems Involving Money, Session 4The Craft Stand at the Block Party

Unit 3: Numbers Within 1000

Lesson 12: Three-Digit Numbers, Session 1Investigate: A Mistake in Mom’s Office
What Makes a Hundred?
Lesson 12: Three-Digit Numbers, Session 2Looking for Patterns
Lesson 13: Read and Write Three-Digit Numbers, Session 1What’s the Value?
Lesson 13: Read and Write Three-Digit Numbers, Session 2Mail Call!
Lesson 13: Read and Write Three-Digit Numbers, Session 3A New Representation
What’s Your Name?
All the Ways!
Lesson 15: Mental Addition and Subtraction, Session 2Turtle Hurdle
Lesson 16: Add Three-Digit Numbers, Session 2There’s Something About Berries
Lesson 18: Using Addition and Subtraction Strategies with Three-Digit Numbers, Session 2Baking With Skunk

Unit 4: Length

Lesson 25: Solving Problems About Length, Session 2Lengths of Jungle Animals
Lesson 27: Sorting and Organizing Data, Session 1Messy Measurements
Lesson 27: Sorting and Organizing Data, Session 3Bracelets and Wristbands
Lesson 26: Add and Subtract on the Number Line, Session 1Investigate
Time to Line Up!
In Full Bloom
Lesson 26: Add and Subtract on the Number Line, Session 2What’s That Number?
Lesson 26: Add and Subtract on the Number Line, Session 3Greater Than, Less Than, or Equal to

Unit 5: Shapes and Arrays

Lesson 28: Recognize and Draw Shapes, Session 2Frame It!
Lesson 28: Recognize and Draw Shapes, Session 3Measure It, Draw It
Lesson 32: Even and Odd Numbers,
Session 1
Can You Share?
Lesson 32: Even and Odd Numbers,
Session 2
Everybody, Find A Partner!
Lesson 32: Even and Odd Numbers,
Session 3
Is It Even or Odd?

Grade 2 (ADM G3)

Unit 2: Numbers Within 100

Lesson 6: Adding Two-Digit Numbers, Session 1Panda Patterns
Lesson 12: Understand Three-Digit Numbers, Session 2Investigate: Creating a Photo Gallery
Lesson 16: Add Three-Digit Numbers, Session 2How Would You Solve It?
Adding Your Way
What Is an Algorithm?
Lesson 16: Add Three-Digit Numbers, Session 3Using Fewer Digits
Determining Sums of 2 or More Addends
Lesson 16: Add Three-Digit Numbers, Session 3Adding Strategically

Unit 4: Length

Lesson 27: Read and Make Line Plots, Session 2The Plot Chickens
Let’s Make a Line Plot

Grade 3

Unit 2: Multiplication and Division

Lesson 4: Understand the Meaning of Multiplication, Session 1Equal Groups
Lesson 6: Multiply with 3, 4, and 6, Session 2Rectangles and Arrays
Lesson 8: Use Order and Grouping to Multiply, Session 2Arrays of Flavor
Lesson 11: Understand How Multiplication and Division Are Connected, Session 1It’s Chili in Here!
Lesson 12: Multiplication and Division Facts, Session 3Relating Quotients to Familiar Products

Unit 3: Multiplication

Lesson 19: Scaled Graphs, Session 1Puppy Pile
Lesson 19: Scaled Graphs, Session 42, 5, or 10?
Lesson 14: Understand Area, Session 1Tiling Figures
Lesson 14: Understand Area, Session 2Which Covers More Space?
Lesson 15: Multiply to Find Area, Session 3Area Hunt
Lesson 17: Solve One-Step Word Problems Using Multiplication and Division, Session 2Division and Multiplication Equations

Unit 4: Fractions

Lesson 21: Understand Fractions on a Number Line, Session 1Cat Crossing
Lesson 21: Understand Fractions on a Number Line, Session 2Fractions on the Number Line
Lesson 21: Understand Fractions on a Number Line, Session 3Location, Location, Location

Unit 6: Shapes

Performance TaskInvestigate: Comparing Rugs
Lesson 30: Understand Categories of Shapes, Session 1Piho’s Shapes
Lesson 31: Classify Quadrilaterals, Session 1Rectangles, Squares, and Rhombuses
Lesson 31: Classify Quadrilaterals, Session 3More Quadrilaterals

Grade 4

Unit 2: Operations

Lesson 6: Understand Multiplication as a Comparison, Session 1Sticker Mania
Lesson 6: Understand Multiplication as a Comparison, Session 2Representing “Times as Many”
Going Swimming
Lesson 8: Multiples and Factors, Session 1Hamster Homes
Lesson 8: Multiples and Factors, Session 3Factor or Multiple?
Lesson 8: Multiples and Factors, Session 4A Number Game
Lesson 9: Number and Shape Patterns, Session 1How Does It Grow?

Unit 3: Multi-Digit Operations and Measurement

Lesson 11: Multiply by One-Digit Numbers, Session 1Investigate: Packing Lei
Counting Flowers for Lei
Lesson 11: Multiply by One-Digit Numbers, Session 3A Lei Making Workshop
A Reasonable Answer
Three of a Kind
Lesson 12: Multiply by Two-Digit Numbers, Session 2Growing Flowers for the Lei
Double Decomposition
Lesson 12: Multiply by Two-Digit Numbers, Session 3Revisiting Strategies
How Many Supplies?

Unit 4: Fractions, Decimals, and Measurement

Lesson 17: Understand Equivalent Fractions, Session 1Investigate: Building Your Own Number Line
Fraction Strips
Lesson 18: Understand Equivalent Fractions, Session 3Chop It
All Kinds of Fractions
Lesson 19: Fraction Addition and Subtraction, Session 1Pizza Problems
Lesson 20: Add and Subtract Fractions, Session 4Math Pizzeria
Lesson 24: Multiply Fractions by Whole Numbers, Session 2Equal Groups of Fractions
Lesson 25: Fractions as Tenths and Hundredths, Session 3Investigate: Different Units
Lesson 26: Relate Decimals and Fractions, Session 2A New Way to Write Tenths
A New Way to Write Hundredths
Lesson 26: Relate Decimals and Fractions, Session 4Are They Equivalent?
Lesson 27: Compare Decimals, Session 2How Can You Compare?
Lesson 27: Compare Decimals, Session 3Robot Factory
Lesson 27: Compare Decimals, Session 4What’s the Order

Unit 5: Geometry and Measurement

Lesson 30: Points, Lines, Rays, and Angles, Session 3Angle Adventures
Lesson 31: Angles, Session 1The Spin on Angles
Lesson 32: Add and Subtract with Angles, Session 3Angles in Motion

Grade 5

Unit 1: Whole Number Operations and Applications

Lesson 2: Find Volume Using Unit Cubes, Session 1Which is Largest
Lesson 2: Find Volume Using Unit Cubes, Session 2Packing the Barge
Lesson 3: Find Volume Using Formulas, Session 3Putting it Together
Figures Made of Prisms
Lesson 4: Multiply Multi-Digit Numbers, Session 1Partial Products Everywhere
Lesson 4: Multiply Multi-Digit Numbers, Session 4How Do They Compare?
Lesson 5: Divide Multi-Digit Numbers, Session 4Emptying the Water Tank

Unit 2: Decimals and Fractions

Lesson 6: Understand Decimal Place Value, Session 1Investigate: Numbers Between Numbers
Lesson 6: Understand Decimal Place Value, Session 2What Is One Thousandth?
Lesson 8: Read and Write Decimals,
Session 1
Say What?
Place Value Patterns
Lesson 9: Compare and Round Decimals, Session 2Selling Collectibles
Lesson 9: Compare and Round Decimals, Session 3The Claw
Which Way Down the Mountain?
Lesson 9: Compare and Round Decimals, Session 4Rounding Races
Lesson 7: Understand Powers of 10, Session 1Monarch Butterflies
All About That Base
Powers of 10 Parade

Unit 3: More Decimals & Fractions

Lesson 18: Fractions as Division, Session 1Investigate: Sharing Sandwiches
Division Story Problems
Making Generalizations
Investigate: Folding Paper
Lesson 18: Fractions as Division, Session 2Sharing More Sandwiches
Dance Breaks
Lesson 19: Multiplication by a Fraction, Session 2Parts of Parts
Lesson 20: Multiply Fractions to Find Area, Session 2One Part of One Part
Lesson 20: Multiply Fractions to Find Area, Session 3Making Food
Lesson 22: Multiply Fractions in Word Problems, Session 3Installing Turf
Rows and Columns
Lesson 22: Multiply Fractions in Word Problems, Session 4Messy Multiplication
Applying Fraction Multiplication
Lesson 21: Exploring Multiplication as Scaling, Session 1Chores at Animal Haven
The Re-size-inator

Unit 5: Algebraic Thinking and the Coordinate Plane

Lesson 31: Understand the Coordinate Plane, Session 1Bullseye!
Lesson 31: Understand the Coordinate Plane, Session 2Creating a Coordinate System
Coordinating Satellite Repairs

Grade 6

Unit 1: Expressions and Equations: Area, Algebraic Expressions, and Exponents

iReady ClassroomAmplify Classroom
Lesson 1: Find the Area of a ParallelogramUnit 1
Lesson 3: Exploring Parallelograms
Exploring Parallelograms, Part 2

Unit 2: Decimals and Fractions: Base-Ten Operations, Division with Fractions, and Volume

Lesson 7: Add, Subtract, and Multiply Multi-Digit DecimalsUnit 4
Lesson 1: Dishing Out Decimals
Lesson 8: Divide Whole Numbers and Multi-Digit DecimalsUnit 5
Lesson 13: Movie Time
Lesson 9: Understand Division with FractionsUnit 4
Lesson 3: Flour Planner
Lesson 10: Divide FractionsUnit 4
Lesson 6: Fill the Gap

Unit 3: Ratio Reasoning: Ratio Concepts and Equivalent Ratios

Lesson 12: Understand Ratio ConceptsUnit 2
Lesson 1: Pizza Maker
Lesson 13: Find Equivalent RatiosUnit 2
Lesson 4: Fruit Lab
Lesson 10: Disaster Preparation

Unit 4: Ratio Reasoning: Unit Rates and Percent

Lesson 15: Understand Rate ConceptsUnit 3
Lesson 1: Many Measurements
Lesson 16: Use Unit Rates to Solve ProblemsUnit 3
Lesson 6: Soft Serve
Lesson 17: Understand PercentsUnit 3
Lesson 9: Lucky Duckies

Unit 5: Algebraic Thinking: Equivalent Expressions and Equations with Variables

Lesson 19: Write and Identify Equivalent ExpressionsUnit 6
Lesson 8: Products and Sums
Take Away (coming soon!)
Lesson 22: Analyze Two-Variable RelationshipsUnit 6
Lesson 16: Subway Fares
Take Away (coming soon!)

Unit 6: Positive and Negative Numbers: Absolute Value, Inequalities, and the Coordinate Plane

Lesson 23: Understand Positive and Negative NumbersUnit 7
Lesson 1: Can You Dig It?
Lesson 24: Order Positive and Negative NumbersUnit 7
Lesson 4: Order in the Class
Lesson 26: Write and Graph One-Variable InequalitiesUnit 7
Lesson 7: Tunnel Travels

Unit 7: Statistical Thinking: Data Distributions and Measures of Center and Variability

Lesson 30: Use Dot Plots and Histograms to Describe Data DistributionsUnit 8
Lesson 3: Minimum Wage
Lesson 5: The Plot Thickens
Lesson 31: Interpret Median and Interquartile Range in Box PlotsUnit 8
Lesson 11: Toy Cars

Grade 7

Unit 1: Proportional Relationships: Ratios, Rates, and Circles

iReady ClassroomAmplify Classroom
Lesson 2: Find Unit Rates Involving Ratios and FractionsUnit 2
Lesson 1: Paint
Lesson 4: Represent Proportional RelationshipsUnit 2
Lesson 6: Two and Two
Lesson 5: Solve Proportional Relationship Problems
Lesson 6: Solve Area and Circumference Problems Involving CirclesUnit 3
Lesson 3: Measuring Around
Lesson 9: Area Challenges

Unit 2: Numbers and Operations: Add and Subtract Rational Numbers

Lesson 7: Understand Addition with Negative NumbersUnit 5
Lesson 1: Floats and Anchors
Lesson 8: Add with Negative NumbersUnit 5
Lesson 1: Floats and Anchors
Lesson 9: Understand Subtraction with Negative IntegersUnit 5
Lesson 1: Floats and Anchors
Lesson 10: Add and Subtract Positive and Negative NumbersUnit 5
Lesson 1: Floats and Anchors

Unit 3: Numbers and Operations: Multiply and Divide Rational Numbers

Lesson 14: Use the Four Operations with Negative NumbersUnit 5
Lesson 10: Integer Puzzles

Unit 4: Algebraic Thinking: Expressions, Equations, and Inequalities

Lesson 19: Write and Solve InequalitiesUnit 6
Lesson 16: Shira the Sheep

Unit 5: Proportional Reasoning: Percents and Statistical Samples

Lesson 20: Solve Problems Involving Percents Unit 4
Lesson 5: Percent Machines
Lesson 12: Posing Percent Problems (coming soon!)
Lesson 22: Understand Random SamplingUnit 8
Lesson 2: Prob-bear-bilities
Lesson 24: Compare PopulationsUnit 8
Lesson 10: Crab Island

Unit 6: Geometry: Solids, Triangles, and Angles

Lesson 28: Find Unknown Angle MeasuresUnit 7
Lesson 2: Friendly Angles
Lesson 4: Missing Measures

Unit 7: Probability: Theoretical Probability, Experimental Probability, and Compound Events

Lesson 30: Understand ProbabilityUnit 8
Lesson 1: How Likely?
Lesson 2: Prob-bear-bilities

Grade 8

Unit 1: Geometric Figures: Rigid Transformations and Congruence

iReady ClassroomAmplify Classroom
Lesson 1: Understand Rigid Transformations and Their PropertiesUnit 1
Lesson 1: Transformers
Lesson 2: Spinning, Flipping, Sliding
Lesson 2: Work with Single Rigid Transformations in the Coordinate PlaneUnit 1
Lesson 4: Moving Day

Unit 2: Geometric Figures: Transformations, Similarity, and Angle Relationships

Lesson 4: Understand Dilations and SimilarityUnit 2
Lesson 2: Dilation Mini Golf
Lesson 6: Describe Angle RelationshipsUnit 2
Lesson 6: Social Scavenger Hunt
Lesson 7: Describe Angle Relationships in TrianglesUnit 1
Lesson 12: Puzzling It Out

Unit 3: Linear Relationships: Slope, Linear Equations, and Systems

Lesson 8: Graph Proportional Relationships and Define SlopeUnit 3
Lesson 1: Turtle Time Trials
Lesson 13: Solve Systems of Linear Equations AlgebraicallyUnit 4
Lesson 11: Make Them Balance
Lesson 12: Line Zapper

Unit 4: Functions: Linear and Nonlinear Relationships

Lesson 15: Understand FunctionsUnit 5
Lesson 1: Turtle Crossing
Lesson 2: Guess My Rule
Lesson 16: Use Functions to Model Linear RelationshipsUnit 5
Lesson 5: The Tortoise and the Hare

Unit 5: Integer Exponents: Properties and Scientific Notation

Lesson 19: Apply Exponent Properties for Positive Integer ExponentsUnit 7
Lesson 1: Circles
Lesson 3: Power Pairs
Lesson 22: Work with Scientific NotationUnit 7
Lesson 9: Specific and Scientific
Lesson 11: Balance the Scale

Unit 6: Real Numbers: Rational Numbers, Irrational Numbers, and the Pythagorean Theorem

Lesson 23: Find Square Roots and Cube Roots to Solve ProblemsUnit 8
Lesson 4: Root Down
Lesson 25: Find Rational Approximations of Irrational NumbersUnit 8
Lesson 10: Taco Truck
Lesson 27: Apply the Pythagorean TheoremUnit 8
Lesson 8: Triangle-Tracing Turtle
Lesson 28: Solve Problems with Volumes of Cylinders, Cones, and SpheresUnit 8
Lesson 11: Cylinders
Lesson 13: Cones

Unit 7: Statistics: Two-Variable Data and Fitting a Linear Model

Lesson 29: Analyze Scatter Plots and Fit a Linear Model to DataUnit 6
Lesson 3: Robots
Lesson 4: Dapper Cats
Lesson 6: Find the Fit

Disclaimer

This document is for informational purposes only; references to third-party programs do not imply endorsement or affiliation, and all trademarks are the property of their respective owners.

Eureka Math²

Level K

Module 1: Counting and Cardinality

Topic A: Classify to Make Categories and Count

Lesson 1: Compare objects based on their attributes.Connecting Cubes
Lesson 3: Classify objects into two categories and count.Skye’s Style

Topic B: Answer How Many Questions with Up to 5 Objects

Lesson 3: Sort by Same ColorMatching Groups

Topic C: Write Numerals and Create Sets of Up to 5 Objects

Lesson 10: Count out a group of objects to match a numeral.Designing Shoes with Skye

Topic E: Answer How Many Questions with Up to 10 Objects

Lesson 19: Organize, count, and represent a collection of objects.Investigate: Cafeteria Math
Lesson 20: Count objects in 5-group and array configurations and match to a numeral.Fingers as Math Tools
Lesson 23: Conserve number regardless of the order in which objects are counted.Moving and Grooving

Module 2: Two- and Three- Dimensional Shapes

Topic A: Analyze and Name Two-Dimensional Shapes

Lesson 1: Find and describe attributes of flat shapes.So Much Sorting
Lesson 2: Classify shapes as triangles or nontriangles.What’s That Shape Called?
Lesson 3: Classify shapes as circles, hexagons, or neither.What’s That Shape Called?
Lesson 4: Classify shapes as rectangles or nonrectangles, with square rectangles as a special case.Another Shape

Module 3: Comparison

Topic C: Compare Sets Within 10

Lesson 12: Relate more and fewer to length.More, Fewer, or the Same
Forest Friends
Lesson 13: Compare sets by using more than, fewer than, and the same number as.Fingers and Counters
Comparing Words

Module 4: Composition and Decomposition

Topic A: Explore Composition and Decomposition

Lesson 1: Compose flat shapes and count the parts.Investigate: Casey’s Town
Lesson 2: Decompose flat shapes and count the parts.How Many Objects?
Lesson 3: Decompose a group to identify parts and total.How Many Objects in Pictures?

Topic B: Record Composition and Decomposition

Lesson 5: Sort to decompose a number in more than one way.How Will You Count?
Lesson 6: Decompose a number in more than one way and record.Harry Explores the Ocean

Module 5: Addition and Subtraction

Topic A: Represent Addition

Lesson 1: Represent add to with result unknown story problems by using drawings and numbers.What Does It Mean to Add?

Topic B: Represent Subtraction

Lesson 8: Understand taking away as a type of subtraction.What Does It Mean to Subtract?

Topic C: Make Sense of Problems

Lesson 15: Identify the action in a problem to represent and solve it.The Bus Depot

Level 1

Module 1: Counting, Comparison, and Addition

Topic A: Count and Compare with Data

Lesson 2: Organize and represent data to compare two categories.Shapes Ying Saw

Module 2: Addition and Subtraction Relationships

Topic A: Reason About Take From Situations

Lesson 1: Represent result unknown problems and record as addition or subtraction number sentences.Packing for a Picnic
Lesson 3: Subtract 1 or subtract 1 less than the total.What’s the Difference?
Leaping Lily Pads!

Topic B: Relate and Distinguish Addition and Subtraction

Lesson 5: Use the Read–Draw–Write process to solve result unknown problems.Investigate: Let’s Grow!
Lesson 6: Represent and solve related addition and subtraction result unknown problems.Tutu’s Garden in Maui
Lesson 7: Count on or count back to solve related addition and subtraction problems.The Kalo Plants

Topic C: Find an Unknown Part in Change Unknown Problems

Lesson 8: Interpret and find an unknown change.Replanting Huli
Lesson 11: Represent and solve take from with change unknown problems.Helping Others
A Community Working Together

Module 3: Properties of Operations to Make Easier Problems

Topic B: Make Easier Problems to Add

Lesson 9: Make ten with either addend.Making 10
Kitten Coaster

Topic D: Reason about Ten as a Unit to Add or Subtract

Lesson 16: Identify ten as a unit.Same Number, Different Ways

Module 5: Place Value Concepts to Compare, Add, and Subtract

Topic A: Grouping Units in Tens and Ones

Lesson 2: Count a collection and record the total in units of tens and ones.Investigate: Game Points
Meeting Yara
Lesson 4: Represent a number in multiple ways by trading 10 ones for a ten.It’s a Match
Lesson 6: Add 10 or take 10 from a two-digit number.How Many Cubes?

Topic D: Addition and Subtraction of Tens

Lesson 15: Count on and back by tens to add and subtract.Boris’s Thimbles
Lesson 16: Use related single-digit facts to add and subtract multiples of ten.How Many Tens?

Level 2

Module 1: Place Value Concepts Through Metric Measurement and Data · Place Value, Counting, and Comparing Within 1,000

Topic A: Representing Data to Solve Problems

Lesson 3: Use information presented in a bar graph to solve put together and take apart problems.Exploring Within 10
Ways to Make 10
Lesson 4: Use information presented in a bar graph to solve compare problems.Awesome Aquariums

Topic C: Estimate, Measure, and Compare Lengths

Lesson 12: Model and reason about the difference in length.Lengths of Jungle Animals

Topic D: Solve Compare Problems by Using the Ruler as a Number Line

Lesson 15: Use a measuring tape as a number line to add efficiently.Investigate: Where Am I?
Time to Line Up!
What’s That Number?
Lesson 17: Represent and solve comparison problems by using measurement contexts.Greater Than, Less Than, or Equal to

Module 2: Addition and Subtraction Within 200

Topic A: Simplifying Strategies for Addition

Lesson 1: Reason about addition with four addends.Investigate: Activities at the Block Party

Module 5: Money, Data, and Customary Measurement

Topic A: Problem Solving with Coins and Bills

Lesson 1: Organize, count, and represent a collection of coins.Discovering Coins (Part 1)
Discovering Coins (Part 2)
Lesson 2: Use the fewest number of coins to make a given value.How Much Money?
Lesson 5: Use different strategies to make 1 dollar or to make change from 1 dollar.The Toy Stand
Lesson 3: Solve one- and two-step word problems to find the total value of a group of coins.The Craft Stand at the Block Party

Topic B: Use Customary Units to Measure and Estimate Length

Lesson 12: Identify unknown numbers on a number line by using the interval as a reference point.In Full Bloom

Topic C: Use Measurement and Data to Solve Problems

Lesson 15: Use measurement data to create a line plot.Messy Measurements
“Lesson 16: Create a line plot to represent data and ask and answer questions.
60 min
Bracelets and Wristbands

Level 3

Module 1: Multiplication and Division with Units of 2, 3, 4, 5, and 10

Topic A: Conceptual Understanding of Multiplication

Lesson 2: Interpret equal groups as multiplication.Equal Groups

Topic C: Properties of Multiplication

Lesson 10: Demonstrate the commutative property of multiplication using a unit of 2 and the array model.Arrays of Flavor

Topic D: Two Interpretations of Division

Lesson 15: Model division as an unknown factor problem.It’s Chili in Here

Module 2: Place Value Concepts Through Metric Measurement

Topic A: Understanding Place Value Concepts Through Metric Measurement

Lesson 1: Connect the composition of 1 kilogram to the composition of 1 thousand.Investigate: Create a Photo Gallery

Topic C: Simplifying Strategies to Find Sums and Differences

Lesson 13: Collect and represent data in a scaled bar graph and solve related problems.Puppy Pile
Lesson 14: Use place value understanding to add and subtract like units.Adding Your Way
Lesson 15: Use the associative property to make the next ten to add.Panda Patterns
Lesson 16: Use compensation to add.How Would You Solve It?

Topic D: Two- and Three-Digit Measurement Addition and Subtraction

Lesson 20: Add measurements using the standard algorithm to compose larger units once.What is an Algorithm?
Using Fewer Digits
Lesson 21: Add measurements using the standard algorithm to compose larger units twice.Determining Sums of 2 or More Addends
Adding Strategically

Module 3: Multiplication and Division with Units of 0, 1, 6, 7, 8, and 9

Topic B: Multiplication and Division Concepts with an Emphasis on the Unit of 7

Lesson 11: Use the break apart and distribute strategy to divide with units of 7.Relating Quotients to Familiar Products
Lesson 12: Solve one-step word problems involving multiplication and division.Division and Multiplication Equations

Module 4: Multiplication and Area

Topic A: Foundations for Understanding Area

Lesson 2: Recognize area as an attribute of polygons.Investigate: Comparing Rugs
Which Covers More Space?
Lesson 3: Tile polygons to find their areas.Tiling Figures
Area Hunt

Topic B: Concepts of Area Measurement

Lesson 6: Tile rectangles with squares to make arrays and relate the side lengths to area.Rectangles and Arrays
Lesson 7: Draw rows and columns to complete a rectangular array and determine its area.Area Hunt

Module 6: Geometry, Measurement, and Data

Topic D: Collecting and Displaying Dat

Lesson 23: Solve problems by creating scaled picture graphs and scaled bar graphs.2, 5, or 10?

Level 4

Module 1: Place Value Concepts for Addition and Subtraction

Topic A: Multiplication as Multiplicative Comparison

Lesson 1: Interpret multiplication as multiplicative comparison.How Does It Grow?

Module 2: Place Value Concepts for Multiplication and Division

Topic E: Factors and Multiples

Lesson 24: Recognize that a number is a multiple of each of its factors.Hamster Homes
Factor or Multiple?
Lesson 25: Explore properties of prime and composite numbers up to 100 by using multiples.A Number Game

Module 4: Foundations for Fraction Operations

Lesson 1: Decompose whole numbers into a sum of unit fractions.

Lesson 1: Decompose whole numbers into a sum of unit fractions.Investigate: Building Your Own Number Line
Lesson 3: Decompose fractions into a sum of fractions.Math Pizzeria
Lesson 4: Represent fractions by using various fraction models.Fraction Strips
Chop It
Lesson 5: Rename fractions greater than 1 as mixed numbers.All Kinds of Fractions

Topic D: Add and Subtract Fractions

Lesson 21: Solve addition and subtraction word problems and estimate the reasonableness of the answers.Pizza Problems

Topic F: Repeated Addition of Fractions as Multiplication

Lesson 32: Multiply a fraction by a whole number by using the associative property.Equal Groups of Fractions

Module 5: Place Value Concepts for Decimal Fractions

Topic A: Exploration of Tenths

Lesson 1: Organize, count, and represent a collection of money.Investigate: Different Units
Lesson 3: Represent tenths as a place value unit.A New Way to Write Tenths
Lesson 4: Write mixed numbers in decimal form with tenths.A New Way to Write Tenths

Topic B: Tenths and Hundredths

Lesson 5: Decompose 1 one and express hundredths in fraction form and decimal form.Are They Equivalent?
Lesson 6: Represent hundredths as a place value unit.A New Way to Write Hundredths
Lesson 7: Write mixed numbers in decimal form with hundredths.A New Way to Write Hundredths

Topic C: Comparison of Decimal Numbers

Lesson 10: Use pictorial representations to compare decimal numbers.How Can You Compare?
Lesson 11: Compare and order decimal numbers.Robot Factory
What’s the Order?

Level 5

Module 1: Place Value Concepts for Multiplication and Division with Whole Numbers

Topic B: Multiplication of Whole Numbers

Lesson 8: Multiply two- and three-digit numbers by two-digit numbers by using the distributive property.Partial Products Everywhere
Lesson 9: Multiply two- and three-digit numbers by two-digit numbers by using the standard algorithm.How Do They Compare?

Topic C: Division of Whole Numbers

Lesson 15: Divide three-digit numbers by two-digit numbers in problems that result in two-digit quotients.Emptying the Water Tank

Module 2: Addition and Subtraction with Fractions

Topic A: Fractions and Division

Lesson 1: Interpret a fraction as division.Investigate: Sharing Sandwiches
Sharing More Sandwiches
Dance Breaks
Lesson 3: Represent fractions as division by using models.Making Generalizations
Lesson 4: Solve word problems involving division and fractions.Division Story Problems

Module 3: Multiplication and Division with Fractions

Topic B: Multiplication of Fractions

Lesson 7: Multiply fractions less than 1 by unit fractions pictorially.Investigate: Folding Paper
Lesson 8: Multiply fractions less than 1 pictorially.Parts of Parts
One Part of One Part
Rows and Columns
Lesson 9: Multiply fractions by unit fractions by making simpler problems.Messy Multiplication
Lesson 10: Multiply fractions greater than 1 by fractions.Making Food
Installing Turf
Lesson 11: Multiply fractions.Applying Fraction Multiplication
Chores at Animal Haven
The Re-size-inator

Module 5: Addition and Multiplication with Area and Volume

Topic C: Volume Concepts

Lesson 17: Find the volume of right rectangular prisms by packing with unit cubes and counting.Which is Largest
Lesson 18: Find the volume of right rectangular prisms by packing with improvised units.Packing the Barge

Topic D: Volume and the Operations of Multiplication and Addition

Lesson 25: Find the volumes of solid figures composed of right rectangular prisms.Putting It Together
Figures Made of Prisms

Level 6

Module 1: Ratios, Rates, and Percents

Topic A: Ratios

Lesson 2: Introduction to RatiosPizza Maker

Topic B: Collections of Equivalent Ratios

Lesson 6: Ratios Tables and Double Number LinesFruit Lab
Lesson 9: Multiplication Patterns in Ratio RelationshipsDisaster Preparation

Topic D: Rates

Lesson 16: SpeedWorld Records
Lesson 17: RatesMany Measurements
Soft Serve
Lesson 18: Comparing RatesWelcome to the Robot Factory
Lesson 19: Unit Rates to Convert UnitsModel Trains
More Soft Serve
Lesson 20: Solving Rate ProblemsLucky Duckies

Module 2: Operations with Fractions and Multi-Digit Numbers

Topic B: Dividing Fractions

Lesson 6: Dividing a Whole Number by a FractionFlour Planner
Lesson 8: Dividing Fractions by Making Common DenominatorsFill the Gap

Topic C: Dividing Fractions Fluently

Lesson 9: Dividing Fractions by Using Tape DiagramsPuzzling Areas

Topic D: Decimal Addition, Subtraction, and Multiplication

Lesson 13: Decimal Addition and SubtractionDishing Out Decimals
Lesson 16: Applications of Decimal OperationsDecimal Diagrams and Algorithms

Topic F: Decimal Division

Lesson 21: Dividing a Decimals by a Whole NumberMovie Time
Lesson 22: Dividing a Decimal by a Decimal Greater than 1Movie Time
Lesson 23: Dividing a Decimal by a Decimal Less than 1Movie Time

Module 3: Rational Numbers

Topic A: Integers and Rational Numbers

Lesson 1: Positive and Negative NumbersCan You Dig It?
Lesson 3: Rational NumbersOrder in the Class

Module 4: Expressions and One-Step Equations

Topic B: Expressions and Real-World Problems

Lesson 9: Addition and Subtraction Expressions from the Real-WorldSubway Fares

Topic C: Equivalent Expressions Using the Properties of Operations

Lesson 13: The Distributive PropertyProducts and Sums

Topic D: Equations and Inequalities

Lesson 17: Equations and SolutionsFive Equations
Lesson 18: Inequalities and SolutionsHanging It Up
Tunnel Travels
Lesson 19: Solving Equations with Addition and SubtractionWeight for It
Lesson 20: Solving Equations with Multiplication and DivisionHanging Around
Lesson 21: Solving Problems with EquationsSwap and Solve

Module 5: Area, Surface Area, and Volume

Topic A: Areas of Polygons

Lesson 1: The Area of a ParallelogramExploring Parallelograms, Part 1
Lesson 2: The Area of a Right TriangleOff the Grid, Part 2
Lesson 3: The Area of a TriangleExploring Parallelograms, Part 2
Off the Grid, Part 1
Lesson 4: Areas of Triangles in Real-World SituationsExploring Triangles

Topic B: Problem Solving with Area

Lesson 5: Perimeter and Area in the Coordinate PlaneShapes on a Plane
Lesson 6: Problem Solving with Area in the Coordinate PlaneLetters
Lesson 7: Areas of Trapezoids and Other PolygonsTriangles and Parallelograms
Lesson 8: Areas of Composite Rigures in Real-World SituationsPile of Polygons

Topic C: Nets and Surface Area

Lesson 12: From Nets to Surface AreaRenata’s Stickers

Module 6: Statistics

Topic A: Understanding Distributions

Lesson 2: Describing a Data DistributionHoops
Lesson 3: Creating a Dot PlotMinimum Wage
Lesson 4: Creating a HistogramThe Plot Thickens

Topic B: Mean and Mean Absolute Deviation

Lesson 7: Using the Mean to Describe CenterToy Cars

Level 7

Module 1: Ratios and Proportional Relationships

Topic A: Understanding Proportional Relationships

Lesson 1: An Experiment with Ratios and RatesPaint
Lesson 2: Exploring Tables and Proportional RelationshipsTwo and Two
Lesson 4: Exploring Graphs of Proportional RelationshipsDinoPops

Topic C: Scale Drawing and Proportional Relationships

Lesson 14: Extreme BicyclesScaling Machines
Lesson 15: Scale DrawingScaling Robots
Lesson 16: Using Scale FactorScale Factor Challenges
Lesson 17: Finding Actual Distances from ScaleMake it Scale
Lesson 18: Relating Areas of Scale DrawingTiles
Will It Fit

Module 2: Operations with Rational Numbers

Topic A: Adding Rational Numbers

Lesson 2: Adding IntegersFloats and Anchors

Topic B: Subtracting Rational Numbers

Lesson 8: Subtracting Integers, Part 1More Floats and Anchors
Lesson 10: Subtracting Rational Numbers, Part 1Draw Your Own

Topic E: Numberical Expressions with Rational Numbers

Lesson 25: Writing and Evaluating Expressions with Rational NumbersInteger Puzzles

Module 3: Expressions, Equations, and Inequalities

Topic A: Equivalent Expressions

Lesson 1: Equivalent ExpressionsCollect the Squares

Topic B: Unknown Angle Measurements

Lesson 7: Angle Relationships and Unknown Angle MeasuresFriendly Angles

Topic C: Solving Equations

Lesson 11: Dominoes and DominoesKeeping it True

Topic D: Inequalities

Lesson 18: Understanding Inequalities and Their SolutionsI Saw the Signs
Lesson 19: Using Equations to Solve InequalitiesUnbalanced Hangers
Lesson 20: Preserving and ReversingShira the Sheep
Lesson 21: Solving Two-Step InequalitiesBudgeting
Lesson 22: Solving Problems Involving InequalitiesWrite Them and Solve Them

Module 4: Geometry

Topic A: Constructing Geometric Figures

Lesson 3: Side Lengths of a TriangleCan You Build It
Lesson 4: Angles of a TriangleFriendly Angles

Topic C: Circumference and Areas of Circles

Lesson 10: The Outside of a CicleMeasuring Around
Lesson 11: The Inside of a CircleWhy Pi?
Lesson 14: Composite Figures with Circular RegionsArea Challenges

Module 5: Percent and Applications of Percent

Topic A: Proportion and Percent

Lesson 3: Percent as a Rate per 100Mosaics
Lesson 4: Proportion and PercentMore and Less

Topic C: More of Less Than 100%

Lesson 10: Percent IncreaseAll the Equations

Topic D: Applications of Percent

Lesson 16: Markups and Discount100%
Lesson 18: Simple Interest – Solving for Unknown ValuesPercent Machines

Topic E: Problems Involving Percent

Lesson 20: Making Money, Day 1Back in My Day

Module 6: Probability and Populations

Topic A: Calculating and Interpreting Probabilities

Lesson 2: Empirical ProbabilityHow Likely
Lesson 4: Theoretical ProbabilityProb-bear-bilities

Topic B: Estimating Probabilities

Lesson 7: The Law of Large NumbersIs It Fair?

Topic C: Random Sampling

Lesson 11: Populations and SamplesCrab Island

Level 8

Module 1: Scientific Notation, Exponents, and Irrational Numbers

Topic A: Introduction to Scientific Notation

Lesson 2: Comparing Large NumbersSpecific and Scientific (formerly Solar System)
Lesson 4: Adding and Subtracting Numbers Written in Scientific NotationBalance the Scale

Topic B: Properties and Definitions of Exponents

Lesson 6: More Properties of ExponentsCircles
Lesson 7: Making Sense of the Exponent 0Power Pairs

Topic D: Perfect Squares, Perfect Cubes, and the Pythagorean Theorem

Lesson 18: The Pythagorean TheoremTriangle Tracing Turtle
Lesson 19: Using the Pythagorean TheoremTaco Truck
Lesson 23: Ordering Irrational NumbersRoot Down

Module 2: Rigid Motions and Congruent Figures

Topic A: Rigid Motion and Their Properties

Lesson 1: Motions in the PlaneTransformers
Moving Day
Lesson 2: TranslationsSpinning, Flipping, Sliding
Moving Day
Lesson 4: Translations and Reflections on the Coordinate PlaneGetting Coordinated, Part 1
Lesson 6: Rotations on the Coordinate PlaneGetting Coordinated, Part 2

Topic B: Rigid Motions and Congruent Figures

Lesson 8: Sequencing the Rigid MotionsTransformation Golf

Topic C: Angle Relationships

Lesson 12: Lines Cut by a TransversalPuzzling It Out

Module 3: Dilations and Similar Figures

Topic A: Dilations

Lesson 1: Exploring DilationsSketchy Dilations
Lesson 3: Reductions and More EnlargmentsDilation Mini Golf

Topic B: Properties of Dilations

Lesson 5: Figures and DilationsSocial Scavenger Hunt

Module 4: Linear Equations in One and Two Variables

Topic A: Linear Equations in One Variable

Lesson 3: Solving Linear Equations with Rational CoefficientsEquation Roundtable

Topic D: Slope of a Line

Lesson 16: Proportional Relationships and SlopeTurtle Time Trials
Lesson 17: Slopes of Rising LinesFlags
Ups and Downs
Lesson 18: Slopes of Falling LinesFlags
Water Cooler
Ups and Downs

Topic E: Different Forms of a Linear Equation

Lesson 20: Slope-Intercept form of the Equation of a LineStacking Cups (Optional)
Lesson 21: Slopes and Parallel LinesTranslations

Module 5: Systems of Linear Equations

Topic A: Solving Systems of Linear Equations Graphically

Lesson 1: Solving Problems with Equations and Their GraphsMake Them Balance

Topic B: Solving Systems of Linear Equations Algebraically

Lesson 6: Solving Systems of Linear Equations without GraphingLine Zapper

Module 6: Functions and Bivariate Statistics

Topic A: Functions

Lesson 1: Motion and SpeedTurtle Crossing
Lesson 2: Definition of a FunctionGuess My Rule

Topic B: Linear and Nonlinear Functions

Lesson 9: Increasing and Decreasing FunctionsThe Tortoise and the Hare

Topic C: Bivariate Numerical Data

Lesson 11: Scatter PlotsRobots
Dapper Cats
Lesson 12: Patterns in Scatter PlotsInterpreting Scatter Plots
Lesson 13: Informally Fitting a Line to DataFind the Fit (called Fit Fights in Desmos Math)
Lesson 14: Determining an Equation of a Line Fit to DataInterpreting Slopes
Lesson 15: Linear ModelAnimal Brains
Lesson 16: Using the Investigative ProcessScatter Plot City
Lesson 17: Analyzing the ModleScatter Plot City

Topic D: Bivariate Categorical Data

Lesson 18: Bivariate Categorical DataFinding Associations

Topic E: Volume

Lesson 22: Volume of a CylinderCylinders
Lesson 23: Volume of ConesCones

Algebra 1

Module 1: Expressions, Equations and Inequalities in One Variable

Lesson 1: The Growing Pattern of DucksMore Visual Patterns
Lesson 8: Solution Sets for Equations and Inequalities in One VariableSame Position
Lesson 9: Solving Linear Equations in One VariableWorking Backwards
Solving Strategies
Lesson 12: Rearranging FormulasSubway Seats
Various Variables
Shelley the Snail
Five Representations
Lesson 13: Solving Linear Inequalities in One VariablePizza Delivery
Lesson 21: Describing Variability in a Univariate Distribution with Standard DeviationFinding Desmo

Module 2: Equations and Inequalities in Two Variables

Lesson 1: Solution Sets of Linear Equations in Two VariablesSubway Seats
Various Variables
Shelley the Snail
Five Representations
Lesson 6: Applications of Linear Equations and InequalitiesSubway Seats
Various Variables
Shelley the Snail
Five Representations
Pizza Delivery
Lesson 8: Systems of Linear Equations in Two VariablesShape It Up
Lizard Lines
Lesson 12: Solution Sets of Systems of Linear InequalitiesQuilts
Lesson 13: Graphing Solution Sets of Systems of Linear InequalitiesSeeking Solutions
Lesson 16: Using Lines to Model Bivariate Quantitative DataCity Data
Lesson 17: Modeling Relationships with a LinePenguin Populations
Lesson 18: Calculating and Analyzing ResidualsResidual Fruit
Lesson 20: Interpreting CorrelationCorrelation Coefficient
How Hot Is It?
City Slopes
Lesson 21: Analyzing Bivariate Quantitative DataBehind the Headlines

Module 3: Functions and Their Representations

Lesson 7: Exploring Key Features of a Function and Its GraphCraft-a-Graph
Lesson 17: Piecewise Linear Functions in ContextPumpkin Prices

Module 4: Quadratic Functions

Topic A: Quadratic Functions and Their GraphsRobot Launch
Lesson 1: Falling ObjectsQuadratic Visual Patterns
Lesson 2: Projectile MotionStomp Rockets
Lesson 3: Analyzing Functions That Model Projectile MotionStomp Rockets in Space
Lesson 4: Graphs of Quadratic FunctionsOn the Fence
Plenty of Parabolas
Lesson 5: Solving Equations that Contain Factored ExpressionsShooting Stars
Lesson 11: Graphing Quadratic Functions from Factored FormTwo for One
Parabola Zapper
Lesson 14: Solving Quadratic Equations by Completing the SquareSquare Tactic
Lesson 27: Search and Rescue HelicopterCity Data

Module 5: Linear and Exponential Functions

Topic A: Arithmetic and Geometric SequencesMore Visual Patterns
Sequence Carnival
Lesson 8: Exponential FunctionsCarlos’s Fish
Topic A: Arithmetic and Geometric SequencesSequence Carnival
Topic A: Arithmetic and Geometric SequencesRevisiting Visual Patterns, Part 1
Lesson 18: Modeling PopulationsSorting Relationships
Lesson 20: Comparing Growth of FunctionsPlane, Train, and Automobile
Sorting Relationships

Module 6: Modeling with Functions

Topic A: Modeling Bivariate Quantitative DataCity Data
Topic B: Developing Models for ContextsDetroit’s Population, Part 1
Detroit’s Population, Part 2

Grade K

Topic Opener Numbers 0 to 5

Topic Opener Numbers 0 to 5Connecting Cubes

Topic 1: Numbers 0 to 5

Lesson 1-2 Recognize 1, 2, and 3 in Different ArrangementsSkye’s Style
Lesson 1-5 Recognize 4 and 5 in Different ArrangementsMatching Groups
Designing Shoes with Skye
3-ACT MATH: Set the TableInvestigate: Cafeteria Math

Topic 3: Numbers 6 to 10

Lesson 3-2: Read, Make, and Write 6 and 7Moving and Grooving
Lesson 3-4: Read, Make, and Write 8 and 9Moving and Grooving
Lesson 3-6: Read, Make, and Write 10Moving and Grooving
Lesson 3-7: Count Numbers to 10Fingers as Math Tools

Topic 4: Compare Numbers 0 to 10

Lesson 4-1: Compare Groups to 10 by MatchingMore, Fewer, or the Same
Forest Friends
Lesson 4-2: Compare Numbers Using Numerals to 10Fingers and Counters
Lesson 4-3: Compare Groups to 10 by CountingComparing Words

Topic 6: Understand Addition

Interactive Math StoryInvestigate: Casey’s Town
Lesson 6-1: Explore AdditionHow Many Objects in Pictures?
The Bus Depot
Lesson 6-2: Represent Addition as Adding ToHow Will You Count?
Lesson 6-3: Represent Addition as Putting TogetherHow Many Objects?
Lesson 6-4: Represent and Explain Addition with EquationsWhat Does It Mean to Add?

Topic 7: Understand Subtraction

Lesson 7-1: Explore SubtractionWhat Does It Mean to Subtract?
The Bus Depot

Topic 8: More Addition and Subtraction

Lesson 8-5: Decompose 6 and 7 to Solve ProblemsHarry Explores the Ocean
Lesson 8-6: Decompose 8 and 9 to Solve ProblemsHarry Explores the Ocean
Lesson 8-8: Decompose 10 to Solve ProblemsHarry Explores the Ocean

Topic 12: Identify and Describe Shapes

Lesson 12-2: Circles and TrianglesWhat’s That Shape Called?
Lesson 12-3: Squares and Other RectanglesAnother Shape

Topic 13: Analyze, Compare, and Create Shapes

Lesson 13-1: Analyze and Compare Two-Dimensional (2-D) ShapesAnother Shape
So Much Sorting

Grade 1

Topic 1: Understand Addition and Subtraction

Lesson 1-4: Take FromPacking for a Picnic
What’s the Difference?
Lesson 1-7: Change UnknownReplanting Huli
Lesson 1-8: Practice Adding and SubtractingLeaping Lily Pads!

Topic 2: Fluently Add and Subtract Within 10

enVision STEM ProjectA Community Working Together
Topic 2 Interactive Math StoryInvestigate: Let’s Grow!
Lesson 2-8: Solve Word Problems with Facts to 10Tutu’s Garden in Maui
The Kalo Plants
Helping Others

Topic 3: Addition Facts to 20: Use Strategies

Lesson 3-5: Make 10 to AddMaking 10
Lesson 3-6: Continue to Make 10 to AddKitten Coaster

Topic 6: Represent and Interpret Data

Lesson 6-1: Organize Data into Three CategoriesShapes Ying Saw

Topic 7: Extend the Counting Sequence

Lesson 7-1: Count by 10s to 120Meeting Yara
Grade 1 Lesson 7-5: Count on an Open Number LineTime to Line Up!
Grade 1 Lesson 7-5: Count on an Open Number LineWhat’s That Number?

Topic 8: Understand Place value

Lesson 8-1: Make Numbers 11 to 19Same Number, Different Ways
Lesson 8-2: Numbers Made with TensInvestigate: Game Points
It’s a Match

Topic 9: Compare Two-Digit Numbers

Lesson 9-3: Compare NumbersInvestigate: Where Am I?
Grade 1 Lesson 9-5: Compare Numbers on a Number LineGreater Than, Less Than, or Equal to
Grade 1 Lesson 9-5: Compare Numbers on a Number LineIn Full Bloom

Topic 10: Use Models and Strategies to Add Tens and Ones

Lesson 10-1: Add Tens Using ModelsHow Many Cubes?
Boris’s Thimbles
How Many Tens?

Topic 11: Use Models and Strategies to Subtract Tens

Lesson 11-1: Subtract Tens Using ModelsBoris’s Thimbles
Lesson 11-2: Subtract Tens Using a Hundred ChartHow Many Tens?

Topic 14: Reason with Shapes and Their Attributes

Lesson 14-1: Use Attributes to Define Two-Dimensional (2-D) ShapesShapes Ying Saw

Grade 2

Topic 1: Fluently Add and Subtract Within 20

Lesson 1-1: Addition Fact StrategiesExploring Within 10
Lesson 1-3: Make a 10 to AddWays to Make 10

Topic 8: Work with Time and Money

Lesson 8-1: Solve Problems with CoinsInvestigate: Activities at the Block Party
Discovering Coins (Part 1)
Discovering Coins (Part 2)
Lesson 8-2: Continue to Solve Problems with CoinsHow Much Money?
Discovering Coins (Part 2)
Lesson 8-5: Problem Solving: ReasoningThe Toy Stand
The Craft Stand at the Block Party

Topic 12: Measuring Length

Lesson 12-8: Compare LengthsLengths of Jungle Animals

Topic 15: Graphs and Data

Lesson 15-1: Line PlotsMessy Measurements
Lesson 15-2: More Line PlotsBracelets and Wristbands
Lesson 15-3: Bar GraphsAwesome Aquariums

Grade 3

Topic 1: Understand Multiplication and Division of Whole Numbers

Lesson 1-1: Relate Multiplication and AdditionEqual Groups
Lesson 1-3: Arrays and PropertiesArrays of Flavor

Topic 4: Use Multiplication to Divide: Division Facts

Lesson 4-1: Relate Multiplication and DivisionIt’s Chili in Here
Relating Quotients to Familiar Products
Lesson 4-8: Solve Multiplication and Division EquationsDivision and Multiplication Equations

Topic 6: Connect Area to Multiplication and Addition

Lesson 6-1: Cover RegionsInvestigate: Comparing Rugs
Which Covers More Space?
Lesson 6-2: Area: Nonstandard UnitsTiling Figures
Lesson 6-3: Area: Standard UnitsArea Hunt
Lesson 6-4: Area of Squares and RectanglesRectangles and Arrays

Topic 7: Represent and Interpret Data

Lesson 7-3: Make Bar GraphsPuppy Pile
2, 5, or 10?

Topic 8: Use Strategies and Properties to Add and Subtract

Topic 8 VocabularyInvestigate: Create a Photo Gallery
Lesson 8-2: Algebra: Addition PatternsPanda Patterns
Lesson 8-3: Mental Math: AdditionHow Would You Solve It?

Topic 9: Fluently Add and Subtract within 1,000

Lesson 9-1: Use Partial Sums to AddAdding Your Way
What is an Algorithm?
Lesson 9-2: Use Regrouping to AddUsing Fewer Digits
Lesson 9-3: Add 3 or More NumbersDetermining Sums of 2 or More Addends
Lesson 9-6: Use Strategies to Add and SubtractAdding Strategically

Grade 4

Topic 7: Factors and Multiples

3-ACT MATH: Can-Do AttitudeHamster Homes
Lesson 7-2: FactorsFactor or Multiple?
Lesson 7-4: Prime and Composite NumbersA Number Game
Lesson 7-5: MultiplesFactor or Multiple?
How Does It Grow?

Topic 8: Extend Understanding of Fraction Equivalence and Ordering

Lesson 8-2: Equivalent Fractions: Number LinesInvestigate: Building Your Own Number Line
All Kinds of Fractions
Lesson 8-5: Use Benchmarks to Compare FractionsFraction Strips
Lesson 8-5: Use Benchmarks to Compare FractionsChop It

Topic 9: Understand Addition and Subtraction of Fractions

Lesson 9-1: Model Addition of FractionsPizza Problems
Lesson 9-4: Model Subtraction of FractionsPizza Problems
Lesson 9-2: Decompose FractionsMath Pizzeria

Topic 10: Extend Multiplication Concepts to Fractions

Lesson 10-1: Fractions as Multiples of Unit FractionsEqual Groups of Fractions

Topic 12: Understand and Compare Decimals

Topic 12 Review What You KnowInvestigate: Different Units
Lesson 12-1: Fractions and DecimalsA New Way to Write Tenths
A New Way to Write Hundredths
Lesson 12-2: Fractions and Decimals on the Number LineAre They Equivalent?
What’s the Order?
Lesson 12-3: Compare DecimalsHow Can You Compare?
Robot Factory

Grade 5

Topic 3: Fluently Multiply Multi-Digit Whole Numbers

Lesson 3-5: Multiply 3-Digit by 2-Digit NumbersPartial Products Everywhere
Lesson 3-7: Practice Multiplying Multi-Digit NumbersHow Do They Compare?

Topic 5: Use Models and Strategies to Divide Whole Numbers

Lesson 5-4: Use Partial Quotients to DivideEmptying the Water Tank

Topic 8: Apply Understanding of Multiplication to Multiply Fractions

Lesson 8-3: Multiply Fractions and Whole NumbersMaking Food
Lesson 8-4: Use Models to Multiply Two FractionsInvestigate: Folding Paper
Parts of Parts
One Part of One Part
Lesson 8-5: Multiply Two FractionsMaking Food
Messy Multiplication
Lesson 8-6: Area of a RectangleInstalling Turf
Rows and Columns
Lesson 8-7: Multiply Mixed NumbersApplying Fraction Multiplication
Messy Multiplication
Lesson 8-8: Multiplication as ScalingChores at Animal Haven
The Re-size-inator

Topic 9: Apply Understanding of Division to Divide Fractions

Topic 11: Understand Volume Concepts

Lesson 11-1: Model VolumeWhich is Largest
3-ACT Math: Fill ‘er UpPacking the Barge
Lesson 11-3: Combine Volumes of PrismsPutting It Together
Figures Made of Prisms

Algebra 1

No lessons focused on only shape patterns.

Topic 1: Solving Equations and Inequalities

Lesson 1-2: Solving Linear EquationsWorking Backwards
Solving Strategies
Lesson 1-3: Solving Linear Equations With a Variable on Both SidesSame Position
Lesson 1-4: Literal Equations & FormulasSubway Seats
Various Variables
Lesson 1-5: Solving Inequalities in One VariablePizza Delivery

Topic 2: Linear Equations

Lesson 2-3: Standard FormShelley the Snail
Five Representations

Topic 3: Linear Functions

Lesson 3-4: Arithmetic SequenceMore Visual Patterns
Sequence Carnival
Lesson 3-5: Scatter Plots and Lines of FitCorrelation Coefficient
How Hot Is It?
City Slopes
Lesson 3-6: Analyzing Lines of FitResidual Fruit
Penguin Populations
Behind the Headlines
City Data

Topic 4: Systems of Linear Equations and Inequalities

Lesson 4-1: Solving Systems of Linear Equations by GraphingLizard Lines
Lesson 4-2: Solving Systems of Equations by SubstitutionShape It Up
Lesson 4-5: Systems of Linear InequalitiesQuilts
Seeking Solutions

Topic 5: Piecewise Functions

Lesson 5-2: Piecewise Defined FunctionsCraft-a-Graph
Pumpkin Prices

Topic 6: Exponents and Exponential Functions

Lesson 6-3: Exponential FunctionsCarlos’s Fish
Lesson 6-5: Geometric SequencesRevisiting Visual Patterns, Part 1
Sequence Carnival
More Visual Patterns

Topic 8: Quadratic Functions

Lesson 8-1: Key Features of a Quadratic FunctionRevisiting Visual Patterns, Part 1
Quadratic Visual Patterns
On the Fence
Lesson 8-3: Quadratic Functions in Standard FormPlenty of Parabolas
Two for One
Lesson 8-4: Modeling with Quadratic FunctionsStomp Rockets
Robot Launch
Lesson 8-5: Linear, Exponential and Quadratic ModelsSorting Relationships

Topic 9: Solving Quadratic Equations

Lesson 9-1: Solving Quadratics Using Graphs and TablesStomp Rockets
Lesson 9-2: Solving Quadratic Equations by FactoringParabola Zapper
Shooting Stars
Lesson 9-4: Completing the SquareSquare Tactic
Lesson 9-5: The Quadratic Formula and the DiscriminantStomp Rockets in Space

Topic 10: Working with Functions

Lesson 10-1: The Square Root Function ( & average rate of change)Plane, Train, and Automobile
Lesson 10-3: Analyzing Functions Graphically (Abs, Quad, Sq.Root, Exp, Cubic)Craft-a-Graph
Detroit’s Population, Part 1
Detroit’s Population, Part 2
Lesson 10-7: Inverse FunctionsChip the Robot

Topic 11: Statistics

Lesson 11-4: Standard DeviationFinding Desmo

Disclaimer

This document is for informational purposes only; references to third-party programs do not imply endorsement or affiliation, and all trademarks are the property of their respective owners.

Grade 6

Unit 1: Area and Surface Area

Amplify MathDesmos Math 6–A1
Unit 1: Area and Surface AreaUnit 1: Area and Surface Area
Unit 7: Positive and Negative Numbers
Lesson 1: The TangramUnit 1
Lesson 1: Shapes on a Plane
Lesson 2: Exploring the TangramUnit 1
Lesson 2: Letters
Sub-Unit 1 : Area of Special Polygons
Lesson 3: Tilting the PlaneUnit 1
Lesson 1: Shapes on a Plane
Lesson 4: Compositing and Rearranging to Determine AreaUnit 1
Lesson 2: Letters
Lesson 5: Reasoning to Determine AreaUnit 1
Lesson 2: Letters
Lesson 6: ParallelogramsUnit 1
Lesson 3: Exploring Parallelograms (Print available)
Lesson 4: Off the Grid
Lesson 7: Bases and Heights of ParallelogramsUnit 1
Lesson 3: Exploring Parallelograms (Print available)
Lesson 4: Off the Grid
Lesson 8: Bases and Heights of ParallelogramsUnit 1
Lesson 3: Exploring Parallelograms (Print available)
Lesson 4: Off the Grid
Lesson 9: From Parallelograms to TrianglesUnit 1
Lesson 3: Exploring Parallelograms (Print available)
Lesson 4: Off the Grid
Lesson 6: Triangles and Parallelograms
Lesson 10: Bases and Heights of TrianglesUnit 1
Lesson 4: Off the Grid
Lesson 6: Triangles and Parallelograms
Lesson 11: Formula for the Area of a TriangleUnit 1
Lesson 5: Exploring Triangles (Print available)
Lesson 12: From Triangles to TrapezoidsUnit 1
Lesson 4: Off the Grid
Lesson 6: Triangles and Parallelograms
Lesson 13: PolygonsUnit 1
Lesson 2: Letters
Lesson 8: Pile of Polygons Practice Day 1 (Print available)

Unit 7
Lesson 11: Polygon Maker
Sub-Unit 2: Nets and Surface Area
Lesson 14: What is Surface Area?Unit 1
Lesson 9: Renata’s Stickers
Lesson 15: Nets and Surface Area of Rectangular PrismsUnit 1
Lesson 10: Plenty of Polyhedra
Lesson 11:Nothing but Nets(Print available)
Lesson 12: Face Value
Lesson 13: Take It To Go (Print available)
Lesson 16: Nets and Surface Area of PrismsUnit 1
Lesson 12: Face Value
Lesson 13: Take It To Go (Print available)
Lesson 17: Constructing a RhombicuboctahedronUnit 1
Lesson 13: Take It To Go (Print available)
Lesson 18: Simplifying Expressions for Squares and CubesUnit 1
Lesson 11: Exponent Expressions (Print available)
Lesson 12: Squares and Cubes
Lesson 19: Simplifying Expressions Even More Using ExponentsUnit 1
Lesson 11: Exponent Expressions (Print available)
Lesson 20: Designing a Suspended Tent 

Unit 2: Introducing Ratios

Amplify MathDesmos Math 6–A1
Unit 2: Introducing RatiosUnit 2: Introducing Ratios
Lesson 1: Fermi Problems 
Sub-Unit 1: What are Ratios?
Lesson 2: Introducing Ratios and Ratio LanguageUnit 2
Lesson 1: Pizza Maker
Lesson 2: Ratio Rounds (Print available)
Lesson 3: Representing Ratios with DiagramsUnit 2
Lesson 1: Pizza Maker
Lesson 2: Ratio Rounds (Print available)
Lesson 3:Rice Ratios (Print available)
Lesson 4: A Recipe for Purple Oobleck 
Lesson 5: Kapa Dyes 
Sub-Unit 2:Equivalent Ratios
Lesson 6: Defining Equivalent RatiosUnit 2
Lesson 3: Rice Ratios (Print available)
Lesson 4: Fruit Lab (Print available)
Lesson 11: Community Life (Print available)
Practice Day 1 (Print available)
Lesson 7: Representing Equivalent Ratios with Tables 
Lesson 8: Reasoning with Multiplication and Division (optional) 
Lesson 9: Common Factors 
Lesson 10: Common Multiples 
Lesson 11: Navigating a Table of Equivalent RatiosUnit 2
Lesson 6: Product Prices (Print available)
Lesson 7: Mixing Paint, Part 1
Lesson 12: Tables and Double Number Line DiagramsUnit 2
Lesson 6: Product Prices (Print available)
Lesson 7: Mixing Paint, Part 1
Lesson 13: Tempo and Double Number LinesUnit 2
Lesson 5: Balancing Act
Lesson 6: Product Prices (Print available)
Sub-Unit 3: Solving Ratio Problems 
Lesson 14: Solving Equivalent RatiosUnit 2
Lesson 6: Product Prices (Print available)
Lesson 7: Mixing Paint, Part 1
Lesson 10: Balloons
Lesson 11: Community Life (Print available)
Lesson 15: Part-Part-Whole RatiosUnit 2
Lesson 12 Mixing Paint, Part 2
Lesson 13: City Planning
Lesson 16: Comparing Ratios 
Lesson 17: More Comparing and Solving 
Lesson 18: Measuring with Different-Sized Units 
Lesson 20: More Fermi Problems 

Unit 3: Rates and Percentages

Amplify MathDesmos Math 6–A1
Unit 3: Rates and PercentagesUnit 2: Introducing Ratios
Unit 3: Unit Rates and percentages
Lesson 1: Choosing Representation for Student CouncilLaunch Lesson
Sub-Unit 1: Rates
Lesson 2: How Much for One?Unit 3
Lesson 4: Model Trains
Lesson 3: Constant Speed  
Lesson 4: Comparing SpeedsUnit 2
Lesson 8: World Records (Print available) 

Unit 3
Lesson 4: Model Trains
Lesson 5: Soft Serve
Lesson 6: Welcome to the Robot Factory
Lesson 5: Interpreting RatesUnit 3
Lesson 8: World Records (Print available) 

Unit 3
Lesson 4: Model Trains
Lesson 5: Soft Serve
Lesson 6: Welcome to the Robot Factory
Lesson 6: Comparing Rates 
Lesson 7: Solving Rate ProblemsUnit 3
Lesson 7: More Soft Serve
Sub-Unit 2: Percentages
Lesson 8: What Are percentages?Unit 3
Lesson 8: Lucky Duckies
Lesson 9: Bicycle Goals
Lesson 9: Determining Percentages 
Lesson 10: Benchmark PercentagesUnit 3
Lesson 7: Lucky Duckies
Lesson 11: Finding This Percent of ThatUnit 3
Lesson 10: What’s Missing? (Print available)
Lesson 11: Cost Breakdown
Lesson 12: More Bicycle Goals
Lesson 13: A Country as a Village
Lesson 12: This Percent of What 
Lesson 13: Solving Percentage ProblemsUnit 3
Lesson: 10: What’s Missing (Print available)
Lesson: 11: Cost Breakdown
Lesson: 12: More Bicycle Goals
Lesson: 13: A Country as a Village
Lesson 14: If Our Class Were the World 
Lesson 15: Voting for a School Mascot 

Unit 4: Dividing Fractions

Amplify MathDesmos Math 6–A1
Lesson 1: Seeing Fractions
Sub-Unit 1: Interpreting Division Scenarios
Lesson 3: Relating Multiplication and Division 
Lesson 4: Size of Divisor and Size of QuotientUnit 4
Lesson 1: Cookie Cutter
Sub-Unit 2: Division with Fractions
Lesson 5: How Many GroupsUnit 4
Lesson 3: Flour Planner
Lesson 4: Flower Planters
Lesson 4: Garden Bricks (Print available) 
Lesson 6: Using Diagrams to Find the Number of GroupsUnit 4
Lesson 5: Garden Bricks (Print available)
Lesson 6: Fill the Gap
Lesson 7: Dividing with Common DenominatorsUnit 4
Lesson 6: Fill the Gap
Lesson 8: How Much in Each Group? (Part 1)Unit 4
Lesson 8: Potting Soil
Lesson 9: How Much in Each Group? (Part 2)Unit 4
Lesson 8: Potting Soil
Lesson 10: Dividing by Unit and Non-Unit FractionsUnit 4
Lesson 7: Break It Down
Lesson 8: Potting Soil
Lesson 9: Division Challenges
Lesson 11: Using an Algorithm to Divide FractionsUnit 4
Lesson 9: Division Challenges Practice Day
Lesson 13: Fractional LengthsUnit 4
Lesson 12: Puzzling 
Lesson 14: Area with Fractional LengthsUnit 4
Lesson 9: Puzzling Area (Print available)
Lesson 15: Volume of PrismsUnit 4
Lesson 13: Volume Challenges (Print available)
Lesson 16: Fish Tanks Inside of Fish TanksUnit 4
Lesson 10: Swap Meet
Lesson 17: Now, Where Was That Bus?Unit 4
Lesson 10: Capstone

Unit 5: Arithmetic in Base Ten

Amplify MathDesmos Math 6–A1
Lesson 1: Precision and World Records 
Sub-Unit 1: Adding and Subtracting Decimals 
Lesson 2: Speaking of Decimals…Unit 5
Lesson 1: Dishing Out Decimals (Print available)
Lesson 3: Adding and Subtracting DecimalsUnit 5
Lesson 3: Fruit by the Pound
Lesson 4: Missing Digits
Lesson 4: X Games Medal ResultsUnit 5
Lesson 2: Decimal Diagrams
Sub-Unit 2: Multiplying Decimals
Lesson 5: Decimal Points in ProductsUnit 5
Lesson 5: Decimal Multiplication
Lesson 6: Methods for Multiplying DecimalsUnit 5
Lesson 5: Decimal Multiplication
Lesson 6: Multiplying with Areas
Lesson 7: Multiplication Methods (Print available)
Lesson 7: Using Diagrams to Represent MultiplicationUnit 5
Lesson 5: Decimal Multiplication
Lesson 6: Multiplying with Areas
Lesson 8: Calculating Products of DecimalsUnit 5
Lesson 6: Multiplying with Areas
Sub-Unit 3: Dividing Decimals
Lesson 9: Exploring Division 
Lesson 10: Using Long DivisionUnit 5
Lesson 8: Division Diagrams
Lesson 9: Long Division Launch (Print available)
Lesson 10: Return of the Long Division (Print available)
Lesson 11: Dividing Numbers That Result in DecimalsUnit 5
Lesson 9: Long Division Launch (Print available)
Lesson 10: Return of the Long Division (Print available)
Lesson 12: Using Related Expressions to Divide with Decimals 
Lesson 13: Dividing Multi-Digit DecimalsUnit 5
Lesson 9: Long Division Launch (Print available)
Lesson 10: Return of the Long Division (Print available)
Lesson 14: The So-called World’s Littlest Skyscraper

Unit 6: Expressions and Equations

Amplify MathDesmos Math 6–A1
Unit 6: Expressions and EquationsUnit 6: Expressions and Equations
Lesson 1: Detecting Counterfeit Coins
Sub-Unit 1: Expressions and Equations in One Variable
Lesson 2: Write Expressions Where Letters Stand for Numbers 
Lesson 3: Tape Diagrams and Equations 
Lesson 4: Truth and EquationsUnit 6
Lesson 1: Weight for It
Lesson 2: Five Equations (Print available)
Lesson 5: Staying in BalanceUnit 6
Lesson 1: Weight for It
Lesson 2: Five Equations (Print available)
Lesson 3: Hanging Around
Lesson 6: Staying in Balance with Variables 
Lesson 7: Practice Solving EquationsUnit 6
Lesson 3: Hanging Around
Lesson 4: Hanging It Up
Lesson 5: Swap and Solve (Print available)
Lesson 8: A New Way to Interpret a over bUnit 6
Lesson 4: Hanging It Up
Lesson 5: Swap and Solve (Print available)
Lesson 9: Revisiting Percentages
Sub-Unit 2: Equivalent Expressions
Lesson 10: Equal and Equivalent (Part 1)Unit 6
Lesson 1: Weight for It
Lesson 2: Five Equations (Print available)
Lesson 3: Hanging Around
Lesson 6: Vari-apples
Lesson 11: Equal and Equivalent (Part 2)Unit 6
Lesson 1: Weight for It
Lesson 2: Five Equations (Print available)
Lesson 3: Hanging Around
Lesson 6: Vari-apples
Lesson 12: The Distributive Property, Part 1Unit 6
Lesson 8: Products and Sums
Lesson 9: Products, Sums, and Differences (Print available)
Lesson 13: The Distributive Property, Part 2Unit 6
Lesson 8: Products and Sums
Lesson 9: Products, Sums, and Differences (Print available)
Lesson 14: Meaning of ExponentsUnit 6
Lesson 10: Powers
Lesson 11: Exponent Expressions (Print available)
Lesson 15: Evaluating Expressions with ExponentsUnit 6
Lesson 11: Exponent Expressions (Print available)
Lesson 12: Squares and Cubes
Lesson 16: Analyzing Exponential Expressions and EquationsUnit 6
Lesson 11: Exponent Expressions (Print available)
Lesson 12: Squares and Cubes
Sub-Unit 3: Relationships Between Quantities
Lesson 17: Two Related Quantities, Part 1Unit 6
Lesson 13: Turtles All the Way
Lesson 14: Representing Relationships
Lesson 15: Connecting Representations (Print available)
Lesson 18: Two Related Quantitites, Part 2Unit 6
Lesson 13: Turtles All the Way
Lesson 14: Representing Relationships
Lesson 15: Connecting Representations (Print available)
Lesson 19: Creating a Class Mobile 

Unit 7: Rational Numbers

Amplify MathDesmos Math 6–A1
Unit 7: Rational Numbers
Unit 1: Area and Surface Area
Unit 7: Positive and Negative Numbers
Lesson 1: How Far? Which Way?
Sub-unit 1: Negative Numbers and Absolute Value
Lesson 2: Positive and Negative NumbersUnit 7
Lesson 1: Can You Dig In
Lesson 2: Digging Deeper
Lesson 3: Points on the Number LineUnit 7
Lesson 2: Digging Deeper
Lesson 4: Comparing IntegersUnit 7
Lesson 3: Order in the Class (Print available)
Lesson 5: Comparing and Ordering Rational NumbersUnit 7 
Lesson 3: Order in the Class (Print available)
Lesson 6: Using Negative Numbers to Make Sense of Contexts>Unit 7
Lesson 4: Sub-Zero
Lesson 7: Absolute Value of NumbersUnit 7
Lesson 5: Distance on the Number Line
Lesson 8: Comparing Numbers and Distance from ZeroUnit 7
Lesson 5: Distance on the Number Line
Sub-Unit 2: Inequalities
Lesson 9: Writing Inequalities 
Lesson 10: Graphing Inequalities 
Lesson 11: Solutions to One or More InequalitiesUnit 7
Lesson 6: Tunnel Travel
Lesson 7: Comparing Weights
Lesson 8: Shira´s Solutions
Lesson 12: Interpreting InequalitiesUnit 7
Lesson 6: Tunnel Travel
Lesson 7: Comparing Weights
Lesson 8: Shira´s Solutions
Sub-Unit 3: The Coordinate Plane
Lesson 13: Extending the Coordinate Plane 
Lesson 14: Points on the Coordinate PlaneUnit 7
Lesson 9: Sand Dollar Search
Lesson 10: The A-maze-ing Coordinate Plane
Lesson 15: Interpreting Points on a Coordinate PlaneUnit 7
Lesson 9: Sand Dollar Search
Lesson 10: The A-maze-ing Coordinate Plane
Lesson 11: Polygon Maker
Lesson 16: Distances on a Coordinate PlaneUnit 7
Lesson 11: Polygon Maker
Lesson 12: Graph Telephone (Print available)
Lesson 17: Shapes on the Coordinate PlaneUnit 1
Lesson 1: Shapes on a Plane
Lesson 2: Letters
Lesson 5: Exploring Triangles (Print available)
Lesson 6: Triangles and Parallelograms

Unit 7
Lesson 3: Exploring Parallelograms (Print available)
Lesson 11: Polygon Maker
Lesson 12: Graph Telephone (Print available)
Lesson 18: Lost and Found Puzzles 
Lesson 19: Drawing on the Coordinate PlaneUnit 7
Lesson 11: Polygon Maker
Lesson 12: Graph Telephone (Print available)

Unit 8: Data Sets and Distributions

Amplify MathDesmos Math 6–A1
Unit 8: Data Sets and DistributionsUnit 8: Describing Data
Lesson 1: Plausible Variation or New Species?
Sub-Unit 1: Statistical Questions and Representing Data
Lesson 2: Statistical QuestionsUnit 8
Lesson 1: Screen Time
Lesson 2: Dot Plots
Lesson 3: Interpreting Dot PlotsUnit 8
Lesson 2: Dot Plots
Lesson 3: Minimum Wage (Print available)
Lesson 4: Lots More Dots
Lesson 4: USing Dot Plots to Answer Statistical QuestionsUnit 8
Lesson 2: Dot Plots
Lesson 3: Minimum Wage (Print available)
Lesson 4: Lots More Dots
Lesson 5: Interpreting HistogramsUnit 8
Lesson 5: The Plot Thickens
Lesson 6: DIY Histograms (Print available)
Lesson 6: Using Histograms to Answer Statistical QuestionsUnit 8
Lesson 5: The Plot Thickens
Lesson 6: DIY Histograms (Print available)
Lesson 7: Describing Distributions on HistogramsUnit 8
Lesson 5: The Plot Thickens
Lesson 6: DIY Histograms (Print available)
Sub-Unit 2: Measures of Center
Lesson 8: Mean as a Fair ShareUnit 8
Lesson 7: Snack Time
Lesson 9: Mean as a Balance PointUnit 8
Lesson 7: Snack Time
Lesson 10: MedianUnit 8
Lesson 11: Toy Cars
Lesson 12: In the News
Lesson 11: Comparing Mean and MedianUnit 8
Lesson 12: In the News
Sub-Unit 3: Measures of Variability
Lesson 12: Describing Variability 
Lesson 13: Variability and MAD 
Lesson 14: Variability and IQRUnit 8
Lesson 13: Pumpkin Patch
Lesson 15: Box PlotsUnit 8
Lesson 14: Car, Plane, Bus, or Train? (Print available)
Lesson 16: Comparing MAD and IQR 
Lesson 17: Asian Elephant Populations 

Grade 7

Unit 1: Scale Drawings

Amplify MathDesmos Math 6–A1
Unit 1: Scale DrawingsUnit 1: Scale Drawings
Unit 3: Measuring Circles
Unit 4: Proportional Relationships and Percentages
Lesson 1: Scale-y Shapes 
Sub-Unit 1: Scaled Copies 
Lesson 2: What are Scaled Copies?Unit 1
Lesson 1: Scaling Machines
Lesson 3: Corresponding Parts and Scale FactorsUnit 1
Lesson 2: Scaling Robots 
Unit 3
Lesson 1: Toothpicks
Lesson 4: Making Scaled CopiesUnit 1
Lesson 3: Make It Scale 
Unit 4
Lesson 3: Sticker Sizes
Lesson 5: The Size of the Scale FactorUnit 1
Lesson 4: Tiles
Lesson 6: Scaling and AreaUnit 1
Lesson 5: Tiles Practice Day 1 (Print available)
Sub-Unit 2: Scale Drawings 
Lesson 7: Scale DrawingsUnit 1
Lesson 6: Introducing Scale
Lesson 7: Will It Fit? (Print available)
Lesson 8: Creating Scale DrawingsUnit 1
Lesson 8: Scaling States
Lesson 9: Scaling Buildings
Lesson 10: Room Redesign (Print available)
Lesson 9: Scale Drawings and Maps 
Lesson 10: Changing Scale in Scale DrawingsUnit 1
Lesson 8: Scaling States
Lesson 9: Scaling Buildings
Lesson 10: Room Redesign (Print available)
Lesson 11: Scales without Units 
Lesson 12: Units in Scale DrawingsUnit 1
Lesson 8: Scaling States
Lesson 9: Scaling Buildings
Lesson 10: Room Redesign (Print available)Practice Day (Print available)
Lesson 13: Build Your Brand 

Unit 2: Introducing Proportional Relationships

Amplify MathDesmos Math 6–A1
Unit 2: Introducing Proportional RelationshipsUnit 2: Introducing Proportional Relationships
Unit 4: Proportional Relationships and Percentages
Lesson 1: Making Music 
Sub-Unit 1: Representing Proportional Relationships with Tables and Equations
Lesson 2: Introducing Proportional Relationships with TablesUnit 2
Lesson 2: Balloon Float
Lesson 3: Sugary Drinks (Print available)
Lesson 4: Robot Factory
Lesson 3: More About Constant of ProportionalityUnit 2
Lesson 3: Sugary Drinks (Print available)

Unit 4
Lesson 3: Sticker Sizes
Lesson 4: Comparing Relationships with TablesUnit 2
Lesson 4: Robot Factory
Lesson 5: Snapshots
Lesson 6: Two and Two (Print available)
Lesson 7: All Kinds of Equations
Lesson 5: Proportional Relationships and EquationsUnit 2
Lesson 4: Robot Factory
Lesson 5: Snapshots
Lesson 6: Two and Two (Print available)
Lesson 7: All Kinds of Equations
Lesson 6: Speed and Equations 
Lesson 7: Two Equations for Each RelationshipUnit 2
Lesson 4: Two and Two (Print available)
Lesson 5: Lesson 7: All Kinds of Equations
Lesson 8: Using Equations to Solve ProblemsUnit 2
Lesson 6: Two and Two (Print available)
Lesson 7: All Kinds of Equations
Lesson 9: Comparing Relationships with EquationsUnit 2
Lesson 4: Robot Factory
Lesson 5: Snapshots
Lesson 6: Two and Two (Print available)
Lesson 7: All Kinds of Equations
Lesson 11: Four Representations (Print available)
Lesson 12: Water Efficiency
Lesson 10: Solving Problems About Proportional RelationshipsUnit 2
Lesson 12: Water Efficiency
Sub-Unit 2: Representing Proportional Relationships with Graphs 
Lesson 11: Introducing Graphs of Proportional RelationshipsUnit 2
Lesson 8: Dino Pops
Lesson 9: Gallon Challenge
Lesson 10: Three Turtles
Lesson 11: Four Representations
Lesson 12: Water Efficiency
Lesson 12: Interpreting Graphs of Proportional RelationshipsUnit 2
Lesson 8: Dino Pops
Lesson 9: Gallon Challenge
Lesson 10: Three Turtles
Lesson 11: Four Representations
Lesson 12: Water Efficiency
Lesson 13: Using Graphs to Compare RelationshipsUnit 2
Lesson 8: Dino Pops
Lesson 9: Gallon Challenge
Lesson 10: Three Turtles
Lesson 11: Four Representations
Lesson 12: Water Efficiency
Lesson 14: Two Graphs for Each RelationshipUnit 2
Lesson 8: Dino Pops
Lesson 9: Gallon Challenge
Lesson 10: Three Turtles
Lesson 11: Four Representations
Lesson 12: Water Efficiency
Lesson 15: Four Ways to Tell One Story (Part 1) 
Lesson 16: Four Ways to Tell One Story (Part 2) 
Lesson 17: Welcoming Committee 

Unit 3: Measuring Circles

Amplify MathDesmos Math 6–A1
Unit 3: Measuring CirclesUnit 3: Measuring Circles
Lesson 1: The Wandering Goat 
Sub-unit 1: Circumference of a Circle 
Lesson 2: Exploring CirclesUnit 3
Lesson 2: Is it a Circle?
Lesson 3: Measuring Around
Lesson 3: How Well Can You Measure? 
Lesson 4: Exploring CircumferenceUnit 3
Lesson 2: Is It a Circle?
Lesson 3: Measuring Around
Lesson 5: Understanding π 
Lesson 6: Applying CircumferenceUnit 3
Lesson 2: Is It a Circle?
Lesson 3: Measuring Around
Lesson 7: Circumference and Wheels 
Sub-Unit 2: Area of a Circle
Lesson 8: Exploring the Area of a CircleUnit 3
Lesson 5: Area Strategies
Lesson 6: Radius Squares (Print available)
Lesson 7: Why Pi?
Lesson 8: Area Challenges
Lesson 9: Circle vs. Square
Practice Day 2 (Print available)
Lesson 9: Relating Area to CircumferenceUnit 3
Lesson 5: Area Strategies
Lesson 6: Radius Squares (Print available)
Lesson 7: Why Pi?
Lesson 8: Area Challenges
Lesson 9: Circle vs. Square
Practice Day 2 (Print available)
Lesson 10: Applying Area to CirclesUnit 3
Lesson 6:Radius Squares (Print available)
Lesson 11: Distinguishing Circumference and AreaUnit 3
Lesson 7: Why Pi?
Lesson 12: Capturing Space 

Unit 4: Proportional Relationships and Percentages

Amplify MathDesmos Math 6–A1
Unit 4: PercentagesUnit 4: Proportional Relationships and Percentages
Lesson 1: (Re)Presenting the United States 
Lesson 2: Understanding Percentages and Decimals 
Lesson 3: Percent Increase and DecreaseUnit 4Lesson 4: More or Less
Lesson 4: Determining 100%Unit 4Lesson 6: 100% (Print available)
Lesson 5: Determining Percent ChangeUnit 4Lesson 7: Percent Machines
Lesson 6: Percent Increase and Decrease With EquationsUnit 4Lesson 5: All the Equations
Lesson 7: Using Equations to Solve Percent ProblemsUnit 4Lesson 5: All the Equations
Sub-Unit 2: Applying Percentages 
Lesson 8: Tax and TipUnit 4
Lesson 8: Tax and Tip
Lesson 9: Minimum Wage (Print available)
Lesson 10: Cost of College (Print available)
Lesson 11: Bookcase Builder
Lesson 12: Posing Percent Problems
Lesson 9: Percent ContextsUnit 4
Lesson 8: Tax and Tip
Lesson 9: Minimum Wage (Print available)
Lesson 10: Cost of College (Print available)
Lesson 11: Bookcase Builder
Lesson 12: Posing Percent Problems
Lesson 10: Determining the PercentageUnit 4
Lesson 4: More and Less
Lesson 11: Measurement ErrorUnit 4
Lesson 11: Bookcase Builder
Lesson 12: Error IntervalsUnit 4
Lesson 11: Bookcase Builder
Lesson 13: Writing Better Headlines 

Unit 5: Rational Number Arithmetic

Amplify MathDesmos Math 6–A1
Unit 5: Rational Number ArithmeticUnit 5: Rational Number Artithmetics
Lesson 1: Target: Zero 
Sub-Unit 1: Adding and Subtracting Rational Numbers 
Lesson 2: Interpreting Negative Numbers
Lesson 3: Changing TemperaturesUnit 5
Lesson 2: More Floats and Anchors
Lesson 3: Bumpers
Lesson 4: Draw Your Own (Print available)
Lesson 4: Adding Rational Numbers 
Lesson 5: Money and Debts 
Lesson 6: Representing SubtractionUnit 5
Lesson 5: Number Puzzles
Lesson 7: Subtracting Rational Numbers (Part 1)Unit 5
Lesson 3: Bumpers
Lesson 4: Draw Your Own (Print available)
Lesson 5: Number Puzzles
Lesson 10: Integer Puzzles
Lesson 11: Changing Temperatures
Lesson 13: Solar Panels and More (Print available)
Lesson 8: Subtracting Rational Numbers (Part 2)Unit 5
Lesson 3: Bumpers
Lesson 4: Draw Your Own (Print available)
Lesson 5: Number Puzzles
Lesson 10: Integer Puzzles
Lesson 11: Changing Temperatures
Lesson 13: Solar Panels and More (Print available)
Lesson 9: Adding and Subtracting Rational NumbersUnit 5
Lesson 3: Bumpers
Lesson 4: Draw Your Own (Print available)
Lesson 5: Number Puzzles
Lesson 10: Integer Puzzles
Lesson 11: Changing Temperatures
Lesson 13: Solar Panels and More (Print available)Practice Day 1 (Print available)
Sub-Unit 2: Multiplying and Dividing Rational Numbers 
Lesson 10: Position, Speed, and TimeUnit 5
Lesson 7: Back in Time
Lesson 11: Multiplying Rational NumbersUnit 5
Lesson 7: Back in Time
Lesson 12: Multiply!Unit 5
Lesson 7: Back in Time
Lesson 13: Dividing Rational NumbersUnit 5
Lesson 7: Speeding Turtles
Lesson 14: Negative Rates 
Sub-Unit 3: Four Operations with Rational Numbers 
Lesson 15: Expressions with Rational NumbersUnit 5
Lesson 9: Expressions (Print available)
Lesson 16: Say It With Decimals 
Lesson 17: Solving Problems with Rational NumbersLesson 11: Changing Temperatures
Lesson 12: Arctic Ice Sea (Print available)
Lesson 13: Solar Panels and More (Print available)
Lesson 18: Solving Equations With Rational Numbers 
Lesson 19: Representing Contexts With Equations 
Lesson 20: Summiting Everest 

Unit 6: Expressions, Equations, and Inequalities

Amplify MathDesmos Math 6–A1
Unit 6: Expressions, Equations, and InequalitiesUnit 2: Introducing Proportional Relationships
Unit 4: Proportional Relationships and Percentages
Unit 6: Expressions, Equations, and Inequalities
Lesson 1: Keeping the Balance 
Lesson 2: Balanced and UnbalancedUnit 6
Lesson 1: Toothpicks and Tiles
Lesson 2: Balanced and UnbalancedUnit 6
Lesson 1: Toothpicks and Tiles
Lesson 3: Reasoning About Solving Equations (Part 1)Unit 6
Lesson 2: Smudged Receipts
Lesson 4: Reasoning About Solving Equations (Part 2)Unit 6
Lesson 2: Smudged Receipts
Lesson 3: Equations
Lesson 4: Seeing Structure (Print available)
Lesson 5: Dealing with Negative NumbersUnit 6
Lesson 2: Smudged Receipts
Lesson 3: Equations
Lesson 4: Seeing Structure (Print available)
Lesson 5: Dealing with Negative NumbersUnit 6
Lesson 8: Factoring and Expanding (Print available)
Lesson 16: Shira the Sheep
Lesson 6: Two Ways to Solve One EquationUnit 6
Lesson 4: Seeing Struction (Print available)
Lesson 7: Practice Solving EquationsUnit 6
Lesson 2: Smudged Receipts
Lesson 3: Equations
Lesson 4: Seeing Structure (Print available)
Sub-Unit 2: Solving Real-World Problems Using Two-Step Equations 
Lesson 8: Reasoning With Tape DiagramsUnit 6
Lesson 2: Smudged Receipts
Lesson 9: Reasoning About Equations and Tape Diagrams (Part 1)Unit 6
Lesson 2: Smudged Receipts
Lesson 10: Reasoning About Equations and Tape Diagrams (Part 2)Unit 6
Lesson 2: Smudged Receipts
Lesson 11: Using Equations to Solve ProblemsUnit 6
Lesson 2: Smudged Receipts
Lesson 3: Equations
Lesson 4: Seeing Structure (Print available) 
Lesson 12: Solving Percent Problems in New WaysUnit 6
Lesson 4: Seeing Structure (Print available)

Unit 4
Lesson 7: Percent MachinesPractice Day 1 (Print available)
Practice Day 2 (Print available)
Sub-Unit 3: Inequalities 
Lesson 13: Reintroducing InequalitiesUnit 6
Lesson 1: Toothpicks and Tiles
Lesson 14: Solving InequalitiesUnit 6
Lesson 5: Balancing Moves
Lesson 6: Balancing Equations
Lesson 13: I Saw the Signs
Lesson 15: Finding Solutions to Inequalities in ContextUnit 6
Lesson 13: I Saw the Signs
Practice Day 1 (Print available)
Lesson 16: Efficiently Solving InequalitiesUnit 6
Lesson 10: Collect the Squares
Lesson 17: Interpreting InequalitiesUnit 6
Lesson 13: I Saw the Signs
Lesson 14: Unbalanced Hangers
Lesson 15: Budgeting (Print available)
Lesson 18: Modeling With Inequalities 
Sub-Unit 4: Equivalent Expressions 
Lesson 19: Subtraction in Equivalent Expressions 

Unit 7: Angles, Triangles, and Prisms

Amplify MathDesmos Math 6–A1
Unit 7: Angles, Triangles, and PrismsUnit 7: Angles, Triangles, and Prisms
Lesson 1: Shaping Up 
Sub-Unit 1: Angle Relationships 
Lesson 2: Relationships of AnglesUnit 7
Lesson 1: Pinwheels
Lesson 2: Friendly Angles
Lesson 3: Angle Diagrams
Lesson 3: Supplementary and Complementary Angles (Part 1) 
Lesson 4: Supplementary and Complementary Angles (Part 2) 
Lesson 5: Vertical AnglesUnit 7
Lesson 2: Friendly Angles
Lesson 3: Angle Diagrams
Lesson 4: Missing Measures (Print available) [Free lesson]
Lesson 6: Using Equations to Solve for Unknown AnglesUnit 7
Lesson 3: Angle Diagrams
Lesson 4: Missing Measures (Print available) [Free lesson]
Lesson 7: Like Clockwork 
Sub-Unit 2: Drawing Polygons with Given Conditions 
Lesson 8: Building Polygons (Part 1)Unit 7
Lesson 6: Is It Enough?
Lesson 9: Building Polygons (Part 2)Unit 7
Lesson 6: Is It Enough?
Lesson 10: Triangles with Three Common MeasuresUnit 7
Lesson 13: Popcorn Possibilities
Lesson 11: Drawing Triangles (Part 1)Unit 7
Lesson 5: Can You Build It? [Free lesson]
Lesson 6: Is It Enough?
Lesson 7: More Than One
Lesson 8: Can You Draw It? (Print available)
Practice Day 1 (Print available)
Lesson 12: Drawing Triangles (Part 2)Unit 7
Lesson 5: Can You Build It? [Free lesson]
Lesson 6: Is It Enough?
Lesson 7: More Than One
Lesson 8: Can You Draw It? (Print available)
Practice Day 1 (Print available)
Sub-Unit 3: Solid Geometry
Lesson 13: Slicing SolidsUnit 7
Lesson 9: Slicing Solids
Lesson 14: Volume of Right PrismsUnit 7
Lesson 10: Simple Prisms
Lesson 15: Decomposing Bases for AreasUnit 7
Lesson 11: More Complicated Prisms
Lesson 16: Surface Area of Right PrismsUnit 7
Lesson 10: Simple Prisms
Lesson 11: More Complicated Prisms
Lesson 12: Surface Area Strategies (Print available)
Lesson 17: Distinguishing Volume and Surface Area
Lesson 18: Applying Volume and Surface AreaUnit 7
Lesson 13: Popcorn Possibilities

Unit 8: Probability and Sampling

Amplify MathDesmos Math 6–A1
Unit 8: Probability and SamplingUnit 8: Probability and Sampling
Lesson 1: The Invention of Fairness 
Lesson 2: Chance Experiments 
Lesson 3: What are Probabilities?Unit 8
Lesson 1: How Likely? (Print available)
Lesson 2: Prob-bear-bilities [Free lesson
Lesson 3: Mystery Bag
Lesson 4: Estimating Probabilities Through Repeated ExperimentsUnit 8
Lesson 4: Spin Class
Lesson 5: Is It Fair?
Lesson 6: Fair Games
Lesson 5: Code Breaking (Part 1)
Lesson 6: Code Breaking (Part 2)
Sub-Unit 2: Probabilities of Multi-Step Events
Lesson 7: Keeping Track of All Possible OutcomesUnit 8
Lesson 4: Spin Class
Lesson 5: Is it Fair?
Lesson 6: Fair Games
Lesson 8: Experiments With Multi-Step Events  
Lesson 9: Simulating Multi-Step Events 
Lesson 10: Designing Simulations 
Sub-Unit 3:Sampling
Lesson 11: Comparing Two PopulationsUnit 8
Lesson 10: Crab Island
Lesson 11: Headlines
Lesson 12: Larger PopulationsUnit 8
Lesson 10: Crab Island
Lesson 11: Headlines
Lesson 13: What Makes a Good Sample?Unit 8
Lesson 10: Crab Island
Lesson 11: Headlines
Lesson 14: Sampling in a Fair WayUnit 8
Lesson 10: Crab Island
Lesson 11: Headlines
Lesson 15: Estimating Population Measures of CenterUnit 8
Lesson 9: Car, Bike, or Train?
Lesson 10: Crab Island
Lesson 11: Headlines
Lesson 12: Flower Power
Lesson 16: Estimating Population ProportionsUnit 8
Lesson 9: Car, Bike, or Train?
Lesson 10: Crab Island
Lesson 11: Headlines
Lesson 12: Flower Power
Lesson 17: Presentation of Findings 

Grade 8

Unit 1: Rigid Transformations and Congruence

Amplify MathDesmos Math 6–A1
Unit 1: Rigid Transformations and CongruenceUnit 1: Rigid Transformations and Congruence
Unit 3: Proportional and Linear Relationships
Lesson 1: Tessellations 
Sub-Unit 1: Rigid Transformations 
Lesson 2: Moving in the PlaneUnit 1
Lesson 1: Transformers
Lesson 3: Symmetry and Reflection 
Lesson 4: Grid MovesUnit 1
Lesson 3: Transformation Golf
Lesson 4: Moving Day (Print available)
Lesson 5: Getting Coordinated

Unit 3
Lesson 6: Translations
Lesson 5: Making the MovesUnit 1
Lesson 1: Transformers
Lesson 2: Spinning, Flipping, Sliding
Lesson 4: Moving Day (Print available)
Lesson 5: Getting Coordinated
Lesson 6: Coordinate Moves (Part 1)Unit 1
Lesson 4: Moving Day (Print available)
Lesson 5: Getting Coordinated
Lesson 7: Coordinate Moves (Part 2)Unit 1
Lesson 4: Moving Day (Print available)
Lesson 5: Getting Coordinated
Lesson 6: Describing TransformationsUnit 1
Lesson 5: Getting Coordinated
Lesson 6: Connecting the Dots
Sub-Unit 2: Rigid Transformations and Congruence 
Lesson 9: No Bending or StretchingUnit 1
Lesson 7: No Bending, No Stretching
Lesson 10: What is the Same?Unit 1
Lesson 7: Are They the Same?
Lesson 9: Are They Congruent?
Lesson 11: Congruent PolygonsUnit 1
Lesson 7: Are They the Same?
Lesson 9: Are They Congruent?
Sub-Unit 4: Angles in a Triangle 
Lesson 13: Line Moves 
Lesson 14: Rotation Patterns 
Lesson 15: Alternate Interior AnglesUnit 1 
Lesson 11: Tearing It Up (Print available)
Lesson 16: Adding the Angles in a TriangleUnit 1
Lesson 11: Tearing It Up (Print available)
Lesson 17: Parallel Lines and the Angles in a TriangleUnit 1 
Lesson 10: Transforming Angles
Lesson 18: Creating a Border Pattern Using Transformations 

Unit 2: Dilations, Similarity, and Introducing Slope

Amplify MathDesmos Math 6–A1
Unit 2: Dilations and SimilarityUnit 2: Dilations and Similarity
Lesson 1: Projecting and Scaling 
Sub-Unit 1: Dilations
Lesson 2: Circular GridUnit 2
Lesson 1: Sketchy Dilations
Lesson 2: Dilation Mini Golf
Lesson 3: Match My Dilation
Lesson 4: Dilations on a Plane
Lesson 3: Dilations on a Plane 
Lesson 4: Dilations on a Square GridUnit 2
Lesson 1: Sketchy Dilations
Lesson 2: Dilation Mini Golf
Lesson 3: Match My Dilation
Lesson 4: Dilations on a Plane
Lesson 5: Dilations with CoordinatesUnit 2
Lesson 4: Dilations on a Plane
Sub-Unit 2: Similiarity
Lesson 6: SimilarityUnit 2
Lesson 5: Transformations Golf with Dilations
Lesson 6: Social Scavenger Hunt (Print available)
Lesson 7: Similar PolygonsUnit 2
Lesson 6: Social Scavenger Hunt (Print available)
Lesson 8: Similar TrianglesUnit 2
Lesson 7: Are Angles Enough?
Lesson 8: Shadows
Lesson 9: Ratios of Side Lengths in Similar Triangles
Lesson 12: Optical Illusions 

Unit 3: Linear Relationships

Amplify MathDesmos Math 6–A1
Unit 3: Proportional and Linear RelationshipsUnit 3: Proportional and Linear Relationships
Unit 4: Linear Equations and Linear Systems
Unit 5: Functions and Volume
Lesson 1: Visual Patterns 
Sub-Unit 1: Proportional Relationships 
Lesson 2: Proportional Relationships 
Lesson 3: Understanding Proportional RelationshipsUnit 3
Lesson 1: Turtle Time Trials
Lesson 4: Graphs of Proportional RelationshipsUnit 3
Lesson 1: Turtle Time Trials
Lesson 2: Water Tank 

Unit 5
Lesson 4: Window Frames
Lesson 5: Representing Proportional RelationshipsUnit 3
Lesson 1: Turtle Time Trials 
Unit 5
Lesson 4: Window Frames
Lesson 6: Graphing Stories
Lesson 7: Feel the Burn (Print available)
Lesson 8: Charge! (Print available)
Lesson 6: Comparing Proportional RelationshipsUnit 3
Lesson 3: Posters
Sub-Unit 2: Linear Relationships
Lesson 7: Introduction to Linear RelationshipsUnit 3
Lesson 1: Turtle Time Trials
Lesson 4: Stacking Cups

Unit 5
Lesson 6: Graphing Stories
Lesson 7: Feel the Burn (Print available)
Lesson 8: Charge! (Print available)
Lesson 8: Comparing Linear Relationships 
Lesson 9: More Linear RelationshipsUnit 5
Lesson 6: Graphing Stories
Lesson 7: Feel the Burn (Print available)
Lesson 8: Charge! (Print available)
Lesson 10: Representations of Linear RelationshipsUnit 3
Lesson 5: Flags
Lesson 6: Graphing Stories
Lesson 7: Feel the Burn (Print available)
Lesson 8: Charge! (Print available)
Lesson 11: Writing Equations for Lines Using Two Points 
Lesson 12: Translating mx + bUnit 3
Lesson 3: Posters
Lesson 6: Translations
Lesson 13: Slopes Don’t Have to be PositiveUnit 3
Lesson 5: Flags
Lesson 6: Translations
Lesson 7: Water Cooler
Lesson 8: Landing Planes
Lesson 10: Calculating SlopeUnit 3
Lesson 7: Water Cooler
Lesson 8: Landing Planes
Lesson 14: Writing Equations for Lines Using Two Points, Revisited 
Lesson 11: Equations of All Kinds of LinesUnit 3
Lesson 3: Posters
Lesson 4: Stacking Cups
Lesson 5: Flags
Lesson 6: Translations
Sub-Unit 3: Linear Equations 
Lesson 16: Solutions to Linear EquationsUnit 3
Lesson 3: Posters
Lesson 6: Translations
Lesson 10: Solutions

 Unit 4
Lesson 3: Balanced Moves
Lesson 4: More Balanced Moves (Print available)
Lesson 17: More Solutions to Linear EquationsUnit 3 
Lesson 4: Stacking Cups
Lesson 5: Flags
Lesson 6: Translations
Lesson 7: Water Cooler
Lesson 10: Solutions
Lesson 18: Coordinating Linear Relationships 
Lesson 19: Rogue Planes 

Unit 4: Linear Equations and Linear Systems

Amplify MathDesmos Math 6–A1
Unit 4: Linear Equations and Systems of Linear EquationsUnit 4: Linear Equations and Systems of Linear Equations
Lesson 1: Number PuzzlesUnit 4
Lesson 1: Number machines
Sub-Unit 1: Linear Equations in One Variable 
Lesson 2: Writing Expressions and Equations
Lesson 3: Keeping the BalanceUnit 4
Lesson 2: Keep It Balanced
Lesson 4: Balanced Moves (Part 1)Unit 4
Lesson 3: Balanced Moves
Lesson 5: Balanced Moves (Part 2)Unit 4
Lesson 4: More Balanced Moves (Print available)
Lesson 6: Solving Any Linear EquationsUnit 4
Lesson 4: More Balanced Moves (Print available)
Lesson 5: Equation Roundtable (Print available)
Lesson 6: Strategic Solving (Print available)
Lesson 7: How Many Solutions? (Part 1)Unit 4
Lesson 5: Equation Roundtable (Print available)
Lesson 8: How Many Solutions? (Part 2)Unit 4
Lesson 5: Equation Roundtable (Print available)
Lesson 9: Strategic Solving 
Lesson 10: When Are They the SameUnit 4
Lesson 8: When Are They the Same?
Sub-Unit 2: Systems of Linear Equations
Lesson 11: On or Off the Line?Unit 4
Lesson 9: On or Off the Line?
Lesson 12: On Both of the LinesUnit 4
Lesson 10: On Both Lines
Lesson 13: Systems of Linear EquationsUnit 4
Lesson 11: Make Them Balance
Lesson 14: Solving Systems of Equations (Part 1)Unit 4
Lesson 14: All, Some, or None? Part 2
Lesson 15: Solving Systems of Equations (Part 2)Unit 4
Lesson 12: All, Some, or None? Part 2
Lesson 16: Writing Systems of Linear EquationsUnit 4
Lesson 14: Strategic Solving, Part 2 (Print available)
Lesson 17: Pay Gaps 

Unit 5: Functions and Volume

Amplify MathDesmos Math 6–A1
Unit 5: Functions and VolumeUnit 2: Dilations, Similarity, and Introducing Slope
Unit 3:
Proportional and Linear Relationships
Unit 5:
Functions and Volume
Lesson 1: Pick a Pitch 
Sub-Unit 1: Representing and Interpreting Functions 
Lesson 2: Introduction to FunctionsUnit 5
Lesson 2: Guess My Rule
Lesson 3: Equations of FunctionsUnit 3
Lesson 4: Window Frames
Lesson 4: Graphs of Functions (Part 1)Unit 5
Lesson 3: Function or Not?
Lesson 5: Graphs of Functions (Part 2)Unit 5
Lesson 5: The Tortoise and the Hare
Lesson 6: Graphs of Functions (Part 3)Unit 5
Lesson 6: Graphing Stories
Lesson 7: Connecting Representations of FunctionsUnit 5
Lesson 7: Feel the Burn (Print available)Lesson 8: Charge! (Print available)
Lesson 8: Comparing Linear Functions 
Lesson 9: Modeling with Linear Functions 
Lesson 10: Piecewise Linear FunctionsUnit 5
Lesson 9: Piecing It Together
Sub-Unit 2: Cylinder, Cones, and Spheres 
Lesson 11: Filling Containers 
Lesson 12: The Volume of a CylinderUnit 5
Lesson 10: Volume LabLesson 11: Cylinders
Lesson 12: Scaling Cylinders
Lesson 13: Determining Dimensions of CylindersUnit 5
Lesson 14: Missing Dimensions (Print available)
Lesson 14: The Volume of a ConeUnit 5
Lesson 10: Volume LabLesson 13: Cones
Lesson 15: Determining Dimensions of ConesUnit 5
Lesson 12: Scaling Cylinders
Lesson 13: Cones
Lesson 14: Missing Dimensions (Print available)
Lesson 16: Estimating a Hemisphere 
Lesson 17: The Volume of a SphereUnit 5
Lesson 15: Spheres
Lesson 18: Cylinders, Cones and SpheresUnit 5
Lesson 15: Practice Day 2 (Print available)
Lesson 19: Scaling One Dimension 
Lesson 20: Scaling Two Dimensions 
Lesson 21: Packing Spheres 

Unit 6: Exponents and Scientific Notation

Amplify MathDesmos Math 6–A1
Unit 6: Exponents and Scientific NotationUnit 7: Exponents and Scienctific Notation
Lesson 1: Create a Sierpinski Triangle 
Sub-Unit 1: Exponent Rules 
Lesson 2: Reviewing ExponentsUnit 7
 Lesson 1: Circles
Lesson 2: Combining Exponents
Lesson 3: Multiplying PowersUnit 7 
Lesson 3: Power Pairs (Print available)
Lesson 4: Rewriting Powers
Lesson 4: Dividing PowersUnit 7 
Lesson 3: Power Pairs (Print available)
Lesson 4: Rewriting Powers
Lesson 5: Negative ExponentsUnit 7 
Lesson 5: Zero and Negative Exponents
Lesson 6: Powers of PowersUnit 7 
Lesson 3: Power Pairs (Print available)
Lesson 7: Different Bases, Same Exponent 
Lesson 8: Practice with Rational BasesUnit 7
Practice Day 1 (Print available)
Sub-Unit 2: Scientific Notation 
Lesson 9: Representing Large Numbers on the Number LineUnit 7
Lesson 8: Point Zapper
Lesson 10: Representing Small Numbers on the Number LineUnit 7
Lesson 8: Point Zapper
Lesson 11: Applications of Arthithmetic with Powers of 10Unit 7
Lesson 8: Point Zapper
Lesson 9: Use Your Powers
Lesson 12: Definition of Scientific NotationUnit 7
Lesson 10: Solar System
Lesson 11: Balance the Scale
Lesson 13: Star Power
Lesson 13: Multiplying, Dividing, and Estimating with Scientific NotationUnit 7
Lesson 11: Balance the Scale
Lesson 13: Star Power
Lesson 14: Adding and Subtracting with Scientific NotationUnit 7
Lesson 11: Balance the Scale
Lesson 12: City Lights
Lesson 13: Star Power
Lesson 15: Is a Smartphone Smart Enough to Go to the Moon? 

Unit 7: Irrationals and the Pythagorean Theorem

Practice Day 2 (Print available)

Amplify MathDesmos Math 6–A1
Unit 7: Irrationals and the Pythagorean TheoremUnit 8: The Pythagorean Theorem and Irrational Numbers
Lesson 1: Sliced Bread
Sub-Unit 1: Rational and Irrational Numbers
Lesson 2: The Square RootUnit 8
Lesson 2: From Squares to Roots
Lesson 3: The Ares of Squares and Their Side LengthsUnit 8
Lesson 1: Tilted Squares
Lesson 3: Between Squares
Lesson 4: Estimating Square RootsUnit 8
Lesson 3: Between Squares
Lesson 4: Root Down
Lesson 5: The Cube RootUnit 8
Lesson 5: Filling Cubes
Lesson 6: Rational and Irrational NumbersUnit 8
Lesson 14: Hit the Target
Lesson 7: Decimal Representations of Rational NumbersUnit 8
Lesson 12: Fractions to Decimals
Lesson 8: Converting Repeating Decimals Into FractionsUnit 8
Lesson 13: Decimals to Fractions
Sub-Unit 2: The Pythagorean Theorem
Lesson 9: Observing the Pythagorean TheoremUnit 8
Lesson 6: The Pythagorean Theorem
Lesson 10: Proving the Pythagorean TheoremUnit 8
Lesson 7: Pictures to Prove It
Lesson 11: Determining Unknown Side LengthsUnit 8
Lesson 8: Triangle-Tracing Turtle
Lesson 12: Converse of the Pythagorean TheoremUnit 8
Lesson 9: Make it Right
Lesson 13: Distances on the Coordinate Plane (Part 1)Unit 8
Lesson 11: Pond Hopper
Lesson 13: Distances on the Coordinate Plane (Part 1)Unit 8
Lesson 11: Pond Hopper
Lesson 14: Distances on the Coordinate Plane (Part 2)Unit 8
Lesson 11: Pond Hopper
Lesson 15: Applications of the Pythagorean TheoremUnit 8
Lesson 8: Triangle-Tracing Turtle
Lesson 10: Taco Truck
Lesson 16: Pythagorean Triples

Unit 8: Pythagorean Theorem and Irrational Numbers

Amplify MathDesmos Math 6–A1
Unit 8: Associations in DataUnit 6: Associations in Data
Lesson 1: Creating a Scatter PlotUnit 6
Lesson 1: Click Battle
Sub-Unit 1: Associations in Data
Lesson 2: Interpreting Points on a Scatter PlotUnit 6
Lesson 3: Robots
Lesson 3: Observing Patterns in a Scatter PlotUnit 6
Lesson 7: Scatter Plot City
Lesson 4: Fitting a Line to DataUnit 6
Lesson 4: Dapper Cats
Lesson 5: Fit Fights
Lesson 5: Using a Linear ModelUnit 6
Lesson 6: Interpreting Slopes
Lesson 6: Interpreting Slope and y-interceptUnit 6
Lesson 6: Interpreting Slopes
Lesson 7: Analyzing Bivariate DataUnit 6
Lesson 8: Animal Brains
Lesson 8: Looking for AssociationsUnit 6
Lesson 9: Tasty Fruit
Lesson 9: Using Data Displays to Find AssociationsUnit 6
Lesson 10: Finding Associations
Lesson 11: Federal Budgets

Grade K

Unit 1: Math Is…

Lesson 1-2: Math is Exploring and ThinkingConnecting Cubes

Unit 4: Sort, Classify and Count Objects

Lesson 4-1: Alike and DifferentSo Much Sorting
Lesson 4-2: Sort Objects into GroupsSo Much Sorting
Lesson 4-3: Count Objects in GroupsWhat’s that Shape called?
Another Shape

Unit 5: 2-Dimensional Shapes

Lesson 5-1: TrianglesWhat’s that Shape called?
Lesson 5-2: Squares and RectanglesAnother Shape
Lesson 5-4: CirclesWhat’s that Shape called?

Unit 6: Understand Addition

Lesson 6-1: Represent and Solve Add To ProblemsHow Many Objects?
Lesson 6-2: Represent and Solve More Add to ProblemsWhat does it mean to add?
Lesson 6-3: Represent and Solve Put Together ProblemsWhat does it mean to add?

Unit 7: Understand Subtraction

Lesson 7-1: Represent Take Apart ProblemsWhat does it mean to subtract?
Lesson 7-2: Represent and Take From ProblemsWhat does it mean to subtract?

Unit 8: Addition and Subtraction Strategies

Lesson 8-4: Ways to Decompose 6 and 7Harry Explores the Ocean
Lesson 8-6: Ways to Decompose 8 and 9Harry Explores the Ocean
Lesson 8-7: Ways to Make 10Harry Explores Space
Lesson 8-8: Ways to Decompose 10Showing What We Know About 10

Unit 13: Analyze, Compare and Compose Shapes

Lesson 13-1: Compare and Contrast 2-Dimensional ShapesWhat’s that Shape called?

Unit 14: Compare Measurable Attributes

Lesson 14-1: Describe Attributes of ObjectsAnother Shape

Grade 1

Unit 2: Number Patterns

Lesson 2-5: Patterns when Representing Objects in a GroupMeeting Yara

Unit 3: Place Value

Lesson 3-1: Numbers 11 to 19Same Number, Different Ways
Lesson 3-2: Understand 10sBoris’s Thimbles
Lesson 3-4: Represent 2-DigitsSame Number, Different Ways
Lesson 3-5: Represent 2-Digits in Different WaysSame Number, Different Ways

Unit 4: Addition within 20: Facts and Strategies

Lesson 4-1: Relate Counting to AdditionInvestigate: Game Points
Meeting Yara
Lesson 4-5: Make a Ten to AddMaking 10
Lesson 4-9: Find an Unknown Number in an Addition EquationA Community Working Together
Lesson 4-10: Understand The Equal SignKitten Coaster
Lesson 4-11: True Addition EquationsKitten Coaster
Replanting Huli

Unit 5: Subtraction within 20: Facts and Strategies

Lesson 5-1: Relate Counting to SubtractionPacking a Picnic

Unit 7: Meanings of Addition

Lesson 7-1: Represent and Solve Add to ProblemsThe Kalo Plants
Tutu’s Garden in Maui
Lesson 7-2: Represent and Solve More Add to ProblemsHelping Others

Unit 8: Meanings of Subtraction

Lesson 8-1: Represent and Solve Take From ProblemsThe Kalo Plants
Tutu’s Garden in Maui
Lesson 8-2: Represent and Solve More Take From ProblemsHelping Others

Unit 13: Equal Shares

Lesson 13-1: Understand Equal SharesA Bigger Part
Lesson 13-2: Partition Shapes into HalvesFair and Square
Lesson 13-3: Partition Shapes into FourthsFair and Square
Lesson 13-4: Describe the WholeOne of the Parts, All of the Parts
Lesson 13-5: Describe the Halves and Fourths of ShapesOne of the Parts, All of the Parts

Grade 2

Unit 2: Place Value to 1,000

Lesson 2-1: Understand HundredsWhat Makes a Hundred?
Lesson 2-2: Understand 3-digit numbersWhat’s the Value?
Lesson 2-3: Read and Write Numbers to 1000All the Ways!
Lesson 2-4: Decompose 3-digit numbersA New Representation

Unit 3: Patterns within Numbers

Lesson 3-1: Counting PatternsInvestigate: A Mistake in Mom’s Office
Lesson 3-2: Patterns when Skip Counting by 5?What’s that Number?
Lesson 3-3: Patterns when Skip Counting by 10s and 100sLooking for Patterns

Unit 4: Meanings of Addition and Subtraction

Lesson 4-7: Represent and Solve Compare ProblemsAwesome Aquariums

Unit 5: Strategies to Add Fluently Within 100

Lesson 5-9: Add More Than Two NumbersHow Much Money?

Unit 7: Measure and Compare Lengths

Lesson 7-10: Solve Problems using LengthLengths of Jungle Animals

Unit 8: Measurement, Time and Money

Lesson 8-1: Understand the Value of CoinsDiscovering Coins (Part I)
Discovering Coins (Part 2)
Lesson 8-2: Solving Money Problems Using CoinsHow Much Money?

Unit 9: Strategies to Add 3-Digit Numbers

9-2: Represent Addition with 3-Digit NumbersThere’s Something About Berries
9-3: Represent Addition with 3-Digit Numbers With RegroupingBaking with Skunk

Unit 11: Data Analysis

Lesson 11-5: Understand Line PlotsMessy Measurements
Lesson 11-6: Show Data on a Line PlotBracelets and Wristbands

Grade 3

Unit 2: Use Place Value Fluently to Add and Subtract within 1001

Lesson 2-3: Estimate Sums and DifferencesAdding Strategically
Lesson 2-6: Use Partial Sums to AddWhat is an Algorithm
Lesson 2-10: Fluently Add Within 1,000How Would You Solve It?
Determining the Sum of 2 or More Addends

Unit 3: Multiplication and Division

Lesson 3-1: Understand Equal GroupsEqual Groups
Lesson 3-3: Understand the Commutative PropertyArrays of Flavor
Lesson 3-7: Find the UnknownIt’s Chilli In Here!

Unit 4: Use Patterns to Multiply by 0,1, 2, 5 and 11

Lesson 4-6: Solve Problems Using Equal GroupsDivision and Multiplication Equations

Unit 6: Connect Area and Multiplication

Lesson 6-1: Understand AreaTiling Figures
Lesson 6-2: Count Unit Squares to Determine AreaRectangles and Arrays
Unit 2: Lesson 4: Area Hunt

Unit 7: Fractions

Lesson 7-5: Represent Whole Numbers as FractionsCat Crossing
Lesson 7-6: Represent a Greater Than One on a Number LineFractions on the Number Line

Unit 9: Use Multiplication to Divide

Lesson 9-1: Use Multiplication to Solve Division ProblemsRelating Quotients to Familar Products

Unit 12: Measurement and Data

Lesson 12-10: Measure to Halves or Fourths of an InchHow Long Is It?
More Precise Measurements
Lesson 12-11: Show Measurement Data on a Line PlotThe Plot Chickens

Unit 13: Describe and Analyze 2-Dimensional Shapes

Lesson 13-1: Describe and Classify PolygonsPiho’s Shapes
Lesson 13-2: Classify QuadrilateralsRectangles, Squares and Rhombuses

Grade 4

Unit 4: Multiplication as Comparison

Lesson 4-1: Understanding Comparing with MultiplicationRepresenting “Times as Many”
Lesson 4-2: Represent Comparison ProblemsSticker Mania
Lesson 4-3: Solve Comparison Problems Using MultiplicationGoing Swimming

Unit 5: Numbers and Number Patterns

Lesson 5-1: Understand Factors of a NumberHamster Homes
Lesson 5-3: Understand MultiplesFactor or Multiple
Lesson 5-4: Number or Shape PatterrnsHow Does it Grow?
Lesson 5-5: Generate a PatternHow Does it Grow?

Unit 6: Multiplication Strategies with Multi-Digit Numbers

Lesson 6-2: Estimate ProductsA Reasonable Answer
Lesson 6-4: Multiply 2-Digit by 1-Digit FactorsCounting Flowers for Lei
Lesson 6-5: Multiply Multi-Digit 1-Digit FactorsA Lei Making Workshop
Lesson 6-7: Multiply 2-Digit FactorsDouble Decomposition

Unit 9: Addition and Subtractions Meanings and Strategies with Fractions

Lesson 9-2: Represent Adding FractionsPizza Problems
Lesson 9-3: Add Fractions with Like DenominatorsPizza Problems
Lesson 9-4: Represent Subtracting FractionsPizza Problems
Lesson 9-5: Subtract Fractions with Like DenominatorsPizza Problems
Lesson 9-6: Solve Problems Using FractionsPizza Problems

Unit 10: Addition and Subtraction Strategies with Mixed Numbers

Lesson 10-1: Understand Decomposing Mixed NumbersMath Pizzeria

Unit 11: Multiply Fractions by Whole Numbers

Lesson 11-1: Represent Multiplication of a Unit Fraction by a Whole NumberEqual Groups of Fractions

Unit 12: Decimal Fractions

Lesson 12-2: Understand Decimal NotationA New Way to Write Tenths
A New Way to Write Hundredths
Lesson 12-3: Compare DecimalsCan You Compare?

Grade 5

Unit 2: Volume

Lesson 2-2: Use Unit Cubes to Determine VolumePutting It Together
Lesson 2-3: Use Formula to Determine VolumePutting It Together
Lesson 2-4: Determine the Volume of Composite FiguresFigures Made of Prisms

Unit 3: Place Value and Number Relationships

Lesson 3-1: Generalize Place ValuePlace Value Patterns
Lesson 3-4: Compare DecimalsSelling Collectibles
Lesson 3-5: Use Place Value to Round DecimalsWhich Way Down the Mountain?

Unit 5: Multiply Multi-Digit Whole Numbers

Lesson 5-1: Understand Powers and ExponentsMonarch Butterflies
Lesson 5-2: Patterns When Multiplying a Whole Number by Powers of 10All About that Base
Lesson 5-5: Use Partial Products to Multiply Multi-Digit FactorsHow Do They Compare?
Lesson 5-6: Relate Partial Products to an AlgorithmPatrial Products Everywhere
Lesson 5-7: Multiply Multi-Digit Factors FluentlyPatrial Products Everywhere

Unit 6: Multiply Decimals

Lesson 6-1: Patterns when Multiplying Decimals by Powers of 10Powers of 10 Parade

Unit 7: Divide Whole Numbers

Lesson 7-5: Use Partial Quotients to DivideEmptying the Water Tank

Unit 8: Divide Decimals

Lesson 8-1: Division Patterns with Decimals and Patterns of 10Powers of 10 Parade

Unit 10: Multiply Fractions

Lesson 10-3: Represent Multiplication of a Fraction By A FractionMaking Food
Lesson 10-4: Multiply a Fraction By A FractionMaking Food
Lesson 10-5: Determine the Area of Rectanges with Fractional Side LengthsInstalling Turf
Lesson 10-6: Represent Multiplication of Mixed NumbersInstalling Turf
Lesson 10-7: Multiply Mixed NumbersInstalling Turf

Unit 13: Geometry

Lesson 13-2: Plot Ordered Pairs on the Coordinate PlaneBullseye!

Grade 6

Module 1: Ratios and Rates

Reveal MathAmplify Classroom
Lesson 1: Understand ratiosUnit 2
Lesson 1: Pizza Maker
Lesson 2: Tables of Equivalent RatiosUnit 2
Lesson 10: Disaster Preparation
Lesson 4: Compare Ratio RelationshipsUnit 2
Lesson 4: Fruit Lab
Lesson 6: Convert Customary Measurement UnitsUnit 3
Lesson 1: Many Measurements
Lesson 7: Understand Rates and Unit RatesUnit 3
Lesson 6: Soft Serve

Module 2: Fractions, Decimals, and Percents

Lesson 1: Understand PercentsUnit 3
Lesson 9: Lucky Duckies
Lesson 3: Relate Fractions, Decimals, and PercentsUnit 5
Lesson 2: Decimal Diagrams and Algorithms

Module 3: Compute with Multi-Digit Numbers and Fractions

Lesson 1: Divide Multi-Digit Whole NumbersUnit 5
Lesson 13: Movie Time
Lesson 3: Divide Whole Numbers by FractionsUnit 4
Lesson 3: Flour Planner
Lesson 4: Divide Fractions by FractionsUnit 4
Lesson 6: Fill the Gap
Lesson 5: Divide with Whole and Mixed NumbersUnit 4
Lesson 6: Fill the Gap

Module 4: Integers, Rational Numbers, and the Coordinate Plane

Lesson 1: Represent IntegersUnit 7
Lesson 1: Can You Dig It?
Lesson 3: Compare and Order IntegersUnit 7
Lesson 4: Order in the Class

Module 5: Numerical and Algebraic Expressions

Lesson 3: Write Algebraic Expressions
Lesson 4: Evaluate Algebraic Expressions
Unit 6
Lesson 8: Products and Sums
Take Away (coming soon!)
Lesson 6: Use the Distributive PropertyUnit 6
Lesson 8: Products and Sums
Take Away (coming soon!)
Lesson 7: Equivalent Algebraic ExpressionsUnit 6
Lesson 1: Weight for It

Module 6: Relationships in Geometry

Lesson 2: One-Step Addition Equations
Lesson 3: One-Step Subtraction Equations
Unit 6
Lesson 1: Weight for It
Lesson 6: InequalitiesUnit 7
Lesson 7: Tunnel Travels

Module 7: Relationships Between Two Variables

Lesson 4: Multiple RepresentationsUnit 6
Lesson 16: Subway Fares
Take Away (coming soon!)

Module 8: Area

Module 9: Volume and Surface Area

Lesson 2: Surface Area of Rectangular PrismsUnit 1
Lesson 10: Renata’s Stickers

Module 10: Statistical Measures and Displays

Lesson 1: Statistical QuestionsUnit 8
Lesson 3: Minimum Wage
Lesson 2: Dot Plots and HistogramsUnit 8
Lesson 5: The Plot Thickens
Lesson 3: Measures of CenterUnit 8
Lesson 11: Toy Cars
Lesson 7: Interpret Graphical DisplaysUnit 8
Lesson 3: Minimum Wage

Grade 7

Module 1: Proportional Relationships

Reveal MathAmplify Classroom
Lesson 1: Unit Rates Involving Ratios of FractionsUnit 2
Lesson 1: Paint
Lesson 3: Tables of Proportional ReasoningUnit 2
Lesson 1: Paint
Lesson 4: Graphs of Proportional ReasoningUnit 2
Lesson 8: Dino Pops
Lesson 5: Equations of Proportional ReasoningUnit 2
Lesson 6: Two and Two

Module 2: Solve Percent Problems

Lesson 1: Percent of ChangeUnit 4
Lesson 5: Percent Machines
Lesson 12: Posing Percent Problems (coming soon!)
Lesson 3: Tips and MarkupsUnit 4
Lesson 5: Percent Machines
Lesson 4: DiscountsUnit 4
Lesson 5: Percent Machines

Module 3: Operations with Integers

Lesson 1: Add Integers
Lesson 2: Subtract Integers
Unit 5
Lesson 4: Draw Your Own
Lesson 10: Integer Puzzles
Lesson 3: Multiply IntegersUnit 5
Lesson 10: Integer Puzzles
Lesson 5: Apply Integers OperationsUnit 5
Lesson 10: Integer Puzzles

Module 4: Operations with Rational Numbers

Lesson 1: Add Integers
Lesson 2: Subtract Integers
Unit 5
Lesson 4: Draw Your Own
Lesson 10: Integer Puzzles
Lesson 3: Multiply IntegersUnit 5
Lesson 10: Integer Puzzles
Lesson 5: Apply Integers OperationsUnit 5
Lesson 10: Integer Puzzles

Module 5: Simplify Algebraic Expressions

Lesson 2: Add Linear Expressions
Lesson 3: Subtract Linear Expressions
Unit 6
Lesson 10: Collect the Squares
Lesson 4: Solve Inequalities Using Addition or SubtractionUnit 6
Lesson 16: Shira the Sheep

Module 6: Write and Solve Equations

Lesson 1: Write and Solve One-Step EquationsUnit 6
Lesson 16: Shira the Sheep

Module 7: Write and Solve Inequalities

Lesson 6: Wirte and Solve Two-Step InequalitiesUnit 6
Lesson 16: Shira the Sheep

Module 8: Geometric Figures

Lesson 1: Vertical and Adjacent AnglesUnit 7
Lesson 4: Missing Measures
Lesson 2: Complementary and Supplementary AnglesUnit 7
Lesson 2: Friendly Angles
Lesson 3: TrianglesUnit 7
Lesson 5: Can You Build It?
Lesson 4: Scale DrawingsUnit 1
Lesson 1: Scaling Machines
Lesson 7: Will It Fit?

Module 9: Measure Figures

Lesson 1: Circumference of CirclesUnit 3
Lesson 3: Measuring Around
Lesson 2: Area of CirclesUnit 3
Lesson 9: Area Challenges

Module 10: Probability

Lesson 1: Find Likelihoods
Lesson 2: Relative Frequency of Simple Events
Lesson 3: Theoretical Probability of Events
Unit 8
Lesson 1: How Likely?
Lesson 2: Prob-bear-bilities

Module 11: Sampling and Statistics

Lesson 1: Biased and Unbiased SamplesUnit 8
Lesson 10: Crab Island
Lesson 2: Make Predictions
Lesson 3: Generate Multiple Samples
Unit 8 
Lesson 10: Crab Island
Lesson 4: Compare Two PopulationsUnit 8
Lesson 10: Crab Island

Grade 8

Module 1: Exponents and Scientific Notation

Reveal MathAmplify Classroom
Lesson 1: Powers and ExponentsUnit 7 
Lesson 1: Circles
Lesson 2: Multiply and Divide MonomialsUnit 7 
Lesson 3: Power Pairs
Lesson 3: Power of MonomialsUnit 7 
Lesson 3: Power Pairs
Lesson 5: Scientific NotationUnit 7 
Lesson 9: Specific and Scientific
Lesson 11: Balance the Scale
Lesson 6: Compute with Scientific NotationUnit 7 
Lesson 9: Specific and Scientific
Lesson 11: Balance the Scale

Module 2: Real Numbers

Lesson 2: RootsUnit 8
Lesson 4: Root Down

Module 3: Solve Equations with Variables on Each Side

Lesson 1: Solve Equations with Variables on Each SideUnit 4
Lesson 5: Equation Roundtable
Lesson 2: Write and Solve Equations with Variables on Each SideUnit 4
Lesson 5: Equation Roundtable
Lesson 5: Determine the Number of Solutions

Module 4: Linear Relationships and Slope

Lesson 1: Proportional Relationships and SlopeUnit 3
Lesson 1: Turtle Time Trials
Lesson 2: Slope of a LineUnit 3
Lesson 4: Flags
Lesson 5: Slope-Intercept FormUnit 4
Lesson 5: Equation Roundtable
Lesson 6: Graph Linear EquationsUnit 3
Lesson 4: Flags
Unit 5
Lesson 5: The Tortoise and the Hare

Module 5: Functions

Lesson 1: Identify FunctionsUnit 5
Lesson 1: Turtle Crossing
Lesson 2: Guess My Rule
Lesson 6: Qualitative GraphsUnit 5
Lesson 5: The Tortoise and the Hare

Module 6: Systems of Linear Equations

Lesson 1: Solve Systems of Equations by GraphingUnit 4 
Lesson 11: Make Them Balance

Module 7: Triangles and the Pythagorean Theorem

Lesson 2: Angle Relationships and TrianglesUnit 1 
Lesson 12: Puzzling It Out

Module 8: Transformations

Lesson 1: Translations
Lesson 2: Reflections
Lesson 3: Rotations
Unit 1
Lesson 1: Transformers
Lesson 2: Spinning, Flipping, Sliding
Lesson 4: Moving Day
Lesson 4: DilationsUnit 2
Lesson 1: Sketchy Dilations
Lesson 2: Dilation Mini Golf

Module 9: Congruence and Similarity

Lesson 3: Similarity and TransformationsUnit 2
Lesson 6: Social Scavenger Hunt

Module 10: Volume

Lesson 1: Volume of CylindersUnit 5
Lesson 11: Cylinders
Lesson 2: Volume of ConesUnit 5
Lesson 13: Cones

Module 11: Scatter Plots and Two-Way Tables

Lesson 1: Scatter PlotsUnit 6 
Lesson 3: Robots
Lesson 2: Draw Lines of FitUnit 6 
Lesson 4: Dapper Cats
Lesson 6: Find the Fit
Lesson 4: Two-Way TablesUnit 6
Lesson 11: Finding Associations
Lesson 5: Associations in Two-Way TablesUnit 6
Lesson 11: Finding Associations

Disclaimer

This document is for informational purposes only; references to third-party programs do not imply endorsement or affiliation, and all trademarks are the property of their respective owners.

Families and caregivers, welcome to Amplify Desmos Math California K–5!

Welcome to the Amplify Desmos Math California K–5 Caregiver Hub. We hope your student enjoys exploring math, working with friends to solve problems, and learning new and interesting concepts. And we hope you enjoy the math journey with them! Below are some suggestions and resources for how you can support their learning at home.

Learn more about Amplify Desmos Math California.

Para la versión en español, haga clic aquí.

Three children are engaging in a math activity with a grid and orange markers. One child holds a "9-3" card. The background includes beach elements and abstract math symbols.

Caregiver Unit Resources

For every unit of the program, we’ve created a Caregiver Resource that provides a summary of key concepts, plus a problem from the lesson practice set you can work through with your student. You’ll find a Caregiver Resource for each unit, in both English and Spanish.

Unit 1: Math in Our World

Unit 2: Numbers 1–10

Unit 3: Flat Shapes All Around Us

Unit 4: Understanding Addition and Subtraction

Unit 5: Make and Break Apart Numbers Within 10

Unit 6: Numbers 0–20

Unit 7: Solid Shapes All Around Us

Unit 1: Adding, Subtracting, and Working With Data

Unit 2: Addition and Subtraction Story Problems

Unit 3: Adding and Subtracting Within 20

Unit 4: Numbers to 99

Unit 5: Adding Within 100

Unit 6: Measuring Lengths of Up to 120 Length Units

Unit 7: Geometry and Time

Unit 1: Working With Data and Solving Comparison Problems

Unit 2: Adding and Subtracting Within 100

Unit 3: Measuring Length

Unit 4: Addition and Subtraction on the Number Line

Unit 5: Numbers to 1,000

Unit 6: Geometry and Time

Unit 7: Adding and Subtracting Within 1,000

Unit 8: Equal Groups

Unit 1: Introducing Multiplication

Unit 2: Area and Multiplication

Unit 3: Wrapping Up Addition and Subtraction Within 1,000

Unit 4: Relating Multiplication to Division

Unit 5: Fractions as Numbers

Unit 6: Measuring Length, Time, Liquid Volume, and Weight

Unit 7: Two-Dimensional Shapes and Perimeter

Unit 1: Factors and Multiples

Unit 2: Fraction Equivalence and Comparison

Unit 3: Extending Operations to Fractions

Unit 4: From Hundredths to Hundred Thousands

Unit 5: Multiplicative Comparison and Measurement

Unit 6: Multiplying and Dividing Multi-Digit Numbers

Unit 7: Angles and Properties of Shapes

Unit 1: Volume

Unit 2: Fractions as Quotients and Fraction Multiplication

Unit 3: Multiplying and Dividing Fractions

Unit 4: Multiplication and Division With Multi-Digit Whole Numbers

Unit 5: Place Value Patterns and Decimal Operations

Unit 6: More Decimal and Fraction Operations

Unit 7: Shapes on the Coordinate Plane

Unit refresh videos

Unit 1

  • Sub-Unit 2 – Answering the Question “Are There Enough?”
  • Sub-Unit 3 – Counting and Cardinality

Unit 2

  • Sub-Unit 1 – Comparing 2 Groups Using the Terms More, Fewer, and Same
  • Sub-Unit 2 – Counting Objects in Different Orders
  • Sub-Unit 3 – Making Groups to Represent Numerals
  • Sub-Unit 4 – Comparing Written Numbers

Unit 3

  • Sub-Unit 1 – Identifying Circles and Triangles in Different Sizes and Orientations
  • Sub-Unit 2 – Using Positional Words to Describe the Location of Shapes

Unit 4

  • Sub-Unit 1 – Adding and Subtracting Within 10
  • Sub-Unit 2 – Representing Addition and Subtraction Story Problems
  • Sub-Unit 3 – Finding the Values of Expressions

Unit 5

Unit 1

  • Sub-Unit 1 – Organizing Data to Count How Many in Each Category
  • Sub-Unit 2 – Counting on to Add and Counting Back to Subtract
  • Sub-Unit 3 – Representing 2 Categories of Data With Addition Equations

Unit 2

  • Sub-Unit 1 – Representing and Solving Add To, Change Unknown Story Problems
  • Sub-Unit 2 – Using Addition or Subtraction to Find an Unknown Part of a Total Amount
  • Sub-Unit 3 – Solving Compare, Difference Unknown Problems
  • Sub-Unit 4 – Making Sense of Story Problems With Different Questions

Unit 3

  • Sub-Unit 1 – Finding a Difference Using the Relationship Between Addition and Subtraction
  • Sub-Unit 2 – Using the Structure of Teen Numbers to Find Missing Addends
  • Sub-Unit 3 – Breaking Apart Addends to Make 10 When Adding
  • Sub-Unit 4 – Subtracting From Teen Numbers in Parts to Get to 10

Unit 4

  • Sub-Unit 1 – Adding a Ten To and Subtracting a Ten From Multiples of 10
  • Sub-Unit 2 – Representing and Writing Two-Digit Numbers
  • Sub-Unit 3 – Comparing Two-Digit Numbers
  • Sub-Unit 4 – Representing the Same Two-Digit Number With Different Amounts of Tens and Ones

Unit 5

  • Sub-Unit 1 – Adding a Number of Tens or Ones to a Two-Digit Number
  • Sub-Unit 2 – Adding a Two-Digit Number and a One-Digit Number When Composing a Ten is Necessary
  • Sub-Unit 3 – Adding a Two-Digit Number and a Two-Digit Number When Composing a Ten is Necessary

Unit 1

  • Sub-Unit 1 – Choosing Strategies to Add Within 20
  • Sub-Unit 2 – Representing Data in a Picture Graph and Bar Graph
  • Sub-Unit 3 – Finding the Difference Between 2 Categories Shown on a Bar Graph

Unit 2

  • Sub-Unit 1 – Strategies to Solve Story Problems Involving Money
  • Sub-Unit 2 – Decomposing a Ten When Subtracting by Place
  • Sub-Unit 3 – Making Sense of Story Problems About Comparing That Use the Word More
  • Sub-Unit 4 – Making Sense of One- and Two-Step Story Problems

Unit 3

  • Sub-Unit 1 – Measuring the Length of an Object in Centimeters Using a Ruler
  • Sub-Unit 2 – Measuring Objects in Inches and Feet
  • Sub-Unit 3 – Representing Measurement Data on a Line Plot

Unit 4

  • Sub-Unit 1 – Locating Numbers on Number Lines
  • Sub-Unit 2 – Representing Addition and Subtraction Strategies on a Number Line

Unit 5

  • Sub-Unit 1 – Composing Hundreds to Represent Three-Digit Numbers
  • Sub-Unit 2 – Comparing Three-Digit Numbers

Unit 1

  • Sub-Unit 1 – Representing Equal-Groups Situations With Equal-Groups Drawings
  • Sub-Unit 2 – Representing Arrays With Multiplication Equations
  • Sub-Unit 3 – Representing Data Using Scaled Bar Graphs

Unit 2

  • Sub-Unit 1 – Determining the Area of a Rectangle Using Counting and Skip Counting
  • Sub-Unit 2 – Determining the Area of a Rectangle Using Multiplication
  • Sub-Unit 3 – Decomposing to Determine the Area of Rectilinear Figures

Unit 3

  • Sub-Unit 1 – Using the Expanded Form and Partial Sums Algorithms to Add
  • Sub-Unit 2 – Using the Expanded Form Algorithm to Subtract
  • Sub-Unit 3 – Rounding Numbers to the Nearest Hundred and Ten Using Number Lines
  • Sub-Unit 4 – Representing and Solving Two-Step Story Problems Involving Multiplication

Unit 4

  • Sub-Unit 1 – Representing Division Situations With Equal-Groups Drawings
  • Sub-Unit 2 – Representing an Equal-Groups Problem With a Division and Multiplication Equation
  • Sub-Unit 3 – Using the Distributive Property of Multiplication to Multiply a One-Digit Number by a Teen Number
  • Sub-Unit 4 – Decomposing Dividends to Divide

Unit 5

  • Sub-Unit 1 – Writing Unit and Non-Unit Fractions
  • Sub-Unit 2 – Locating Non-Unit Fractions on the Number Line
  • Sub-Unit 3 – Identifying Equivalent Fractions
  • Sub-Unit 4 – Comparing Fractions With the Same Denominator or Same Numerator

Unit 1

  • Sub-Unit 1 – Using Factor Pairs to Determine All the Possible Side Lengths of a Rectangle With a Given Area
  • Sub-Unit 2 – Finding Multiples and Common Multiples

Unit 2

  • Sub-Unit 1 – Locating Fractions with Different Denominators On the Same Number Line
  • Sub-Unit 2 – Using Multiples or Factors to Determine Equivalent Fractions
  • Sub-Unit 3 – Comparing Fractions Using Equivalent Fractions With Common Denominators

Unit 3

  • Sub-Unit 1 – Adding and Subtracting Fractions with the Same Denominator
  • Sub-Unit 2 – Multiplying Whole Numbers and Fractions
  • Sub-Unit 3 – Adding Fractions with Denominators of 10 and 100

Unit 4

  • Sub-Unit 1 – Writing Fractions With Denominators of 10 and 100 as Decimals
  • Sub-Unit 2 – Relationships Between Place Values in Multi-Digit Whole Numbers
  • Sub-Unit 3 – Comparing Multi-Digit Numbers
  • Sub-Unit 4 – Using the Standard Algorithm to Subtract When Decomposing is Required

Unit 5

  • Sub-Unit 1 – Representing Multiplicative Comparison Situations
  • Sub-Unit 2 – Converting Measurements in the Metric System
  • Sub-Unit 3 – Comparing Measurements

Unit 1

  • Sub-Unit 1 – Using the Layered Structure of a Rectangular Prism to Determine the Volume
  • Sub-Unit 2 – Determining the Volume of a Rectangular Prism
  • Sub-Unit 3 – Determining the Volume of Figures Composed of Rectangular Prisms

Unit 2

  • Sub-Unit 1 – Representing Equal-Sharing Story Problems with Fractional Quotients
  • Sub-Unit 2 – Representing Fractions with Equivalent Multiplication and Division Expressions
  • Sub-Unit 3 – Determining the Area of a Rectangle With a Fractional Side Length

Unit 3

  • Sub-Unit 1 – Representing Multiplication of 2 Unit Fractions with Diagrams
  • Sub-Unit 2 – Dividing Whole Numbers by Unit Fractions

Unit 4

  • Sub-Unit 1 – Multiplying Multi-digit Whole Numbers Using the Partial Products and Standard Algorithms
  • Sub-Unit 2 – Dividing Multi-Digit Whole Numbers Using Partial Quotients
  • Sub-Unit 3 – Representing Multi-Step Story Problems with Equations

Unit 5

  • Sub-Unit 1 – Comparing Decimals
  • Sub-Unit 2 – Using the Standard Algorithms to Add and Subtract Decimals
  • Sub-Unit 3 – Multiplying a Whole Number and a Decimal Using the Distributive Property
  • Sub-Unit 4 – Dividing Whole Numbers by Decimals Less Than 1

Access Amplify Desmos Math California at home.

In addition to a print Student Edition workbook, your student will have digital access to all learning, practice, and assessment materials through the Amplify platform. The digital curriculum can be accessed in school and at home by following these instructions:

  • Click the Amplify Desmos Math California button.
  • Select Log in with Amplify.
  • Enter your student’s username and password provided by your student’s teacher.
  • Select the desired grade level.

Once logged in, caregivers can view student work by opening previous assignments.

Learn how to navigate the student home page.

Materials overview

Amplify Desmos Math California address blended learning with supporting print materials and a unique digital experience. All K–5 lessons are available in a write-in Student Edition book. Many of the lessons include hands-on activities with manipulatives, tools that help students understand abstract concepts by making them tangible. Your student will also work with digital devices for an age-appropriate number of lessons.

When students use devices, teachers can monitor their work in real time, making sure they get the exact support that they need at every part of the lesson, in and outside of class.

Una interfaz digital que muestra los nombres anónimos de los estudiantes y su estado de participación en diversas actividades. La interfaz incluye opciones para realizar resúmenes, capturas de pantalla y vistas individuales de los estudiantes.

Components of a lesson

Students in an Amplify Desmos Math California classroom can be seen (and heard!) asking questions, debating answers, justifying their thinking, grappling with problems, and working together and independently.

A typical Amplify Desmos Math California lesson includes:

  • Warm-up: A short, attention-getting problem to pique students’ interest in the lesson.
  • Activities: One to two mini-activities that challenge students’ problem-solving skills.
  • Synthesis: Discussion to review and bring together the important concepts from the lesson.
  • Show What You Know and Reflection: Questions for students to show what they know from the lesson. (Note: The Show What You Know lesson assessment is optional for kindergarten and grade 1.)
  • Centers: Student-led activity stations that reinforce the math learned during lesson activities through interactive and often game-like formats. In kindergarten and grade 1, time for Centers is built into the last 15 minutes of every lesson.

To support, strengthen, and stretch students’ learning after the lesson, Amplify Desmos Math California offers options for:

  • Differentiation: Mini-Lessons, Centers, Extensions, Boost Personalized Learning, and Fluency Practice.
  • Practice: Additional problems your student’s teacher may assign for classwork or homework.

Support math learning at home.

You can support your student’s math learning outside of school in many ways:

Your student’s teacher may assign practice problems at the end of each lesson for classwork or homework. If your student has already completed the practice problems for the lesson, ask them to walk you through how they solved each problem, or talk about any parts that were challenging for them. Ask your student follow-up questions to encourage the use of math language as they explain their thinking, such as, “How do you know?,” “How can you show your thinking?,” or “How would you describe that?” If students are stuck, ask support questions, such as, “What information do you know here?” or “How could you represent this problem?”

Your student’s teacher may introduce a Center game with students in the lesson or beyond the lesson. These games are aligned to the math of the unit and can be played with students outside of class. Your student’s teacher may introduce a Center game to students during or after completing a lesson, or you may need to teach the game before you play by using easy-to-follow instructions. Sign up for a free account to explore Centers and additional K–5 content in our Featured Collections.

Each unit in Amplify Desmos Math begins with a read-aloud story to engage students and provide context for the math of the unit. Elements and characters from the Unit Story then appear in lessons throughout the unit.

Kindergarten

Grade 1

Grade 2

Grade 3

Grade 4

Grade 5

Relate math to daily activities at home, whether grocery shopping, preparing a meal, or planning for a trip to the store. Your student can help you figure out how many more apples there are than oranges in the grocery cart, show how to split a sandwich into fourths, or figure out how much change you’ll receive in exchange for a $10 bill. Encourage your student to point out ways that you use math in your daily tasks.

Remind your student that getting stuck is part of the process and a necessary—beneficial, even!—part of learning. Many students (and adults) fear making mistakes. But research shows that making mistakes helps our brains grow. When your student gets stuck on a problem, encourage them to keep trying different strategies, even if they’re not sure if they are right.

Get more information.

Have a question about Amplify Desmos Math California? Visit our help library to search for articles with answers to your program questions. For additional support, please contact your student’s teacher.

Eureka Math® crosswalk to Amplify Desmos Math free lessons

Grade 6

Module 1: Ratios and Unit Rates

Eureka MathAmplify Classroom
Topic A Representing and Reasoning About Ratios 
Lesson 3: Equivalent Ratios
Lesson 4: Equivalent Ratios
Unit 2
Lesson 4: Fruit Lab
Topic C Unit Rates 
Lesson 16: From Ratio to RatesUnit 3
Lesson 6: Soft Serve
Lesson 18: Finding a Rate by Dividing Two QuantitiesUnit 3
Lesson 6: Soft Serve
Lesson 24: Percent and Rates per 100Unit 3
Lesson 9: Lucky Duckies

Module 2: Arithmetic Operations Including Division of Fractions

Topic A Dividing Fractions by Fractions
Lesson 2: Interpreting Division of a Whole Number by a Fraction —Visual Models.Unit 4
Lesson 3: Flour Planner
Lesson 3: Interpreting and Computing Division of a Fraction by a Fraction—More Models
Lesson 4: Interpreting and Computing Division of a Fraction by a Fraction—More Models
Unit 4
Lesson 6: Fill the Gap
Lesson 8: Dividing Fractions and Mixed NumbersUnit 4
Lesson 6: Fill the Gap
Topic B Multi-Digit Decimal Operations—Adding, Subtracting, and Multiplying
Lesson 9: Sums and Differences of DecimalsUnit 5
Lesson 2: Decimal Diagrams and Algorithms

Module 3: Rational Numbers

Topic B Order and Absolute Value
Lesson 7: Ordering Integers and Other Rational Numbers
Lesson 8: Ordering Integers and Other Rational Numbers
Lesson 9: Comparing Integers and Other Rational Numbers
Unit 7Lesson 4: Order in the Class

Module 4: Expressions and Equations

Topic D Expanding, Factoring, and Distributing Expressions 
Lesson 9: The Relationship of Addition and SubtractionUnit 6
Lesson 8: Products and Sums
Take Away (coming soon!)
Lesson 10: Writing and Expanding Multiplication Expressions
Lesson 11: Factoring Expressions
Lesson 12: Distributing Expressions
Unit 6
Lesson 8: Products and Sums
Take Away (coming soon!)
Topic F Writing and Evaluating Expressions and Formulas 
Lesson 18: Writing and Evaluating Expressions—Addition and Subtraction
Lesson 19: Substituting to Evaluate Addition and Subtraction Expressions
Lesson 20: Writing and Evaluating Expressions—Multiplication and Division
Lesson 21: Writing and Evaluating Expressions—Multiplication and Addition
Unit 6
Lesson 8: Products and Sums
Take Away (coming soon!)
Topic G Solving Equations 
Lesson 23: True and False Number Sentences
Lesson 24: True and False Number Sentences
Unit 6
Lesson 1: Weight for It
Lesson 25: Finding Solutions to Make Equations TrueUnit 6
Lesson 1: Weight for It
Lesson 26: One-Step Equations—Addition and SubtractionUnit 6
Lesson 1: Weight for It
Topic H Applications of Equations 
Lesson 33: From Equations to Inequalities
Lesson 34: Writing and Graphing Inequalities in Real-World Problems
Unit 7
Lesson 7: Tunnel Travels

Module 5: Area, Surface Area, and Volume Problems

Topic A: Area of Triangles, Quadrilaterals, and Polygons
Lesson 1: The Area of Parallelograms Through Rectangle FactsUnit 1
Lesson 3: Exploring Parallelograms
Exploring Parallelograms, Part 2
Topic D Nets and Surface Area 
Lesson 18: Determining Surface Area of Three-Dimensional FiguresUnit 1
Lesson 10: Renata’s Stickers

Module 6: Statistics

Topic A Understanding Distributions 
Lesson 2: Displaying a Data Distribution
Lesson 3: Creating a Dot Plot
Unit 8
Lesson 3: Minimum Wage
Lesson 4: Creating a Histogram
Lesson 5: Describing a Distribution Displayed in a Histogram
Unit 8
Lesson 5: The Plot Thickens
Topic C Summarizing a Distribution That Is Skewed Using the Median and the Interquartile Range 
Lesson 12: Describing the Center of a Distribution Using the MedianUnit 8
Lesson 11: Toy Cars
Topic D Summarizing and Describing Distributions 
Lesson 18: Connecting Graphical Representations and Numerical SummariesUnit 8
Lesson 5: The Plot Thickens
Lesson 3: Creating a Dot PlotUnit 8
Lesson 3: Minimum Wage

Grade 7

Module 1: Ratios and Proportional Relationships

Eureka MathAmplify Classroom
Topic A Proportional Relationships 
Lesson 1: An Experience in Relationships as Measuring RateUnit 2
Lesson 1: Paint
 
Unit 4
Lesson 1: Mosaics
Lesson 5: Identifying Proportional and Non-Proportional Relationships in Graphs
Lesson 6: Identifying Proportional and Non-Proportional Relationships in Graphs
Unit 2
Lesson 8: Dino Pops
Topic B Unit Rate and the Constant of Proportionality 
Lesson 8: Representing Proportional Relationships with Equations
Lesson 9: Representing Proportional Relationships with Equations
Unit 2
Lesson 6: Two and Two
Lesson 10: Interpreting Graphs of Proportional RelationshipsUnit 2
Lesson 8: Dino Pops
Topic C Ratios and Rates Involving Fractions 
Lesson 11: Ratios of Fractions and Their Unit Rates
Lesson 12: Ratios of Fractions and Their Unit Rates
Unit 2
Lesson 6: Two and Two
Lesson 15: Equations of Graphs of Proportional Relationships Involving FractionsUnit 2
Lesson 8: Dino Pops
Topic D Ratios of Scale Drawings 
Lesson 16: Relating Scale Drawings to Ratios and RatesUnit 1
Lesson 1: Scaling Machines
Lesson 18: Computing Actual Lengths from a Scale DrawingUnit 1
Lesson 7: Will It Fit?
Lesson 19: Computing Actual Areas from a Scale DrawingUnit 1
Lesson 7: Will It Fit?

Module 2: Rational Numbers

Topic A Addition and Subtraction of Integers and Rational Numbers 
Lesson 1: Opposite Quantities Combine to Make ZeroUnit 5
Lesson 1: Floats and Anchors
Lesson 2: Using the Number Line to Model the Addition of Integers
Lesson 3: Understanding Addition of Integers
Lesson 4: Efficiently Adding Integers and Other Rational Numbers
Lesson 5: Understanding Subtraction of Integers and Other Rational Numbers
Unit 5
Lesson 4: Draw Your Own
Lesson 10: Integer Puzzles
Lesson 7: Addition and Subtraction of Rational NumbersUnit 5
Lesson 4: Draw Your Own
Lesson 10; Integer Puzzles
Topic B Multiplication and Division of Integers and Rational Numbers 
Lesson 10: Understanding Multiplication of Integers
Lesson 11: Develop Rules for Multiplying Signed Numbers
Unit 5
Lesson 10: Integer Puzzles
Lesson 15: Multiplication and Division of Rational NumbersUnit 5
Lesson 10: Integer Puzzles

Module 3: Expressions and Equations

Topic A Use Properties of Operations to Generate Equivalent Expressions 
Lesson 3: Writing Products as Sums and Sums as Products
Lesson 4: Writing Products as Sums and Sums as Products
Unit 6
Lesson 10: Collect the Squares
Topic B Solve Problems Using Expressions, Equations, and Inequalities 
Lesson 8: Using If-Then Moves in Solving Equations
Lesson 9: Using If-Then Moves in Solving Equations
Unit 6Lesson 10: Collect the Squares
Lesson 10: Angle Problems and Solving EquationsUnit 7
Lesson 2: Friendly Angles
Lesson 4: Missing Measures
Lesson 12: Properties of Inequalities
Lesson 13: Inequalities
Lesson 14: Solving Inequalities
Unit 6
Lesson 16: Shira the Sheep
Topic C Use Equations and Inequalities to Solve Geometry Problems 
Lesson 16: The Most Famous Ratio of AllUnit 3
Lesson 3: Measuring Around
Lesson 17: The Area of a CircleUnit 3
Lesson 9: Area Challenges
Lesson 18: More Problems on Area and CircumferenceUnit 3
Lesson 9: Area Challenges

Module 4: Percent and Proportional Relationships

Topic A Finding the Whole 
Lesson 1: PercentUnit 4
Lesson 1: Mosaics
Lesson 2: Part of a Whole as a PercentUnit 4
Lesson 1: Mosaics
Lesson 3: Comparing Quantities with PercentUnit 4
Lesson 1: Mosaics
Lesson 4: Percent Increase and DecreaseUnit 4
Lesson 5: Percent MachinesLesson 12: Posing Percent Problems(coming soon!)
Lesson 5: Finding One Hundred Percent Given Another Percent 
Lesson 6: Fluency with PercentsUnit 4
Lesson 5: Percent MachinesLesson 12: Posing Percent Problems(coming soon!)
Topic B Percent Problems Including More Than One Whole 
Lesson 7: Markup and Markdown ProblemsUnit 4
Lesson 5: Percent MachinesLesson 12: Posing Percent Problems(coming soon!)
Lesson 8: Percent Error Problems
Lesson 9: Problem Solving When the Percent Changes
Unit 4
Lesson 5: Percent MachinesLesson 12: Posing Percent Problems(coming soon!)
Lesson 10: Simple Interest 
Lesson 11: Tax, Commissions, Fees, and Other Real-World Percent ApplicationsUnit 4
Lesson 12: Posing Percent Problems
(coming soon!)
Topic C Scale Drawings 
Lesson 13: Changing ScalesUnit 1
Lesson 1: Scaling Machines
Lesson 7: Will It Fit?
Lesson 14: Computing Actual Lengths from a Scale DrawingUnit 1
Lesson 7: Will It Fit?
Topic D Population, Mixture, and Counting Problems Involving Percents 
Lesson 16: Population ProblemsUnit 8
Lesson 10: Crab Island

Module 5: Statistics and Probability

Topic A Calculating and Interpreting Probabilities 
Lesson 1: Chance ExperimentsUnit 8
Lesson 1: How Likely?
Lesson 2: Prob-bear-bilities
Topic C Random Sampling and Estimating Population Characteristics 
Lesson 13: Populations, Samples, and Generalizing from a Sample to a PopulationUnit 8
Lesson 10: Crab Island
Lesson 14: Selecting a Sample
Lesson 15: Random Sampling
Lesson 16: Methods for Selecting a Random Sample
Unit 8
Lesson 10: Crab Island
Topic D Comparing Populations 
Lesson 22: Using Sample Data to Compare the Means of Two or More Populations
Lesson 23: Using Sample Data to Compare the Means of Two or More Populations
Unit 8
Lesson 10: Crab Island

Module 6: Geometry

Topic A Unknown Angles 
Lesson 1: Complementary and Supplementary AnglesUnit 7
Lesson 2: Friendly Angles
Lesson 2: Solving for Unknown Angles Using Equations
Lesson 3: Solving for Unknown Angles Using Equations
Lesson 4: Solving for Unknown Angles Using Equations
Unit 7
Lesson 4: Missing Measures
Topic B Constructing Triangles 
Lesson 8: Drawing TrianglesUnit 7
Lesson 5: Can You Build It?
Lesson 11: Conditions on Measurements That Determine a TriangleUnit 7
Lesson 5: Can You Build It?
Topic D Problems Involving Area and Surface Area 
Lesson 22: Area Problems with Circular RegionsUnit 3
Lesson 9: Area Challenges

Grade 8

Module 1: Integer Exponents and Scientific Notation

Eureka MathAmplify Classroom
Topic A Exponential Notation and Properties of Integer Exponents 
Lesson 1: Exponential NotationUnit 7 
Lesson 1: Circles
Lesson 2: Multiplication of Numbers in Exponential Form
Lesson 3: Numbers in Exponential Form Raised to a Power
Unit 7 
Lesson 3: Power Pairs
Topic B Magnitude and Scientific Notation 
Lesson 9: Scientific Notation
Lesson 10: Operations with Numbers in Scientific Notation
Unit 7 
Lesson 9: Specific and Scientific
Lesson 11: Balance the Scale

Module 2: The Concept of Congruence

Topic A Definitions and Properties of the Basic Rigid Motions 
Lesson 1: Why Move Things Around?
Lesson 2: Definition of Translation and Three Basic Properties
Unit 1
Lesson 1: Transformers
Lesson 2: Spinning, Flipping, Sliding
Lesson 3: Translating LinesUnit 1
Lesson 1: Transformers
Lesson 2: Spinning, Flipping, Sliding
Lesson 4: Definition of Reflection and Basic Properties
Lesson 5: Definition of Rotation and Basic Properties
Lesson 6: Rotations of 180 Degrees
Unit 1
Lesson 1: Transformers
Lesson 2: Spinning, Flipping, Sliding
Lesson 4: Moving Day
Topic B Sequencing the Basic Rigid Motions 
Lesson 9: Sequencing Rotations
Lesson 10: Sequences of Rigid Motions
Unit 1
Lesson 13: Tessellate
Lesson 14: More on the Angles of a TriangleUnit 1 
Lesson 12: Puzzling It Out

Module 3: Similarity

Topic A Dilation 
Lesson 1: What Lies Behind “Same Shape”?Unit 2
Lesson 1: Sketchy Dilations
Lesson 2: Dilation Mini Golf
Lesson 2: Properties of Dilations
Lesson 3: Examples of Dilations
Unit 2
Lesson 1: Sketchy Dilations
Lesson 2: Dilation Mini Golf
Lesson 4: Fundamental Theorem of Similarity
Lesson 5: First Consequences of FTS
Unit 2
Lesson 6: Social Scavenger Hunt
Topic B Similar Figures 
Lesson 8: Similarity
Lesson 9: Basic Properties of Similarity
Unit 2
Lesson 6: Social Scavenger Hunt
Topic C The Pythagorean Theorem 
Lesson 13: Proof of the Pythagorean TheoremUnit 8
Lesson 8: Triangle-Tracing Turtle

Module 4: Linear Equations

Topic A Writing and Solving Linear Equations 
Lesson 4: Solving a Linear EquationUnit 4
Lesson 5: Equation Roundtable
Lesson 5: Writing and Solving Linear EquationsUnit 4
Lesson 5: Equation Roundtable
Lesson 6: Solutions of a Linear EquationUnit 4
Lesson 5: Equation Roundtable
Topic B Linear Equations in Two Variables and Their GraphsUnit 3
Lesson 4: Flags
Lesson 10: A Critical Look at Proportional RelationshipsUnit 3
Lesson 1: Turtle Time TrialsLesson 4: Flags
Lesson 11: Constant RateUnit 3
Lesson 4: Flags
Lesson 13: The Graph of a Linear Equation in Two VariablesUnit 3 
Lesson 4: Flags
Topic C Slope and Equations of Lines 
Lesson 15: The Slope of a Non-Vertical LineUnit 3
Lesson 4: Flags
Lesson 18: There Is Only One Line Passing Through a Given Point with a Given SlopeUnit 3
Lesson 4: Flags
Lesson 19: The Graph of a Linear Equation in Two Variables Is a LineUnit 3
Lesson 4: Flags
Lesson 20: Every Line Is a Graph of a Linear EquationUnit 3
Lesson 4: Flags
Lesson 22: Constant Rates RevisitedUnit 3
Lesson 1: Turtle Time Trials
Topic D Systems of Linear Equations and Their Solutions 
Lesson 25: Geometric Interpretation of the Solutions of a Linear SystemUnit 4  
Lesson 11: Make Them Balance
Lesson 12: Line Zapper

Module 5: Examples of Functions from Geometry

Topic A Functions 
Lesson 1: The Concept of a FunctionUnit 5
Lesson 1: Turtle Crossing
Lesson 2: Guess My Rule
Lesson 2: Formal Definition of a FunctionUnit 5
Lesson 1: Turtle Crossing
Lesson 2: Guess My Rule
Lesson 3: Linear Functions and ProportionalityUnit 3
Lesson 1: Turtle Time Trials
Lesson 5: Graphs of Functions and EquationsUnit 5
Lesson 5: The Tortoise and the Hare
Lesson 6: Graphs of Linear Functions and Rate of ChangeUnit 3
Lesson 4: Flags
Lesson 7: Comparing Linear Functions and GraphsUnit 5
Lesson 5: The Tortoise and the Hare
Topic B Volume 
Lesson 10: Volumes of Familiar Solids—Cones and CylindersUnit 5
Lesson 11: Cylinders

Module 6: Linear Functions

Topic A Linear Functions 
Lesson 2: Interpreting Rate of Change and Initial ValueUnit 3
Lesson 1: Turtle Time Trials
Lesson 4: Increasing and Decreasing Functions
Lesson 5: Increasing and Decreasing Functions
Unit 5
Lesson 1: Turtle CrossingLesson 5: The Tortoise and the Hare
Topic B Bivariate Numerical Data 
Lesson 6: Scatter Plots
Lesson 7: Patterns in Scatter Plots
Unit 6 
Lesson 3: Robots
Lesson 8: Informally Fitting a LineUnit 6
Lesson 4: Dapper Cats
Lesson 6: Find the Fit
Lesson 10: Linear Models
Lesson 11: Using Linear Models in a Data Context
Unit 5
Lesson 5: The Tortoise and the Hare
Topic D Bivariate Categorical Data 
Lesson 14: Association Between Categorical VariablesUnit 6
Lesson 11: Finding Associations

Module 7: Introduction to Irrational Numbers Using Geometry

Topic A Square and Cube Roots 
Lesson 2: Square RootsUnit 8
Lesson 4: Root Down
Lesson 4: Simplifying Square RootsUnit 8
Lesson 4: Root Down
Topic C The Pythagorean Theorem 
Lesson 18: Applications of the Pythagorean TheoremUnit 8
Lesson 10: Taco Truck

Algebra 1

Module 1: Relationships Between Quantities and Reasoning with Equations and Their Graphs

Topic A: Introduction to Functions Studied this Year—Graphing Stories

Lesson 1: Graphs of Piecewise FunctionsPumpkin Prices
Lesson 2: Graphs of Quadratic FunctionsRevisiting Visual Patterns, Part 1
Quadratic Visual Patterns

Topic C: Solving Equations and Inequalities

Lesson 10: True and False EquationsSame Position
Lesson 11: Solution Sets for Equations and InequalitiesWorking Backwards
Solving Strategies
Shelley the Snail
Lesson 19: Rearranging FormulasSubway Seats
Various Variables
Lesson 21: Solution Sets to Inequalities with Two VariablesPizza Delivery
Lesson 22 & Lesson 23: Solution Sets to Simultaneous Equations (and Inequalities)Shape It Up
Lizard Lines
Quilts
Seeking Solutions

Module 2: Descriptive Statistics

Topic D: Numerical Data on Two Variables

Lesson 14: Modeling Relationships with a LineCity Slopes
Residual Fruit
Penguin Populations
Lesson 19: Interpreting CorrelationCorrelation Coefficient
How Hot Is It?
Behind the Headlines
City Data

Module 3: Linear and Exponential Functions

Topic A: Linear and Exponential Sequences

Lesson 3: Arithmetic and Geometric SequencesSequence Carnival
More Visual Patterns
Lesson 5: The Power of Exponential GrowthCarlos’s Fish

Topic B: Describing Variability and Comparing Distributions

Lesson 4: Summarizing Deviations from the MeanFinding Desmo
Lesson 13: Interpreting the Graph of a FunctionCraft-a-Graph
Lesson 14: Linear and Exponential Models – Comparing Growth RatesDetroit’s Population, Part 1
Detroit’s Population, Part 2

Topic D: Using Functions and Graphs to Solve Problems

Lesson 21: Comparing Linear and Exponential Models AgainPlane, Train, and Automobile
Lesson 21: Comparing Linear and Exponential Models AgainCarlos’s Fish

Module 4: Polynomial and Quadratic Expressions, Equations, and Functions

Topic A: Quadratic Expressions, Equations, Functions, and Their Connection to Rectangles

Lesson 8: Exploring the Symmetry in Graphs of Quadratic FunctionsOn the Fence
Plenty of Parabolas
Robot Launch
Lesson 9: Graphing Quadratic Functions from Factored Form, 𝑓(𝑥)=𝑎(𝑥−𝑚)(𝑥−𝑛)Two for One
Parabola Zapper
Shooting Stars
Lesson 10: Interpreting Quadratic Functions from Graphs and TablesStomp Rockets

Topic B: Using Different Forms for Quadratic Functions

Lessons 11–12: Completing the SquareSquare Tactic
Lesson 15: Using the Quadratic FormulaStomp Rockets in Space

Topic C: Function Transformations and Modeling

Lesson 18: Graphing Cubic, Square Root, and Cube Root FunctionsSorting Relationships
Lesson 22: Comparing Quadratic, Square Root, and Cube Root Functions Represented in Different WaysSorting Relationships

Disclaimer

This document is for informational purposes only; references to third-party programs do not imply endorsement or affiliation, and all trademarks are the property of their respective owners.

Illustrative Mathematics-NEW

To view this protected page, enter the password below:


Grade 6

Unit 1: Area and Surface Area

Illustrative MathematicsAmplify Classroom
Topic A: Reasoning to Find Area 
Lesson 1: Tiling the PlaneUnit 1
Lesson 1: Shapes on a Plane
Lesson 4: Parallelograms
Lesson 5: Bases and Heights of Parallelograms
Lesson 6: Area of Parallelograms
Unit 1
Lesson 3: Exploring Parallelograms
Topic 3: Triangles
Lesson 7: From Parallelograms to TrianglesUnit 1
Lesson 3: Exploring Parallelograms
Topic 5: Surface Area
Lesson 12: What is Surface Area?Unit 1
Lesson 10: Renata’s Stickers

Unit 2: Introducing Ratios

Topic 1: Introducing Ratios
Lesson 1: Introducing Ratios and Ratio LanguageUnit 2
Lesson 1: Pizza Maker
Lesson 2: Representing Ratios with DiagramsUnit 2
Lesson 1: Pizza Maker
Topic 2: Equivalent Ratios
Lesson 3: RecipesUnit 2
Lesson 4: Fruit Lab
Lesson 5: Defining Equivalent RatiosUnit 2
Lesson 1: Pizza Maker
Topic 4: Solving Ratio and Rate Problems
Lesson 11: Representing Ratios with TablesUnit 2
Lesson 10: Disaster Preparation

Unit 3: Rates and Percentages

Topic 2: Unit Conversion
Lesson 2: Anchoring Units of MeasurementUnit 3
Lesson 1: Many Measurements
Topic 3: Rates
Lesson 5: Comparing Speeds and PricesUnit 3
Lesson 6: Soft Serve
Lesson 6: Interpreting Rates
Lesson 7: Equivalent Ratios Have the Same Unit Rates
Unit 3
Lesson 6: Soft Serve
Topic 4: Percentages
Lesson 10: What Are percentagesUnit 3
Lesson 9: Lucky Duckies
Lesson 13: Benchmark percentagesUnit 3
Lesson 9: Lucky Duckies
Topic 5: Let’s Put It to Work 
Lesson 7: Equivalent Ratios Have the Same Unit RatesUnit 3
Lesson 6: Soft Serve

Unit 4: Dividing Fractions

Topic 2: Meanings of Fraction Division
Lesson 4: How Many Groups (Part 1)Unit 4
Lesson 3: Flour Planner 
Lesson 6: Using Diagrams to Find the Number of GroupsUnit 4
Lesson 6: Fill the Gap

Unit 5: Arithmetic in Base Ten

Topic 1: Warming Up to Decimals 
Lesson 1: Using Decimals in a Shopping ContextUnit 5
Lesson 1: Dishing Out Decimals
Topic 5: Let’s Put It to Work
Lesson 14: Using Operations on Decimals to Solve ProblemsUnit 5
Lesson 13: Movie Time

Unit 6: Expressions and Equations

Lesson 1: Tape Diagrams and Equations
Lesson 2: Truth and Equations
Unit 6
Lesson 1: Weight for It
Lesson 3: Staying in BalanceUnit 6
Lesson 1: Weight for It
Topic 2: Equal and Equivalent
Lesson 8: Equal and EquivalentUnit 6
Lesson 1: Weight for It
Topic 9: The Distributive Property, Part 1Unit 6
Lesson 8: Products and Sums
Take Away (coming soon!)
Lesson 10: The Distributive Property, Part 2
Lesson 11: The Distributive Property, Part 3
Unit 6
Lesson 8: Products and Sums
Take Away (coming soon!)
Topic 5: Let’s Put It to Work
Lesson 19: Tables, Equations, and Graphs, Oh My!Unit 6
Lesson 16: Subway Fares
Take Away (coming soon!)

Unit 7: Rational Numbers

Lesson 1: Positive and Negative NumbersUnit 7
Lesson 1: Can You Dig It?
Lesson 3: Comparing Positive and Negative Numbers
Lesson 4: Ordering Rational Numbers
Unit 7
Lesson 4: Order in the Class
Topic 2: Inequalities
Lesson 9: Solutions of Inequalities
Lesson 10: Interpreting Inequalities
Unit 7
Lesson 7: Tunnel Travels
Topic 3: The Coordinate Plane
Lesson 15: Shapes on the Coordinate PlaneUnit 1
Lesson 1: Shapes on a Plane

Unit 8: Data Sets and Distributions

Topic 2: Dot Plots and Distributions
Lesson 3: Representing Data Graphically
Lesson 4: Dot Plots
Lesson 5: Using Dot Plots to Answer Statistical Questions
Unit 8
Lesson 3: Minimum Wage
Lesson 6: Interpreting Histograms
Lesson 7: Using Histograms to Answer Statistical Questions
Lesson 8: Describing Distributions on Histograms
Unit 8
Lesson 5: The Plot Thickens
Topic 4: Median and IQR
Lesson 13: MedianUnit 8
Lesson 11: Toy Cars

Grade 7

Unit 1: Scale Drawings

Illustrative MathematicsAmplify Classroom
Topic 1: Scaled Copies 
Lesson 1: What are Scaled Copies?Unit 1
Lesson 1: Scaling Machines
Topic 2: Scale Drawings 
Lesson 7: Scale DrawingsUnit 1
Lesson 7: Will It Fit?

Unit 2: Introducing Proportional Relationships

Topic 1: Representing Proportional Relationships with Tables
Lesson 1: One of These Things Is Not Like the OthersUnit 2
Lesson 1: Paint 
Topic 2: Representing Proportional Relationships with Equations 
Lesson 4: Proportional Relationships with EquationsUnit 2
Lesson 6: Two and Two
Lesson 5: Two Equations for Each Relationship
Lesson 6: Using Equations to Solve Problems
Unit 2
Lesson 6: Two and Two
Topic 3: Comparing Proportional and Nonproportional Relationships 
Lesson 8: Comparing Relationships with EquationsUnit 2
Lesson 6: Two and Two
Topic 4: Representing Proportional Relationships with Graphs
Lesson 10: Introducing Graphs of Proportional Relationships
Lesson 11: Interpreting Graphs of Proportional Relationships
Lesson 12: Using Graphs to Compare Relationships
Lesson 13: Two Graphs for Each Relationship
Unit 2
Lesson 8: Dino Pops

Unit 3: Measuring Circles

Topic 1: Circumference of a Circle 
Lesson 1: How Well Can You Measure?Unit 3
Lesson 8: Toothpicks (coming soon!)
Lesson 2: Exploring Circles
Lesson 3: Exploring Circumference
Lesson 4: Applying Circumference
Unit 3
Lesson 3: Measuring Around
Take Away (coming soon!)
Topic 2: Area of a Circle
Lesson 7: Exploring the Area of a Circle
Lesson 8: Relating Area to Circumference
Unit 3
Lesson 9: Area Challenges
Take Away (coming soon!)

Unit 4: Proportional Relationships and Percentages

Topic 1: Proportional Relationships with Fractions 
Lesson 1: Lots of Flags
Lesson 2: Ratios and Rates with Fractions
Lesson 3: Revisiting Proportional Relationships
Lesson 4: Half as Much Again
Unit 4
Lesson 1: Mosaics
Topic 2: Percent Increase and Decrease 
Lesson 6: Increasing and DecreasingUnit 4
Lesson 5: Percent Machines
Lesson 12: Posing Percent Problems (coming soon!)
Topic 3: Applying Percentages
Lesson 10: Tax and Tip
Lesson 11: Percentage Contexts
Unit 4
Lesson 12: Posing Percent Problems (coming soon!)
Topic 4: Let’s Put It to Work 
Lesson 16: Posing Percent ProblemsUnit 4
Lesson 12: Posing Percent Problems (coming soon!)

Unit 5: Rational Number Arithmetic

Topic 1: Interpreting Negative Numbers 
Lesson 1: Interpreting Negative NumbersUnit 5
Lesson 1: Floats and Anchors
Topic 2: Adding and Subtracting Rational Numbers
Lesson 2: Changing Temperatures
Lesson 3: Changing Elevation
Unit 5
Lesson 4: Draw Your Own
Lesson 6: Subtracting Rational Numbers
Lesson 7: Adding and Subtracting to Solve Problems
Unit 5
Lesson 4: Draw Your Own
Lesson 10: Integer Puzzles

Unit 6: Expressions, Equations, and Inequalities

Topic 1: Representing Situations of the Form px + q and p(+ q) = r 
Lesson 1: Relationships Between QuantitiesUnit 2
Lesson 1: Paint
Unit 4
Lesson 1: Mosaics
Topic 9 Dealing with Negative Numbers 
Lesson 10: Different Options for Solving One EquationUnit 6
Lesson 10: Collect the Squares
Topic 3: Inequalities 
Lesson 13: Reintroducing InequalitiesUnit 6
Lesson 16: Shira the Sheep
Lesson 14: Finding Solutions to Inequalities in Context
Lesson 15: Efficiency Solving Inequalities
Unit 6
Lesson 16: Shira the Sheep
Lesson 16: Interpreting Inequalities
Lesson 17: Modeling with Inequalities
Unit 6
Lesson 16: Shira the Sheep
Topic 4: Writing Equivalent Expressions 
Lesson 18: Subtraction in Equivalent ExpressionsUnit 6
Lesson 10: Collect the Squares
Lesson 20: Combining Like Terms (Part 1)
Lesson 21: Combining Like Terms (Part 2)
Lesson 22: Combining Like Terms (Part 3)
Unit 6
Lesson 10: Collect the Squares

Unit 7: Angles, Triangles, and Prisms

Lesson 2: Adjacent Angles
Lesson 3: Nonadjacent Angles
Unit 7
Lesson 2: Friendly Angles
Lesson 4: Solving for Unknown AnglesUnit 7
Lesson 2: Friendly Angles
Lesson 5: Using Equations to Solve for Unknown AnglesUnit 7
Lesson 4: Missing Measures
Topic 2: Drawing Polygons with Given Conditions 
Lesson 9: Drawing Triangles (Part 1)
Lesson 10: Drawing Triangles (Part 2)
Unit 7
Lesson 5: Can You Build It?

Unit 8: Probability and Sampling

Topic 1: Probabilities of Single Step Events
Lesson 1: Mystery Bags
Lesson 2: Chance Experiments
Lesson 3: What Are Probabilities?
Unit 8
Lesson 1: How Likely?
Lesson 2: Prob-bear-bilities
Topic 3: Sampling
Lesson 11: Comparing Groups
Lesson 12: Larger Populations
Lesson 13: What Makes a Good Sample?
Lesson 14: Sampling in a Fair Way
Unit 8
Lesson 10: Crab Island
Topic 4: Using Samples
Lesson 15: Estimating Population Measures of Center
Lesson 16: Estimating Population Proportions
Unit 8 
Lesson 10: Crab Island
Lesson 17: More about Sampling Variability
Lesson 18: Comparing Populations Using Samples
Lesson 19: Comparing Populations with Friends
Unit 8
Lesson 10: Crab Island

Grade 8

Unit 1: Rigid Transformations and Congruence

Illustrative MathematicsAmplify Classroom
Topic 1: Rigid Transformations 
Lesson 1: Moving in the PlaneUnit 1
Lesson 1: Transformers
Lesson 2: Naming the MovesUnit 1
Lesson 2: Spinning, Flipping, Sliding
Lesson 3: Grid MovesUnit 1
Lesson 4: Moving Day
Lesson 4: Making the MovesUnit 1
Lesson 1: Transformers
Lesson 2: Spinning, Flipping, Sliding
Lesson 4: Moving Day
Lesson 5: Coordinate MovesUnit 1
Lesson 4: Moving Day
Lesson 6: Describing TransformationsUnit 1
Lesson 6: Connecting the Dots (coming soon!)
Topic 2: Properties of Rigid Transformations 
Lesson 8: Rotation PatternsUnit 1
Lesson 1: Transformers
Lesson 2: Spinning, Flipping, Sliding
Lesson 4: Moving Day
Topic 5: Let’s Put It to Work
Lesson 17: Rotate and TessellateLesson 13: Tessellate

Unit 2: Dilations, Similarity, and Introducing Slope

Topic 1: Dilations
Lesson 1: Projecting and ScalingUnit 2
Lesson 1: Sketchy Dilations
Lesson 2: Dilation Mini Golf
Lesson 2: Circular Grid
Lesson 3: Dilations with No Grid
Lesson 4: Dilations on a Square Grid
Lesson 5: More Dilations
Unit 2
Lesson 1: Sketchy Dilations
Lesson 2: Dilation Mini Golf
Topic 2: Similarity 
Lesson 6: SimilarityUnit 2
Lesson 6: Social Scavenger Hunt
Topic 3: Slope
Lesson 10: Meet SlopeUnit 3
Lesson 4: Flags

Unit 3: Linear Relationships

Topic 1: Proportional Relationships 
Lesson 1: Understanding Proportional RelationshipsUnit 3
Lesson 1: Turtle Time Trials
Lesson 2: Graphs of Proportional RelationshipsUnit 3
Lesson 1: Turtle Time Trials
Lesson 3: Representing Proportional RelationshipsUnit 3
Lesson 1: Turtle Time Trials 
Topic 2: Representing Linear Relationships
Lesson 5: Introduction to Linear RelationshipsUnit 3
Lesson 1: Turtle Time Trials
Lesson 7: Representations of Linear RelationshipsUnit 3
Lesson 4: Flags
Topic 3: Finding Slopes 
Lesson 9: Slopes Don’t Have to be PositiveUnit 3
Lesson 4: Flags
Lesson 11: Equations of All Kinds of LinesUnit 3
Lesson 4: Flags
Topic 4: Linear Equations 
Lesson 13: More Solutions to Linear EquationsUnit 3 
Lesson 4: Flags

Unit 4: Linear Equations and Linear Systems

Topic 2: Linear Equation in One Variable 
Lesson 5: Solving Any Linear EquationUnit 4
Lesson 5: Equation Roundtable
Lesson 6: Strategic SolvingUnit 4
Lesson 5: Equation Roundtable
Topic 3: Systems of Linear Equations
Lesson 11: On Both of the Lines
Lesson 12: Systems of Equations
Lesson 13: Solving Systems of Equations
Unit 4
Lesson 11: Make Them Balance
Lesson 12: Line Zapper

Unit 5: Functions and Volume

Topic 1: Inputs and Outputs 
Lesson 1: Inputs and OutputsUnit 5
Lesson 1: Turtle Crossing
Lesson 2: Guess My Rule
Lesson 2: Introduction to FunctionsUnit 5
Lesson 1: Turtle Crossing
Lesson 2: Guess My Rule
Topic 2: Representing and Interpreting Functions 
Lesson 3: Equations of FunctionsUnit 3
Lesson 1: Turtle Time Trials
Lesson 4: Tables, Equations, and Graphs of Functions
Lesson 5: More Graphs of Functions
Unit 5
Lesson 5: The Tortoise and the Hare
Topic 3: Linear Functions and Rates of Change
Lesson 8: Linear FunctionsUnit 3
Lesson 4: Flags
Lesson 9: Linear ModelsUnit 5
Lesson 5: The Tortoise and the Hare
Topic 4: Cylinder and Cones 
Lesson 13: The Volume of a CylinderUnit 5
Lesson 11: Cylinders
Lesson 14: Finding Cylinder DimensionsUnit 5
Lesson 11: Cylinders
Lesson 15: The Volume of a ConeUnit 5
Lesson 13: Cones
Lesson 16: Finding Cone DimensionsUnit 5
Lesson 13: Cones

Unit 6: Associations in Data

Topic 2: Associations in Numerical Data 
Lesson 3: What a Point in a Scatter Plot MeansUnit 6 
Lesson 3: Robots
Lesson 4: Fitting a LineUnit 6 
Lesson 4: Dapper Cats
Lesson 6: Find the Fit
Lesson 5: Describing Trends in Scatter PlotsUnit 6 
Lesson 3: Robots
Lesson 7: Observing More patterns in Scatter PlotsUnit 6 
Lesson 3: Robots
Topic 3: Associations in Categorical data 
Lesson 9: Looking for AssociationsUnit 6
Lesson 11: Finding Associations
Lesson 10: Using Data Displays to Find associationsUnit 6
Lesson 11: Finding Associations

Unit 7: Exponents and Scientific Notation

Topic 1: Exponent Review 
Lesson 1: Exponent ReviewUnit 7 
Lesson 1: Circles
Lesson 2: Multiplying Powers of 10
Lesson 3: Powers of Powers of 10
Lesson 4: Dividing Powers of 10
Unit 7 
Lesson 3: Power Pairs
Topic 3: Scientific Notation 
Lesson 13: Defining Scientific Notation
Lesson 14: Multiplying, Dividing, and Estimating with Scientific Notation
Unit 7 
Lesson 9: Specific and Scientific
Lesson 11: Balance the Scale
Lesson 15: Adding and Subtracting with Scientific NotationUnit 7 
Lesson 9: Specific and Scientific
Lesson 11: Balance the Scale

Unit 8: Pythagorean Theorem and Irrational Numbers

Topic 1: Side Lengths and Areas of Squares
Lesson 5: Reasoning about Square RootsUnit 8
Lesson 4: Root Down
Topic 2: The Pythagorean Theorem
Lesson 6: Finding Side Lengths of TrianglesUnit 8
Lesson 8: Triangle-Tracing Turtle
Lesson 10: Applications of the Pythagorean TheoremUnit 8
Lesson 10: Taco Truck
Topic 5: Let’s Put It to Work
Lesson 16: When Is the Same Size Not the Same Size?Unit 8
Lesson 10: Taco Truck

Disclaimer

This document is for informational purposes only; references to third-party programs do not imply endorsement or affiliation, and all trademarks are the property of their respective owners.

Grade 6

Module 1: Ratios and Rates

Module 2: Fractions, Decimals, and Percents

Lesson 1: Understand PercentsUnit 3Lesson 8: Lucky Duckies [Free lesson]Lesson 9: Bicycle Goals
Lesson 2: Percents Greater Than 100% and Less Than 1% 
Lesson 3: Relate Fractions, Decimals, and PercentsUnit 5Lesson 2: Decimal Diagrams [Free lesson]Lesson 13: Grocery Prices (Print available)
Lesson 4: Find the Percent of a NumberUnit 3Lesson 10: What’s Missing? (Print available)Lesson 11: Cost Breakdown
Lesson 5: Estimate the Percent of a Number 
Lesson 6: Find the WholeUnit 3Lesson 10: What’s Missing? (Print available)

Module 3: Compute with Multi-Digit Numbers and Fractions

Module 4: Integers, Rational Numbers, and the Coordinate Plane

Lesson 1: Represent IntegersUnit 7Lesson 1: Can You Dig It [Free lesson]Lesson 4: Sub-Zero
Lesson 2: Opposites and Absolute ValueUnit 7Lesson 5: Distance on the Number Line
Lesson 3: Compare and Order IntegersUnit 7Lesson 2: Digging DeeperLesson 3: Order in the Class (Print available) [Free lesson]
Lesson 4: Rational NumbersUnit 7Lesson 2: Digging Deeper
Lesson 5: The Coordinate PlaneUnit 7Lesson 9: Sand Dollar SearchLesson 10: The A-maze-ing Coordinate Plane
Lesson 6: Graph Reflections of Points
Lesson 7: Absolute Value and DistanceUnit 7Lesson 5: Distance on the Number Line

Module 5: Numerical and Algebraic Expressions

Module 6: Relationships in Geometry

Module 7: Relationships Between Two Variables

Module 8: Area

Module 9: Volume and Surface Area

Module 10: Statistical Measures and Displays

Grade 7

Module 1: Proportional Relationships

Module 2: Solve Percent Problems

Module 3: Operations with Integers

Module 4: Operations with Rational Numbers

Module 5: Simplify Algebraic Expressions

Module 6: Write and Solve Equations

Lesson 1: Write and Solve One-Step EquationsUnit 6Lesson 3: EquationsLesson 4: Seeing Structure (Print available)Lesson 14: Unbalanced HangersLesson 15: BudgetingLesson 16: Shira the Sheep [Free lesson]Lesson 17: Write Them and Solve Them (Print available)
Lesson 2: Solve Two-Step Equations: px + q = r
Lesson 3: Write and Solve Two-Step Equations: px + q = r
Lesson 4: Solve Two-Step Equations: p(x + q) = r
Lesson 5: Write and Solve Two-Step Equations: p(x + q) = r
Unit 6Lesson 4: Seeing Structure (Print available)Lesson 6: Balancing EquationsLesson 7: Keeping It True (Print available)Lesson 12: Community Day (Print available)Practice Day 1 (Print available)

Module 7: Write and Solve Inequalities

Lesson 1: Solve One-Step Addition and Subtraction Inequalities
Lesson 2: Write and Solve One-Step Addition and Subtraction Inequalities
Lesson 3: Solve One-Step Multiplication and Division Inequalities
Lesson 4: Solve One-Step Multiplication and Division Inequalities with Negative Coefficients
Unit 6Lesson 14: Unbalanced HangersLesson 15: Budgeting (Print available)Lesson 16: Shira the SheepLesson 17: Write Them and Solve Them (Print available)
Lesson 5: Write and Solve One-Step Multiplication and Division InequalitiesUnit 6Lesson 15: Budgeting (Print available)
Lesson 6: Write and Solve Two-Step InequalitiesUnit 6Lesson 15: Budgeting (Print available)Lesson 16: Shira the Sheep [Free lesson]Lesson 17: Write Them and Solve Them (Print available)Practice Day 2 (Print available)

Module 8: Geometric Figures

Module 9: Measure Figures

Module 10: Probability

Lesson 1: Find Likelihoods
Lesson 2: Relative Frequency of Simple Events
Lesson 3: Theoretical Probability of Events
Unit 8Lesson 1: How Likely? (Print available) [Free lesson]Lesson 2: Prob-bear-bilities [Free lesson]Lesson 3: Mystery Bag
Lesson 4: Compare Probabilities of Simple EventsUnit 8Lesson 4: Spin ClassLesson 5: Is It Fair?
Lesson 5: Probability of Compound EventsUnit 8Lesson 6: Fair GamesLesson 7: Weather or NotLesson 8: Simulate It
Lesson 6: Simulate Chance EventsUnit 8Lesson 8: Simulate ItPractice Day 1 (Print available)

Module 11: Sampling and Statistics

Grade 8

Module 1: Exponents and Scientific Notation

Module 2: Real Numbers

Lesson 1: Terminating and Repeating DecimalsUnit 8
Lesson 12: Fractions to Decimals
Lesson 13: Decimals to Fractions
Lesson 2: RootsUnit 8
Lesson 2: From Squares to Roots
Lesson 3: Between Squares
Lesson 4: Root Down [Free lesson]
Practice Day 1 (Print available)
Lesson 3: Real NumbersUnit 8
Lesson 14: Hit the Target
Lesson 4: Estimate Irrational NumbersUnit 8
Lesson 3: Between Squares
Lesson 5: Compare and Order Real NumbersUnit 8
Lesson 14: Hit the Target

Module 3: Solve Equations with Variables on Each Side

Module 4: Linear Relationships and Slope

Module 5: Functions

Module 6: Systems of Linear Equations

Lesson 1: Solve Systems of Equations by GraphingUnit 4 
Lesson 9: On or Off the Line?
Lesson 10: On Both Lines
Lesson 11: Make Them Balance [Free lesson]
Lesson 12: Line Zapper
Lesson 13: All, Some, or None? Part 2
(Print available)Practice Day 2 
Lesson 2: Determine Number of SolutionsUnit 4 
Lesson 13: All, Some, or None? Part 2
Lesson 3: Solve Systems of Equations by Substitution
Lesson 4: Solve Systems of Equations by Elimination
Lesson 5: Write and Solve Systems of EquationsUnit 4 
Lesson 14: Strategic Solving, Part 2 (Print available)

Module 7: Triangles and the Pythagorean Theorem

Lesson 1: Angle Relationships and Parallel LinesUnit 1 Lesson 10: Transforming Angles
Lesson 2: Angle Relationships and TrianglesUnit 1 Lesson 10: Transforming Angles Lesson 11: Tearing It Up (Print available)Lesson 12: Puzzling It Out [Free lesson]
Lesson 3: The Pythagorean TheoremUnit 8Lesson 6: The Pythagorean TheoremLesson 7: Pictures to Prove It
Lesson 4: Converse of the Pythagorean TheoremUnit 8Lesson 9: Make It Right
Lesson 5: Distance on the Coordinate PlaneUnit 8Lesson 11: Pond HopperPractice day 2 (Print available)

Module 8: Transformations

Module 9: Congruence and Similarity

Lesson 1: Congruence and Transformations
Lesson 2: Congruence and Corresponding Parts
Unit 1 Lesson 7: Are They the Same?Lesson 9: Are They Congruent?
Lesson 3: Similarity and TransformationsUnit 2Lesson 5: Transformations Golf with DilationsLesson 6: Social Scavenger Hunt (Print available) [Free lesson]
Lesson 4: Similarity and Corresponding PartsUnit 2Lesson 7: Are Angles Enough?Lesson 8: Shadows
Lesson 5: Indirect MeasurementUnit 2Lesson 8: Shadows

Module 10: Volume

Lesson 1: Volume of CylindersUnit 5Lesson 10: Volume LabLesson 11: Cylinders [Free lesson]Lesson 12: Scaling Cylinders
Lesson 2: Volume of ConesUnit 5Lesson 10: Volume LabLesson 13: Cones [Free lesson]Lesson 14: Missing Dimensions (Print available)
Lesson 3: Volume of SpheresUnit 5Lesson 15: Spheres
Lesson 4: Finding Missing DimensionsUnit 5Lesson 14: Missing Dimensions (Print available)
Lesson 5: Volume of Composite SolidsUnit 5Lesson 15: Spheres

Module 11: Scatter Plots and Two-Way Tables

Grade 6

Chapter 1: Use Positive Rational Numbers

enVision MathDesmos Math 6–A1
Lesson 1: Fluently Add, Subtract, and Multiply DecimalsUnit 5
Lesson 1: Dishing Out Decimals (Print available) [Free lesson]
Lesson 2: Decimal Diagrams [Free lesson]
Lesson 3: Fruit by the Pound
Lesson 4: Missing Digits
Lesson 5: Decimal Multiplication
Lesson 12: Budget Vehicles (Print available)
Practice Day 1 (Print available)
Lesson 2: Fluently Divide Whole Numbers and DecimalsUnit 5
Lesson 8: Division Diagrams
Lesson 9: Long Division Launch (Print available)
Lesson 10: Return of the Long Division (Print available)
Lesson 11: Movie Time [Free lesson]
Lesson 12: Budget Vehicles (Print available)
Practice Day 2
Lesson 3: Multiply FractionsUnit 4
Lesson 12: Puzzling Areas (Print available) [Free lesson]
Lesson 13: Volume Challenges
Lesson 14: Planter Planner (Print available)
Lesson 4: Understand Division with FractionsUnit 4
Lesson 1: Cookie Cutter
Lesson 2: Making Connections (Print available)
Lesson 3: Flour Planner [Free lesson]
Lesson 4: Flower Planters
Practice Day (Print available)
Lesson 5: Divide Fractions by fractionsUnit 4
Lesson 5: Garden Bricks (Print available)
Lesson 7: Break It Down
Lesson 8: Potting Soil
Lesson 9: Division Challenges
Lesson 14: Planter planner (Print available)
Practice Day (Print available)
Lesson 6: Divide Mixed NumbersUnit 4
Lesson 5 Garden Bricks (Print available)
Lesson 6 Fill the Gap [Free lesson]
Lesson 11 Classroom Comparisons
Lesson 7: Solve Problems with Rational NumbersLesson 3: Flour Planner [Free lesson]
Lesson 4: Flower Planters
Lesson 5: Garden Bricks (Print available)
Lesson 10: Swap Meet (Print available)

Chapter 2: Integers and Rational Numbers

Lesson 1: Understand IntegersUnit 7
Lesson 1: Can You Dig it In [Free lesson]
Lesson 4 Sub-Zero
Lesson 2: Represent Rational Numbers on the Number LineUnit 7
Lesson 2: Digging Deeper
Lesson 3: Order in the Class (Print available) [Free lesson]
Practice Day 1
Lesson 3: Absolute Values of Rational NumbersUnit 7
Lesson 5: Distance on the Number Line
Practice Day 1 (Print available)
Lesson 4: Represent Rational Numbers on the Coordinate Plane 
Lesson 5: Find Distances on the Coordinate Plane
Lesson 6: Represent Polygons on the Coordinate Plane
Unit 7
Lesson 11: Polygon Maker

Chapter 3: Numeric and Algebraic Expressions

Chapter 4: Represent and Solve Equations and Inequalities

Lesson 1: Understand Equations and SolutionsUnit 6
Lesson 1: Weight for It [Free lesson]
Lesson 3: Hanging Around
Lesson 13: Turtles All the Way
Lesson 2: Apply Properties of Equality
Lesson 3: Write and Solve Addition and Subtraction Equations
Lesson 4: Write and Solve Multiplication and Division Equations
Unit 6
Lesson 3: Hanging Around
Lesson 4: Hanging It Up
Lesson 5: Swap and Solve (Print available)
Practice Day 1 (Print Available)
Lesson 5: Write and Solve Equations with Rational NumbersUnit 6
Lesson 4; Hanging It Up
Lesson 5: Swap and Solve (Print available)
Lesson 6: Understand and Write InequalitiesUnit 7
Lesson 6: Tunnel Travel [Free lesson]
Lesson 7: Comparing Weights
Lesson 7: Solve InequalitiesUnit 7
Lesson 8: Shira’s Solutions
Lesson 8: Understand Dependent and Independent VariablesUnit 6
Lesson 13: Turtles All the Way
Lesson 9: Use Patterns to Write and Solve Equations
Lesson 10: Relate Tables, Graphs, and Equations
Unit 6
Lesson 13: Turtles All the Way
Lesson 14: Representing Relationships
Lesson 15: Connecting Representations (Print available)
Lesson 16: Subway Fares (Print available) [Free lesson]
Practice Day 2 (Print available)

Chapter 5: Understand and Use Ratio and Rate

Chapter 6: Understand and Use Percent

Lesson 1: Understand PercentUnit 3
Lesson 8: Lucky Duckies [Free lesson]
Lesson 2: Relate Fractions, Decimals, and PercentsUnit 5
Lesson 13: Grocery Prices (Print available)
Lesson 3: Represent Percents Greater Than 100 or Less than 1 
Lesson 4: Estimate to Find Percent 
Lesson 5: Find the Percent of a Number
Lesson 6: Find the Whole Given a Part and the Percent
Unit 3
Lesson 9: Bicycle Goals
Lesson 10: What’s Missing?
Lesson 11: Cost Breakdown
Lesson 12: More Bicycle Goals
Practice Day 2 (Print Available)

Chapter 7: Solve Area, Surface Area, and Volume Problems

Chapter 8: Display, Describe, and Summarize data

Grade 7

Chapter 1: Rational Number Operations

enVision MathDesmos Math 6–A1
Lesson 1: Relate Integers and Their OppositesUnit 5
Lesson 1: Floats and Anchors [Free lesson]
Lesson 2: Understand Rational NumbersUnit 4
Lesson 13: Decimal Deep Dive (Print available)
Lesson 3: Add Integers
Lesson 4: Subtract Integers
Unit 5
Lesson 2: More Floats and Anchors
Lesson 4: Draw Your Own (Print available) [Free lesson]
Lesson 5: Number Puzzles
Lesson 10: Integer Puzzles [Free lesson]
Lesson 11: Changing Temperatures
Lesson 13: Solar Panels and More (Print available)
Lesson 5: Add and Subtract Rational NumbersUnit 5
Lesson 3: Bumpers
Lesson 4: Draw Your Own (Print available) [Free lesson]
Lesson 5: Number Puzzles
Lesson 10: Integer Puzzles [Free lesson]
Lesson 11: Changing Temperatures
Lesson 13: Solar Panels and More (Print available)
Practice Day 1 (Print available)
Lesson 6: Multiply IntegersUnit 5
Lesson 6: Floating in Groups
Lesson 7: Back in Time
Lesson 8: Speeding Turtles
Lesson 10: Integer Puzzles [Free lesson]
Practice Day 2 (Print available)
Lesson 7: Multiply Rational NumbersUnit 5
Lesson 8: Speeding Turtles
Lesson 10: Integer Puzzles [Free lesson]
Lesson 12: Arctic Sea Ice (Print available)
Lesson 13: Solar Panels and More (Print available)
Practice Day 2 (Print available)
Lesson 8: Divide IntegersUnit 5
Lesson 8: Speeding Turtles
Lesson 9: Divide Rational NumbersUnit 5
Lesson 8: Speeding Turtles
Lesson 10: Integer Puzzles [Free lesson]
Lesson 12: Arctic Sea Ice (Print available)
Lesson 13: Solar Panels and More (Print available)
Practice Day 2 (Print available)
Lesson 10 Solve Problems with Rational NumbersUnit 5
Lesson 11: Changing Temperatures
Lesson 12: Arctic Sea Ice (Print available)
Lesson 13: Solar Panels and More (Print available)

Chapter 2: Analyze and Use Proportional Relationships

Lesson 1: Connect Ratios, Rates, and Unit Rates 
Lesson 2: Determine Unit Rates with Ratios of Fractions 
Lesson 3: Understand Proportional Relationships: Equivalent RatiosUnit 2
Lesson 1: Paint [Free lesson]
Lesson 2: Balloon Float
Lesson 4: Describe Proportional Relationships: Constant of ProportionalityUnit 2
Lesson 3: Sugary Drinks (Print available)
Lesson 4: Robot Factory
Lesson 5: Snapshots
Lesson 6: Two and Two (Print available) [Free lesson]
Lesson 7: All Kinds of Equations
Lesson 10: Three Turtles
Practice Day (Print available)
Unit 3
Lesson 1 Circumference of a Circle
Lesson 5: Graph Proportional RelationshipsUnit 2
Lesson 8: Dino Pops [Free lesson]
Lesson 9: Gallon Challenge
Lesson 10: Three Turtles
Lesson 11: Four Representations (Print available)
Lesson 6: Apply Proportional Reasoning to Solve ProblemsUnit 2
Lesson 11: Four Representations (Print available)
Lesson 12: Water Efficiency

Chapter 3: Analyze and Solve Percent Problems

Chapter 4: Generate Equivalent Expressions

Chapter 5: Solve Problems Using Equations and Inequalities

Chapter 6: Use Sampling to Draw Inferences About Populations

Chapter 7: Probability

Lesson 1: Understand Likelihood and ProbabilityUnit 8
Lesson 1 How Likely? (Print available) [Free lesson]
Lesson 2 Prob-bear-bilities [Free lesson]
Lesson 3 Mystery Bag
Lesson 2: Understand Theoretical Probability
Lesson 3: Understand Experimental Probability
Unit 8
Lesson 4: Spin Class
Lesson 5: Is It Fair?
Lesson 6: Fair Games
Lesson 4: Use Probability ModelsUnit 8
Lesson 6: Fair Games
Lesson 7: Weather or Not
Lesson 8: Simulate It
Lesson 9: Car, Bike, or Train? (Print available)
Lesson 5: Determine Outcomes of Compound EventsUnit 8
Lesson 9: Car, Bike, or Train? (Print available)
Lesson 6: Find Probabilities of Compound Events
Lesson 7: Simulate Compound Events
Unit 8
Lesson 8: Simulate It
Lesson 9: Car, Bike, or Train? (Print available)
Practice Day 1 (Print Available)

Chapter 8: Solve Problems Involving Geometry

Lesson 1: Solve Problems Involving Scale DrawingsUnit 1 Lesson 1: Scaling Machines [Free lesson] Lesson 2: Scaling Robots Lesson 3: Make It Scale Lesson 4: Scale Factor Challenges Lesson 5: Tiles Lesson 6: Introducing Scale Lesson 7: Will It Fit? [Free lesson] Lesson 8: Scaling States Lesson 9: Scaling Buildings Lesson 10: Room Redesign Practice Day 1 Practice Day 2   Unit 3 Lesson 1: Toothpicks   Unit 4 Lesson 3: Sticker Sizes
Lesson 2: Draw Geometric FiguresUnit 7
Lesson 6: Is It Enough?
Lesson 3: Draw Triangles with Given ConditionsUnit 7
Lesson 5: Can You Build It? [Free lesson]
Lesson 6: Is It Enough?
Lesson 7: More Than One
Lesson 8: Can You Draw It?
Practice Day 1
Lesson 4: Solve Problems Using Angle RelationshipsUnit 7
Lesson 1: Pinwheels
Lesson 2: Friendly Angles [Free lesson]
Lesson 3: Angle Diagrams
Lesson 4: Missing Measures [Free lesson]
Lesson 5: Solve Problems Involving Circumference of a CircleUnit 3
Lesson 2: Is It a Circle?
Lesson 3: Measuring Around [Free lesson]
Lesson 4: Perimeter Challenges
Practice Day 1 (Print available) [Free lesson]
Lesson 6: Solve Problems Involving Area of a CircleUnit 3
Lesson 5: Area Strategies
Lesson 6: Radius Squares
Lesson 7: Why Pi?
Lesson 8: Area Challenges [Free lesson]
Lesson 9: Circle vs. Square
Practice Day 2
Lesson 7: Describe Cross SectionsUnit 7
Lesson 9: Slicing Solids
Lesson 8: Solve Problems Involving Surface AreaUnit 7
Lesson 10: Simple Prisms
Lesson 11: More Complicated Prisms
Lesson 12: Surface Area Strategies
Lesson 13: Popcorn Possibilities
Lesson 9: Solve Problems Involving VolumeUnit 7
Lesson 10: Simple Prisms
Lesson 11: More Complicated Prisms
Lesson 13: Popcorn Possibilities
Practice Day 2

Grade 8

Chapter 1: Real Numbers

enVision MathDesmos Math 6–A1
Lesson 1: Rational Numbers as DecimalsUnit 8
Lesson 12: Fractions to Decimals
Lesson 13: Decimals to Fractions
Lesson 2: Understand Irrational NumbersUnit 8
Lesson 14: Hit the Target
Lesson 3: Compare and Order Real Numbers 
Lesson 4: Evaluate Square Roots and Cube RootsUnit 8
Lesson 2: From Squares to Roots
Lesson 3: Between Squares
Lesson 4: Root Down [Free lesson]
Lesson 5: Solve Equations Using Square Roots and Cube RootsUnit 8
Lesson 5: Filling Cubes
Practice Day 1 (Print available)
Lesson 6: Use Properties of Integer ExponentsUnit 7  
Lesson 2: Combining Exponents
Lesson 3: Power Pairs (Print available) [Free lesson]
Lesson 4: Rewriting Powers
Practice Day 1 (Print available)
Lesson 7: More Properties of Integer ExponentsUnit 7  
Lesson 5: Zero and Negative Exponents
Lesson 6: Write a Rule (Print available)
Lesson 8: Use Powers of 10 to Estimate QuotientsUnit 7  
Lesson 7: Scales and Weights
Lesson 8: Point Zapper
Lesson 9: Use Your Powers
Lesson 9: Understand Scientific NotationUnit 7  
Lesson 10: Solar System [Free lesson]
Lesson 11: Balance the Scales [Free lesson]
Lesson 13: Star Power
Practice Day 2 (Print available)

Chapter 2: Analyze and Solve Linear Equations

Lesson 1: Combine Like Terms to Solve EquationsUnit 4
Lesson 2: Keep It Balanced
Lesson 2: Solve Equations with Variables on Both SidesUnit 4
Lesson 3: Balanced Moves
Lesson 4: More Balanced Moves (Print available)
Lesson 3: Solve Multi-Step EquationsUnit 4
Lesson 3: Balanced Moves
Lesson 4: More Balanced Moves (Print available)
Lesson 5: Equation Roundtable (Print available) [Free lesson]
Lesson 6: Strategic Solving (Print available)
Lesson 4: Equations with No Solutions or Infinitely Many SolutionsUnit 4
Lesson 7: All, Some, or None?
Lesson 5: Compare Proportional RelationshipsUnit 3
Lesson 1: Turtle Time Trials [Free lesson]
Lesson 2: Water Tank
Lesson 3: Posters
Lesson 6: Connect proportional Relationships and SlopeUnit 2
Lesson 9: Water Slide
Lesson 10: Points on a Plane
Practice Day 
 
Unit 3
Lesson 2: Water Tank
Lesson 4: Stacking Cups
Lesson 5: Flags [Free lesson]
Lesson 7: Water Cooler
Lesson 8: Landing Planes
Lesson 9: Coin Capture
Lesson 7: Analyze Linear Equations: y = mxUnit 3
Lesson 3: Posters
Lesson 6: Translations
Lesson 8: Understand the y-intercept of a LineUnit 3
Lesson 5: Flags [Free lesson]
Lesson 6: Translations
Lesson 9: Analyze Linear Equations: y = mx + bUnit 3  
Lesson 6: Translations
Lesson 7: Water Cooler
Practice Day 

Chapter 3: Use Functions to Model Relationships

Lesson 1: Understand Relations and FunctionsUnit 5
Lesson 1: Turtle Crossing [Free lesson]
Lesson 2: Guess My Rule [Free lesson]
Lesson 2: Connect Representations of FunctionsUnit 5
Lesson 3: Function or Not?
Lesson 5: The Tortoise and the Hare [Free lesson]
Lesson 3: Compare Linear and Nonlinear FunctionsUnit 5
Lesson 4: Window Frames
Lesson 4: Construct Functions to Model Linear RelationshipsUnit 5
Lesson 6: Graphing Stories
Lesson 7: Feel the Burn (Print available) [Free lesson]
Lesson 8: Charge! (Print available)
Lesson 5: Intervals of Increase and DecreaseUnit 5
Lesson 1: Turtle Crossing [Free lesson]
Lesson 6: Graphing Stories
Lesson 6: Sketch Functions from Verbal DescriptionsUnit 5  
Lesson 6: Graphing Stories

Chapter 4: Investigate Bivariate Data

Lesson 1: Construct and Interpret Scatter PlotsUnit 6  
Lesson 1: Click Battle
Lesson 2: Wing Span
Lesson 3: Robots [Free lesson]
Practice Day 1 (Print available) [Free lesson]
Lesson 2: Analyze Linear AssociationUnit 6  
Lesson 4: Dapper Cats [Free lesson]
Lesson 5: Fit Fights [Free lesson]
Lesson 7: Scatter Plot City
Lesson 3: Use Linear Models to Make PredictionsUnit 6  
Lesson 6: Interpreting Slopes
Lesson 8: Animal Brains
Practice Day 2 (Print available)
Lesson 4: Interpret Two-Way Frequency TablesUnit 6
Lesson 9: Tasty Fruit
Lesson 5: Interpret Two-Way Relative Frequency TablesUnit 6
Lesson 10: Finding Associations [Free lesson]
Lesson 11: Federal Budgets
Practice Day 3

Chapter 5: Analyze and Solve Systems of Linear Equations

Chapter 6: Congruence and Similarity

Chapter 7: Understand and Apply the Pythagorean Theorem

Lesson 1: Understand the Pythagorean TheoremUnit 8
Lesson 6: The Pythagorean Theorem
Lesson 7: Pictures to Prove It
Lesson 8: Triangle-Tracing Turtle [Free lesson]
Lesson 2: Understand the Converse of the Pythagorean TheoremUnit 8
Lesson 9: Make It Right
Lesson 3: Apply the Pythagorean Theorem to Solve ProblemsUnit 8
Lesson 10: Taco Truck [Free lesson]
Practice Day 2 (Print available)
Lesson 4: Find Distance in the Coordinate PlaneUnit 8
Lesson 11: Pond Hopper

Chapter 8: Solve Problems Involving Surface Area and Volume

Lesson 1: Find Surface Area of Three-Dimensional Figures 
Lesson 2: Find Volume of CylindersUnit 5
Lesson 10: Volume Lab
Lesson 11: Cylinders [Free lesson]
Lesson 14: Missing Dimensions (Print available)
Lesson 3: Find Volume of ConesUnit 5
Lesson 13: Cones [Free lesson]
Lesson 14: Missing Dimensions (Print available)
Lesson 4: Find Volume of SpheresUnit 5
Lesson 15: Spheres
Practice Day 2 (Print available)

Grade 6

Chapter 1: Numerical Expressions and Factors

Big IdeasDesmos Math 6–A1
Lesson 1: Powers and ExponentsUnit 6
Lesson 10: Powers
Lesson 11: Exponent Expressions (Print available)
Practice Day 2 (Print available)
Lesson 2: Order of OperationsUnit 6
Lesson 11: Exponent Expressions (Print available)
Lesson 3: Prime Factorization
Lesson 4: Greatest Common FactorUnit 5
Lesson 15: Common factors
Lesson 5: Least Common MultipleUnit 5
Lesson 14: Common Multiples
Practice Day 2 (Print available)

Chapter 2: Fractions and Decimals

Lesson 1: Multiplying FractionsUnit 4
Lesson 12: Puzzling Areas (Print available) [Free lesson]
Lesson 13: Volume Challenges
Lesson 14: Planter Planner (Print available)
Lesson 2: Dividing FractionsUnit 4
Lesson 1: Cookie Cutter
Lesson 2: Making Connections (Print available)
Lesson 3: Flour Planner [Free lesson]
Lesson 4: Flower Planters
Practice Day (Print available)
Lesson 3: Dividing Mixed NumbersUnit 4
Lesson 5: Garden Bricks (Print available)
Lesson 7: Break It Down
Lesson 8: Potting Soil
Lesson 9: Division Challenges
Lesson 14: Planter Planner (Print available)
Practice Day
Lesson 4: Adding and Subtracting DecimalsUnit 5
Lesson 1: Dishing Out Decimals (Print available) [Free lesson]
Lesson 2: Decimal Diagrams [Free lesson]
Lesson 3: Fruit by the Pound
Lesson 4: Missing Digits
Lesson 5: Decimal Multiplication
Lesson 12: Budget Vehicles (Print available)
Lesson 5: Multiplying DecimalsUnit 5
Lesson 1: Dishing Out Decimals (Print available) [Free lesson]
Lesson 2: Decimal Diagrams 
Lesson 3: Fruit by the Pound
Lesson 4: Missing Digits
Lesson 5: Decimal Multiplication
Lesson 12: Budget Vehicles (Print available)
Practice Day 1 (Print available)
Practice Day 2 (Print available)
Lesson 6: Dividing Whole NumbersUnit 5
Lesson 8: Division Diagrams
Lesson 9: Long Division Launch
Lesson 10: Return of the Long Division (Print available)
Lesson 11: Movie Time [Free lesson] 
Lesson 12: Budget Vehicles (Print available)
Lesson 7: Dividing DecimalsUnit 5
Lesson 8: Division Diagrams
Lesson 9: Long Division Launch
Lesson 10: Return of the Long Division (Print available)
Lesson 11: Movie Time [Free lesson] 
Lesson 12:(Print available) Budget Vehicles 
Practice Day 1 (Print available)
Practice Day 2 (Print available)

Chapter 3: Ratios and Rates

Chapter 4: Percents

Chapter 5: Algebraic Expressions and Properties

Chapter 6: Equations

Chapter 7: Area, Surface Area, and Volume

Chapter 8: Integers, Number Lines, and the Coordinate Plane

Chapter 9: Statistical Measures

Chapter 10: Data Displays

Grade 7

Chapter 1: Adding and Subtracting Rational Numbers

Chapter 2: Multiplying and Dividing Rational Numbers

Lesson 1: Multiplying IntegersUnit 5
Lesson 6: Floating in Groups
Lesson 7: Back in Time
Lesson 8: Speeding Turtles
Lesson 10: Integer Puzzles [Free lesson]
Practice Day 2 (Print available)
Lesson 2: Dividing IntegersUnit 5
Lesson 8: Speeding Turtles
Lesson 3: Converting Between Fractions and DecimalsUnit 4
Lesson 13: Decimal Deep Dive (Print available)
Lesson 4: Multiplying Rational NumbersUnit 5
Lesson 7: Back in Time
Lesson 5: Dividing Rational NumbersUnit 5
Lesson 8: Speeding Turtles

Chapter 3: Expressions

Chapter 4: Equations and Inequalities

Chapter 5: Ratios and Proportions

Chapter 6: Percents

Chapter 7: Probability

Chapter 8: Statistics

Chapter 9: Geometric Shapes and Angles

Chapter 10: Surface Area and Volume

Lesson 1: Surface Area of Prisms
Lesson 2: Surface Area of Cylinders
Lesson 3: Surface Area of Pyramids
Unit 7
Lesson 10: Simple Prisms
Lesson 11: More Complicated Prisms
Lesson 12: Surface Area Strategies (Print available)
Lesson 13: Popcorn Possibilities
Lesson 4: Volumes of Prisms
Lesson 5: Volumes of Pyramids
Unit 7
Lesson 10: Simple Prisms
Lesson 11: More Complicated Prisms
Lesson 13: Popcorn Possibilities
Practice Day 2 (Print available)
Lesson 6: Cross Sections of Three-Dimensional FiguresUnit 7
Lesson 9: Slicing Solids

Grade 8

Chapter 1: Equations

Chapter 2: Transformations

Chapter 3: Angles and Triangles

Chapter 4: Graphing and Writing Linear Equations

Chapter 5: Systems of Linear Equations

Lesson 1: Solving Systems of Linear Equations by GraphingUnit 4
Lesson 8: When Are They the Same?
Lesson 9: On or Off the Line?
Lesson 10: On Both Lines
Lesson 11: Make Them Balance [Free lesson]
Lesson 12: Line Zapper [Free lesson]
Practice Day 2 (Print available)
Lesson 2: Solving Systems of Linear Equations by Substitution
Lesson 3: Solving Systems of Linear Equations by Elimination 
Lesson 4: Solving Special Systems of Linear Equations 
Lesson 6: Scale Drawings

Chapter 6: Data Analysis and Displays

Chapter 7: Functions

Lesson 1: Relations and FunctionsUnit 5
Lesson 1: Turtle Crossing [Free lesson]
Lesson 2: Guess My Rule [Free lesson]
Lesson 2: Representations of FunctionsUnit 5
Lesson 3: Function or Not?
Lesson 5: The Tortoise and the Hare [Free lesson]
Lesson 3: Linear FunctionsUnit 5
Lesson 6: Graphing Stories
Lesson 7: Feel the Burn (Print available) [Free lesson]
Lesson 8: Charge! (Print available)
Lesson 4: Comparing Linear and Nonlinear FunctionsUnit 5
Lesson 4: Window Frames
Lesson 5: Analyzing and Sketching GraphsUnit 5  
Lesson 6: Graphing Stories

Chapter 8: Exponents and Scientific Notation

Chapter 9: Real Numbers and the Pythagorean Theorem

Lesson 1: Finding Square RootsUnit 8
Lesson 2: From Squares to Roots
Lesson 3: Between Squares
Lesson 4: Root Down [Free lesson]
Lesson 2: The Pythagorean Theorem
Lesson 3: Finding Cube RootsUnit 8
Lesson 2: From Squares to Roots
Lesson 3: Between Squares
Lesson 4: Root Down [Free lesson]
Lesson 4: Rational Numbers 
Lesson 5: Irrational NumbersUnit 8
Lesson 14: Hit the Target
Lesson 6: The Converse of the Pythagorean TheoremUnit 8
Lesson 9: Make It Right

Chapter 10: Volume and Similar Solids

S3-01: Science as the underdog, and the research behind it

A graphic with the text "Science Connections" and "Amplify" features colorful circles and curved lines on a dark gray background.

Get ready for season 3 of Science Connections: The Podcast!

In our first episode, we unpack the research around our season theme of science as the underdog with Horizon Research, Inc. Vice President Eric R. Banilower and  Senior Researcher Courtney Plumley. Eric and Courtney dive into the research they’ve found and their experiences as former educators to show how science is often overlooked in K–12 classrooms. We discuss how the science classroom compares to other subjects in terms of time and resources, how schools are a reflection of society, and what’s needed to change science and its impact on a larger scale.

We hope you enjoy this episode and explore more from Science Connections by visiting our main page!

DOWNLOAD TRANSCRIPT

Courtney Plumley (00:00):

We asked teachers how much science, professional development, they’ve had in the last three years, and nearly half of elementary teachers said none.

Eric Cross (00:10):

Welcome to Science Connections. I’m your host, Eric Cross. I am super-excited to be kicking off the third season with the show. This entire season will be exploring the theme of science as the underdog. And we’re gonna make the case for science, by showing how and why it can be used more effectively. In the coming episodes, we’re gonna talk about how science can be better integrated into other content areas like literacy and math, and explore some of the benefits that you might not be thinking about good science instruction. But first, science as the underdog. I bet some of you out there feel like science is the underdog in your community at school. I know I have at times. To kick off this season, I’m gonna talk to two people who really studied this question by looking at the state of science instruction across the US. Eric Banilower is Vice President of Horizon Research and Courtney Plumley is Senior Researcher at Horizon Research. Eric was the principal investigator and Courtney an author of the latest in a series of studies called “The National Survey of Science and Mathematics Education.” We’re gonna dive into the findings of their most recent report to see what the data’s showing us. Please enjoy my discussion with Eric Banilower and Courtney Plumley. Courtney, hello. And thank you so much for joining us.

Courtney Plumley (01:25):

Hi Eric. It’s nice to be here.

Eric Cross (01:26):

And Eric, welcome.

Eric R. Banilower (01:27):

We’re thrilled to be here, so thank you for having us.

Eric Cross (01:30):

I was reading through the report. Four hundred…a very thorough report, 471 pages, I think, as I got it?

Eric R. Banilower (01:37):

And that’s only one of the many reports from that study.

Eric Cross (01:40):

Yeah. You all have done your work, so I’m really excited to to talk to you about this. And on this season of the show, we’re exploring the theme of science as the underdog. And I think a lot of our listeners, we feel like science is an underdog either in their school or in their district. But you’ve actually done some research on this, in a 2018 study, “The National Survey of Science and Mathematics Education.” So I wanna talk about this report. But first I was hoping you can kind of set the stage. How did you come to work on this report, and then, big picture, what were you hoping to find out?

Eric R. Banilower (02:10):

So the 2018 study that you just mentioned was actually the sixth iteration of a series of studies dating back to 1977. And we collect data every decade or so—you know, plus or minus a few years. And really, what we’re trying to do is get a snapshot of what the science and math education system looks like in in the nation. So my role grew. I started working at Horizon in about 1998, after teaching high school for five years in California. And then going to graduate school. And right about that time, the company was doing the 2000 iteration of the survey. And I worked on it with the team here at Horizon. And then we did it again in 2012. And I had a much more prominent role in that study, and became the kind of leader of the study. And in 2018, the most recent version, we just did it again. So the goal of this study is really to kind of examine key aspects of the K–12 STEM education system. And the main audience of the work has traditionally been policy makers, researchers, and practitioners who work at the federal, state, and district level.

Eric Cross (03:30):

So this study, you took kind of a sample size, but it’s reflective of trends that we tend to see across the nation as a whole. Would that be fair to say?

Eric R. Banilower (03:38):

Yes, definitely it is. It is a random sample of schools in the country. So we start with a list of all the public and private schools in the nation, and then do a random sample of those schools, and then work really, really hard to recruit schools to agree to be in the study. And that has gotten harder every time we’ve done the study, for many understandable reasons. And then once we have schools on board, we sample teachers within schools. So we don’t even survey every teacher in a school. It’s really a sub-sample. So that we can make inferences about the nation as a whole.

Eric Cross (04:14):

Makes sense. And so Courtney, what did you find out about the time spent on science instruction in US schools?

Courtney Plumley (04:22):

So, I’m gonna talk about elementary teachers to begin with.

Eric Cross (04:26):

Because that was your past life, right?

Courtney Plumley (04:28):

I am a former elementary teacher, yeah. So that’s kind of where my head is. And that’s relatable for me. Right? So we asked teachers, like, how many days of the week or weeks of the year that they teach elementary school. And fewer than 20% teach science every day of the school year. They kind of do one or two things, for the most part. They teach a couple days a week or they teach every day of the week, but only for, like, maybe six weeks, and then they swap with social studies and they kind of do that across the school year. Which is really different from, like, math, right? We also asked elementary teachers, how often do they teach math, and it’s every day of the year. Then we also asked them how many minutes they teach when they’re teaching, and we kind of did the math to figure out, all right, if they taught science every day of the school year, how many minutes would it be in a single day, so that we could make a more comparable comparison with math and ELA. If you were to work it out, how many minutes of science an elementary teacher teaches across the year, and break it down to per day, it’s like 18 minutes for the lower elementary grades, 27 for the upper elementary grades. Which is not a lot. But it’s pretty much an hour a day in math, and 80 plus minutes in ELA. So, a lot less. And then, you know, when I was teaching, the first thing to go was always science, right? If there was an assembly, if there was early release or whatever, that was the first thing to go. So those numbers might even be higher. Just because they aren’t factoring that kind of thing in, too.

Eric Cross (06:05):

So, now I’m curious. That is something that I’ve seen just anecdotally, science being the first thing to go. I feel like I’ve seen that almost…it’s almost become a meme, that I’ve heard that so often. Just in your experience, why do you think that is that huge disparity between the two?

Courtney Plumley (06:26):

Well, I mean, when I was teaching, I was teaching third grade. I had an end-of-grade test in math and ELA for my kids. I didn’t have one in science. So the administration said, “Hey, if you’re gonna drop something, drop something that’s not tested.”

Eric Cross (06:41):

Simple as that. And Eric, you, past life: physics teacher. High school. What did you see? ‘Cause our listeners run the gamut from elementary all the way up to high school. What did you see, as far as relative science instruction in the secondary level?

Eric R. Banilower (07:00):

Sure. You know, secondary is just a whole different situation than elementary. Rght? Because you have departmentalization. I taught science. I didn’t have to teach other subjects. And students had periods, and they still do, sorry, they still have periods, even though it’s been a long time since I taught. And you know, they rotate from one class to another. So all the classes were essentially the same length. So, you know, when I was teaching, it was about 50-minute periods. So in terms of minutes of a class or minutes on a subject, it’s not really different. But what is different is what students are required to take in order to graduate high school. One of the things we asked schools about in this study was how many years of a subject do students have to take in order to graduate? And what we saw was in mathematics, over half the schools in the nation require students to take four years of mathematics to graduate. OK? And the vast majority of the rest, about 44%, require three years in science. Most schools require three years. Very few require four years. And many, or a fair number, still only require two years to graduate. So the expectation of what students are taking is lower in science than it is in mathematics.

Eric Cross (08:20):

So you were seeing the same trend in secondary, essentially.

Eric R. Banilower (08:24):

Yes.

Eric Cross (08:24):

The amount of time devoted to the instruction of science…we’re kind of seeing it mirrored just across K–12 across the board.

Eric R. Banilower (08:33):

That’s correct.

Eric Cross (08:34):

And that’s across the country. ‘Cause the sample size represents teachers from Alaska, Hawaii, the South, SoCal, everywhere. So what’s been the reaction to that number? Like 18 to 20 minutes is…I mean, it’s, it’s half of my lunch at our school. What’s been the reaction to that number since this data has been published?

Eric R. Banilower (08:58):

I don’t know, Courtney, if you want to take that…

Courtney Plumley (09:00):

It’s a lot of what you just did. Like, what??? Like, how is it possible to teach all the things you need to teach in such a little amount of time?

Eric R. Banilower (09:08):

What’s really kind of surprising to me, though — though now that I’ve worked on three iterations of the study, it no longer surprises me, but it did at first — is that these numbers really aren’t changing since we’ve started doing this study. You know, people thought maybe with No Child Left Behind and the increase in accountability, time on science might actually go down, because there was more testing in math and English Language Arts. It didn’t happen. It was pretty much constant, that this has been kind of the state of science education for a long time.

Eric Cross (09:44):

So Eric, if I’m hearing you right: The past studies, we’re not seeing an increase or a decline. This has been this way for how many years, roughly, would you say? Since it’s been studied?

Eric R. Banilower (09:54):

You know, I’d have to go back to the 1977 report to get the numbers, but I’m gonna say since then, it has not changed much, if at all.

Eric Cross (10:03):

So this has kind of been entrenched. This has been the norm for almost for the career of a teacher, almost generationally. We’re looking at anyone who’s been in the highest levels of leadership to someone just entering the classroom, this has been the way it’s always been. This is kind of for many people what they’ve only known.

Eric R. Banilower (10:20):

Right.

Eric Cross (10:21):

Kind of become the norm.

Courtney Plumley (10:21):

We didn’t even have science when I was in elementary school. We had science on a cart that came by, you know, every other week.

Eric Cross (10:28):

Was that like a food truck, but like the science version of it? It shows up and does quick science and takes off?

Courtney Plumley (10:35):

And New York was, I mean — we always watched Voyage of the Mimi. I don’t know if you ever watched that. But that’s what we watched every single time the Science on the Cart came. So it’s like a marine biology show. Ben Affleck was on it when he was a kid.

Eric Cross (10:48):

<laugh> Really? For me it was, Mr. Wizard. For some of my students, even now, Bill Nye. You know, the Bill Nye show or something would come on. So what happens when you look at less wealthy districts? Is there a relationship between community resources and science instruction, or is it pretty much equal no matter what the district resources are, the school’s resources are? Did you see any data there?

Eric R. Banilower (11:12):

Yes. We actually did a lot of disaggregating the data by community type, student demographics in the schools, to look to see whether there were areas of inequities across the country. And, you know, one of the factors we looked at was kind of a measure of socioeconomic status. You know, wealth in the community. By looking at percentage of students eligible for free or reduced-price lunch. And interestingly, in terms of time on science instruction, there is actually not a relationship between income level and how much time is spent at the elementary level on science, which actually surprised us.

Eric Cross (11:54):

Because you might have expected it to be the other way now. And granted, it’s 18 to 20 minutes, there isn’t much more to shave off off of that. But were there other differences, like when you compared those communities? Maybe it wasn’t the amount of science instruction, but was there anything else, like teacher preparedness, resources? Were there anything else that you did see discrepancies in? Or was it equal across the board?

Eric R. Banilower (12:13):

No, unfortunately there, there have been, and still are, a number of areas where community resources are related to pretty substantial differences in educational opportunities that students have. So, you know, we’re talking about the high school science requirements. One of the things that we saw was that high schools in less wealthy communities tend to offer less rigorous science courses than high schools in better-off-financially communities. So they may not be AP courses or second year advanced courses to the same extent that there are in the wealthier communities. That’s one big difference that we saw. Another one was what you were just saying about, sort of, the teachers who teach in these communities. You know, I think that for many years people have had a feeling that the best teachers go to the better off schools because it’s easier to teach there. Well, we see that the schools with the most poverty, they tend to have the newer teachers, who are just starting their career. They tend to have teachers who are less well prepared to teach their subject. And there’s a host of other differences we found. And you know, you mentioned the report being 400 pages. This other report that looks at these differences is also quite long, and, you know, identified a number of areas where there are these disparities in the system.

Eric Cross (13:43):

Well, we appreciate you synthesizing this for us, because this is super-important. And you’ve fleshed out a lot of things. And the fact that it’s driven by data, we as science teachers, we as scientists, being objective, really, really value that. Because this is actually validating a lot of the things that our listeners and myself, we experience anecdotally. But you don’t have a lot of things to network you. And sometimes, when you see this, you wonder if it’s just you, or is are other people experiencing this? And so as you start talking about this data, realizing, oh wow, this is not something in isolation. This is systemic. This is something that’s impacted. And then Eric, what you said about schools that were lower-income, that were under-resourced, and didn’t offer those advanced classes, what are some of the impacts of that, maybe downstream, of doing that? Not having those AP classes? I just kind of wanted to put that out there and ask you.

Eric R. Banilower (14:31):

You know, this is a really…this is a current debate right now, about what the goals of schooling K–12 should be. You know, are all kids meant to go to college? Should there be alternative paths? And you know, I know when I was teaching, I would have students say, “Why do I need to know this? I’m not gonna go into science. I’m not gonna study physics. Why do I need to take this?” And, you know, the answer I used to give them was, “You never know where your life is gonna end up and what opportunities you’ll have. And by having these educational experiences, you have more opportunities available to you. Whether or not you choose to go down those paths, you have opportunities. And when you don’t take this kind of coursework, you know, even if you don’t want to go to college, you limit your potential careers. Because so many careers nowadays require some technical knowledge, some knowledge of science, even if it’s not explicitly a science job. It is embedded in our society now. We are a technological and science-based society.”

Eric Cross (15:37):

It reminds me of something that I’ve told my students, that if you become a scientist, that’s awesome. I love that. But if you don’t, and you want to be a dancer or an actor or a lawyer or anything that may not be directly related to STEM, I want you to choose it because it was a choice, and not a lack of options. So as long as you’re choosing not to go in STEM, and you don’t make that decision because you can’t, or because you weren’t given the opportunity. So that’s how I’ve always had this mindset as a teacher. And I’ve explained it to my students. So if you say, “Cross, you know what I want to do, I wanna be an awesome chef,” which, you know, low-key that’s science, right? <laugh> Molecular gastronomy, we know that. But like, you be the best chef. But as long as you’re being a chef because you choose that, and you’re like, “I love science, but I don’t wanna go that direction,” we’re good.

Eric R. Banilower (16:26):

Right. And if you think about, a lot of social justice issues with pollution and climate change, and you look at which communities are more affected by some of these larger environmental problems and challenges, it tends to be the lower socioeconomic communities, the more poverty-stricken communities have worse water, have worse air quality. And so if, if people from these communities are going to make informed decisions about who they’re gonna vote for, about what policies they’re gonna support, those are science topics that you have to have some understanding in order to make informed decisions in your life.

Eric Cross (17:09):

Courtney, you were one of the Swiss Army Knife teachers. This is how I perceive it for elementary. You had to teach everything. And shout out to all of my elementary school teachers that have to be mathematicians and grammar whizzes and scientists and PE instructors and social emotional, all of those different things. you also looked at teacher preparedness. How did teachers feel about teaching science compared to other subjects like language arts and math? Did you see anything there?

Courtney Plumley (17:39):

We did, we did. And I’m glad you said, “How did they feel about it?” Because one thing that, you know, in a survey you can’t really do is capture how someone actually…how good someone actually…the quality of someone’s instruction. But you can ask them how prepared they feel. And you can even ask them like stats, like, “What did you major in in college?” You know. But you really are going on based on what what they say. So we ask them how prepared they feel to teach all the core subjects. And two-thirds of elementary teachers felt very well prepared to teach reading. They felt very well prepared to teach math. But when it comes to science, it’s less than a third felt very well prepared. And you know, like you said, when you’re teaching elementary school, you’re teaching all the subjects. But also in science, there’s usually four main instructional units in a school year. And they’re all from different science disciplines. So not only are you going on, like, “Maybe in college took a lot of bio classes, but I didn’t take any physics classes, and now I have to teach physics to my kids and I have no experience there.” So, you know, we also ask them how well-prepared they felt in these different disciplines. And the numbers are even smaller, you know. Fewer than a quarter felt very well-prepared in life science. And like 13% felt very well-prepared in physical science. So there’s definitely a big difference between how much teachers feel prepared for ELA and math versus science.

Eric Cross (19:08):

And just from a human perspective, when we don’t feel prepared for something, we’re not really gonna probably lean into it as much as we are into our strengths. Like, that’s just kind of how we are across the board.

Courtney Plumley (19:18):

Yeah.

Eric Cross (19:18):

I’m even like that with my own chores in the house. Or when I have things I need to get done, and I might not be as good at doing those things—it’s gonna be a heavy cognitive load; I’m gonna have to do some background research—I tend to find other areas to excel in. Like, I’m gonna be productive in this other area. I’m gonna really crush it here. But this other thing gets put to the back burner.

Courtney Plumley (19:36):

Totally. And the same reason I might skip science today, <laugh> ’cause it’s scary.

Eric Cross (19:41):

Yeah, exactly. But I love this book. <Laugh> Or we could do this math, and let’s really, really dive deep into it. Now, did you also look at professional development and instructional resources that are being provided?

Courtney Plumley (19:53):

We did.

Eric Cross (19:54):

And on the whole, how was the amount—and I’m seeing a trend here, so I’m kind of feeling like I know where this might go—but I wanted to ask it, did the amount of professional development and resources for science, was there much of a difference between that and other subjects?

Eric R. Banilower (20:10):

Well, I’ll start on this, and Courtney, feel free to jump in. You know, one of the things that we asked was how much kind of discretionary funding do schools devote to science and how much to mathematics? So, for consumables or equipment and supplies or computer software for teachers to use in the classroom. And it’s hard to compare, I think, across subjects because the demands for this kind of supplies, et cetera, is very different, I think, in science than it is in mathematics. Right? We have a lot of, you know, equipment for doing investigations, consumable supplies in science. And those things need to be replenished on a regular basis. It turns out, when we look at the data for school discretionary spending on this kind of stuff, the median school spends less than $2 per student at the elementary level on science, compared to over $6 for mathematics. At the high school level, it’s kind of reversed. Schools spend more money on high school science than they do on high school math. but even still, at the high school, it’s less than $7 per student. Which is not a lot of money being devoted to thinking about all the materials, supplies, chemicals, et cetera, that you need to teach science well, at the high school level. More disturbing is the fact that, you know, we were talking about inequities before, schools that serve less well-off communities spend less than schools that serve wealthier communities, by quite a big amount.

Eric Cross (21:46):

So essentially the per-student thing just kind of popped out to me: So, like, an expensive Starbucks drink is what we’re spending on science per student.

Eric R. Banilower (21:57):

At the high school level. Yes.

Eric Cross (21:58):

At the high school level. And I get those catalogs in the mail, from all of those big science companies. You can’t get much for seven bucks. At least, nothing high-level. And I know I do a lot of 99-cent store science. I go down the street, go to the 99-cent store. Thankfully we could do a lot of awesome science with just, you know, cheap things. But a lot of the higher level experiences, they’re pricey. But the experiences are so rich! And $7 at the high school level is nothing. It’s not much at all.

Eric R. Banilower (22:28):

Yeah. It is definitely, you know, kind of shocking to think about what we’re investing in our children’s future.

Eric Cross (22:37):

Now, just to put you both on the spot, ’cause I feel like that we’ve identified some…we’re seeing a trend here, we’re seeing a pattern. We’re talking about, you know, being science teachers. There’s a pattern going on here. Do you think it’s fair to characterize science as the underdog?

Courtney Plumley (22:52):

I think in elementary school, it is a fair statement. Because, like we said before, I mean they’re gonna preference math and ELA almost all the time. I mean, the other thing you’d asked a little bit ago was about professional development, too. And we do have some data on that. And we ask teachers, you know, how much science professional development they’ve had in the last three years. And nearly half of elementary teachers said none. And I know I didn’t have any science professional development. If I was gonna pick from among the catalog, I was picking one that I needed more, like math. Math and ELA. I keep making that statement, but just over and over, it’s the truth.

Eric Cross (23:31):

And going back to what you said earlier, because that’s where the accountability was, right? And that kind of came top-down.

Courtney Plumley (23:38):

Yes.

Eric Cross (23:38):

And influenced everything else.

Eric R. Banilower (23:40):

Yeah. Now, really interesting thing that we did, a year or so ago, ’cause someone asked us, you know, “Hey, could you look at this?” is we compared elementary science instructional time among states where science counted towards accountability versus states where science doesn’t count towards accountability. And at the upper elementary grades, more time was spent on science in schools in states where they had science accountability. Now I’m not arguing for adding science to accountability systems. But that’s a pretty telling piece of data.

Eric Cross (24:19):

What gets measured gets done.

Eric R. Banilower (24:20):

Yeah.

Eric Cross (24:20):

Or what was getting evaluated was getting done. And that raises, that opens up a myriad of other questions about testing, and what that reveals, and all of those different things. But at the end of the day, what you’re finding is that the things that were getting tested were the things that were getting the priority.

Eric R. Banilower (24:36):

That’s right.

Eric Cross (24:37):

How did we get to this point? And Eric, you said it goes back at least to ’77, but we look at society and we’re…I wanna say we’re post-pandemic, but we’re we’re not. but we’re trying to, we’re trying to get past that. But we’re looking at…we had innovations in biology, we have innovations right now in green energy and electric cars and all of these things that are STEM-based. We know that these are things that have moved humanity forward. And we look at the pipeline of people who are in STEM and we, we see the disparities and things like that. Why was science given less of a priority? I’m just curious. Maybe, Courtney, we could start with you, if you have any ideas. Or Eric. Either one. But how did we get here?

Eric R. Banilower (25:22):

<laugh> I think Courtney wants me to take that one. I’m older so I’ve seen more <laugh>. So, you know, I have the gray hair. She doesn’t. I think it’s complicated. And I know this sounds cliche, but but schools are a reflection of society, right? And, and so science education, you know, if you think back when Sputnik was launched, there became this great demand in America to improve and produce more scientists and engineers in response to this Cold War threat. Right? And then in the ’80s there was rising, oh, the gathering storm was an economic argument that we needed to increase science and math, you know, education and people going into those fields in order to compete economically against the global competitors. And I think that America has always produced a fair number, a large number, of high-quality scientists and engineers, you know. And we still lead the world in many ways. But where we’ve identified as a problem is who has those opportunities to go into those fields. You know, it used to be a very select, a very male-dominated, white male-dominated field. Right? And other people didn’t have the opportunity, or they were shown the way out pretty early. And we, I think, have come to realize as a country that, you know, the, the greater the diversity of thought that we can get into these discussions, the more innovative we can be and the more productive as a society we can be. And so I think we’ve had this shift in the country to, instead of thinking about just the quality for the select few, but to be thinking about the quality for everyone. And so that makes it seem like some of these challenges are greater than they used to be. And I think they’re different challenges, right? We’ve evolved as a society and I think schools have evolved.

Eric Cross (27:40):

There is a conversation I was in on a plane with a person who was a materials manager for a company that made the adhesive for sandpaper. And we were flying…I was flying to Denmark and he was flying to some other Scandinavian country. And we were just talking about it. And he came from another industry, and somehow the conversation led to science. I don’t know how that happened. But somehow I just started talking about science and I asked him about, Eric, kind of what you said about the US kind of leading the way in science innovation versus the rest of the world. And I asked him why. And he said one of the reasons why is because the heterogeneous thought. The different groups of people that are coming to a problem actually create more innovative and novel solutions. Versus when it’s more homogeneous. And everyone’s either culturally or just for whatever reason, kind of thinks a certain way. While they might have a more efficient way, the variety of solutions are not as varied and not as novel. I was reminded of that story based on what you just said. So it’s really interesting. So it seems to be that it benefits if we have more heterogeneous groups, more folks who are contributing to STEM, because that’s gonna be solving the next problem more efficiently. Or I guess maybe in my head it seems like the next we need…we do really well when we have a dragon to slay. I mean, it seems like we come together when that’s the case, right? Like, I dunno.

Eric R. Banilower (29:06):

No, I think that’s…I think that’s accurate.

Eric Cross (29:09):

Later on the season of the podcast, we’re gonna explore ways to better integrate science with other subjects like literacy and math. Were you able to study at all any more integrated approaches to science instruction? Does any of your research support that approach?

Courtney Plumley (29:25):

Not on the national survey, we didn’t study that. And it’s something that we’ve talked about before, because it’s difficult to get teachers to…we were talking about instructional time. It’s hard for teachers to put a number on it when they’re integrating, because, you know, it’s not like I have my science block from 3 to 3:30 anymore. Now it’s kind of scattered about. But it’s something that has been in the ether. We’ve been looking at it in a couple of projects. So there’s some evidence that it can be effective, especially for getting more, you know…the idea is you can get more time for science if you are integrating with other subjects. But one thing to kind of caution is like, students need to have opportunities to learn each discipline when they’re doing integrated instruction. So you don’t wanna just have, like, math in your science. Kids already know to just, like, support it. Then it’s hard to take time from math to put it into science when they’re not actually learning anything new. That’s the easy thing to do, though, is say, “Oh, my kids already know how to measure. We did that in a previous unit. So now we’ll we’ll do it as part of our science instruction.” So it’s a lot of work to make it so they’re learning something new, mathematics and science, at the same time. And it’s not really something that we think that teachers should be having to do on their own, with all the other things that teachers have to do. The last thing they need to do is be creating their own, you know, curriculum. Something that’s already…you know, it’s not straightforward. So we’ve been talking about it, we think it’s really something that instructional materials maybe need to be focusing on instead of teachers having to do that on their own,

Eric Cross (31:01):

Teachers would implement it, but asking them to create it is a whole different thing, and it’s a huge ask.

Courtney Plumley (31:08):

Yes.

Eric Cross (31:08):

Yeah. And, did I hear you right? So the ideal situation would’ve been the students learning a newer math concept, but embedded in a science kind of context? Or was that the better way? Versus, “I’m gonna take a math concept they already know and then just put it into the science setting?”

Courtney Plumley (31:26):

Well, if the idea is that you can get more science time if you’re, you know, integrating things, so you can maybe take time away from a specific math block by putting it with science, or whatever, then if the math is something that the kids already know, now you’re just taking away. I think that that has to be new in both cases, in order to justify having more time.

Eric Cross (31:49):

Right. Eric, in the secondary level, any thoughts on that? On integrating these disciplines together?

Eric R. Banilower (31:56):

I think, you know, just like at the elementary level, it can be challenging to do it well. When I taught, I taught my last couple years in a kind of school-within-a-school kind of situation, where our goal was to try to integrate science, mathematics, and language arts. And it’s hard to do that in a meaningful way. And we did not have curriculum materials given to us to help us do this. We were trying to figure out how to do this on our own, while we were teaching 200 kids a day in our subjects. Right? And five preparations. And you know, it’s a big ask of any teacher. And there are teachers who thrive on this and are great at this. And, you know, that’s one thing I wanna, make clear: our data is about the system, and we are former teachers. Almost everyone who works at Horizon is a former teacher. We have the greatest respect for teachers and what they do. And what our data is showing is are kind of like areas where the system isn’t providing teachers and their students the opportunities to do great things. I think at the high school level, there has been this idea of project-based learning where students are bringing together different skills, different ideas from across disciplines. And I think there’s, again, a lot of potential in doing that. But trying to develop those experiences so that they are doing service to the different subjects, so students are learning what they’re supposed to learn in English Language Arts, that they’re learning, important mathematics, and that this is in a science context, where they are getting to do and understand what science is and how science, as a discipline, operates…that’s just a really hard thing to develop.

Eric Cross (33:53):

So what I’m hearing—and I really appreciate the nuance in this, because it’s not a simple “Yes. Integrated is better,”—I’m hearing “Yes. Quality control.” “Yes. It needs to be written not by teachers; they’re the practitioners.” It’s “Yes. And,” not just simply binary. Which…it’s so easy to wanna chunk things and say yes or no on things. But this one seems a much more nuanced approach. And in a future episode, you mentioned project-based learning, we’re gonna try and talk to people who have thoughts on this. And I really appreciate that you talked about project-based learning, because also, how do you evaluate that? How do you evaluate whether or not it is high quality? Is this is something I see? You know, high-quality standards, highest quality science teaching, highly qualified teachers. It’s something that I see often. Now, based on all your research, this is kind of the 30,000-foot view. What advice might you have for people who are thinking about changing the way science is taught in this country? Which hasn’t changed since 1977, at least since we’ve been measuring it. Any advice for people who do want to act? Another way to ask, it might be, if you were given a magic wand, <laugh>, you have all power, what might you do if you can control the entire vertical system?

Eric R. Banilower (35:07):

Yeah, so a clarification, I do think science instruction has changed. It has evolved. I think there’s a lot of really good things going on in different pockets of the country. One of the challenges is bringing those good ideas and good practices to scale. Right? There are approximately 1.2 million teachers of science K–12 in this country. That’s a lot of people. And about 80% of those are elementary teachers who are responsible for teaching other subjects as well. So my thinking is often about, “How do we take what we know and that we’ve learned through decades of research is effective, and impact a large number of teachers, and therefore a large number of students?” And you know, Courtney I think has hinted at this already. And you’ve mentioned it too, Eric, is that teaching is a profession, right? And it’s a craft. But in no other profession do practitioners have the expectation that they’re developing their own tools and methods for their work. I know when I was in my teacher preparation program, and it’s still extremely common, one of the assignments perspective teachers are given is to develop a unit and develop a lesson, right? You don’t have doctors being asked to develop new treatments and new tests to use. Their job is to get to know their patient, assess what’s going on, and then using research-based methods to develop a plan of action, right? And I think that analogy works really well in education and is a way that we could have a scalable approach for kind of raising the floor across the country for the quality of science education. Giving teachers research-based materials, high-quality instructional materials, that they can then use and adapt to meet the needs of their students, would allow them to focus on getting to know their students, seeing what their strengths are, seeing where they have room for growth, and using the materials they’re given to help those students progress. And I think that is definitely a way where we could have a big impact at a large scale.

Eric Cross (37:39):

Courtney, same question: Magic wand, all power. You can change systems from the elementary perspective. What would you do? I’m assuming part of it’s gonna be changing that 18 to 20 minute time. But even for that to happen, what would you do? What would you change?

Courtney Plumley (37:57):

Well, I don’t know. Like, for it to change, I don’t know the answer to that. But yes, increasing the time would be great. And like Eric was saying, giving teachers— ’cause again, I’m coming in, not enough probably background in science—and then, you know, when I was, when I was teaching, we had one set of textbooks for the entire grade. Six classes, right? Like, share them. But third graders aren’t gonna read textbooks anyway, right? So instead I’m going to the teacher store. I’m pulling things off the shelf. And like, “OK, yeah, sure, I’ll use this.” And nowadays, teachers are going to Teachers Pay Teachers or whatever. Because I didn’t have anything good to use. So like Eric is saying, if I had instructional materials that were good instructional materials that were gonna teach my kids, that they were gonna be engaged, that they weren’t sitting and listening to science, but they were doing science, you know, and I had professional development to actually help me do it? That’s what I think we need to have. And I mean, I know there are some people out there that are working on that, but it’s not a lot. I mean, if you look at Ed Reports, they rate how well-aligned science curriculum are to standards. And there are two right now that have Ed Reports green lights. There’s Amplify and there’s OpenSciEd. You know, so there’s not much out there for teachers to use. And, so it’s hard. It’s hard. Where am I gonna go and get this stuff if it doesn’t exist? And so I’m making it up by myself. Which we already said is not the best use of teachers’ time, when they’ve got so many other demands on their time.

Eric Cross (39:27):

Eric and Courtney, listening to both of your responses, it created a visual in my mind. And Eric, I loved your analogy of…I started thinking of a chef, a welder, and a farmer. And I thought about the chef saying like, “You’re a great chef! Now, can you go farm, and make your own food, so that you can cook it?” Or the welder who has to make his own welding tools and go smelting. You know, making the different rods. I’m not a welder. But you know, all those different parts. Or the farmer who has to build his own tractor and innovate all that stuff. You’re absolutely right, the way you articulated that. And then Courtney, you essentially said, “Give them the tools and then teach them how to use it so they can go and actually be effective with it, because you’re in front of kids doing so many different things.” There’s only so much time in the day, and teachers want to do these things; they want to, but you end up having to triage when you’re asked to. Going back to Eric’s analogy, if you’re in the ER, but you’re also creating the vaccines and you’re also doing the research on which types of vaccines are gonna be the most effective, that’s, that’s a lot to ask. And so, I appreciate both your responses on that. Now, last question, what are you both working on now? This report came out in 2018. What’s, what’s next on the horizon? Actually literally, that’s no pun intended. <laugh> What’s next? <laugh> What’s next for, for you both? What are you working on?

Eric R. Banilower (40:42):

Well, you know, we would love to do another national survey, in a few years. We have to get funding to do it. And you know, that’s always something that takes effort and isn’t a guarantee. We’ve written grants to do these studies in the past, and there’s also the dealing with the reality of the situation. I think a lot of schools, still coming off the tail end of dealing with Covid, are overwhelmed. And we’ve had a hard time, I mentioned before, recruiting schools, and it gets harder every time, just ’cause they have so much on their plate. And I couldn’t see going to a school now and saying, “Hey, one more thing. Do you mind?” So I think we have to kind of wait a little bit for things to settle down before we can do another one of these studies. It just doesn’t seem feasible right now. But we’d love to in the not-too-distant future. Other than that, Courtney and I actually work on some projects together and some projects not together. One of the things that we’re working on together is a study of a fifth grade science curriculum that was developed by Okhee Lee at NYU and her colleagues, that is both aligned with the NGSS and purposely designed to support multilingual learners in developing both their science knowledge and skills as well as their language skills. And we’ve been working with the crew at NYU to study this curriculum and try to figure out, how well it’s working and under what circumstances. So that’s been a really interesting project that’s going on right now.

Courtney Plumley (42:26):

I recently worked on a report with the Carnegie Corporation in New York that actually I think, compliments what we’ve been talking about a lot. It’s about the status of K–12 education in the US—or science education in the US! <Laugh>—and so as part of that report we interviewed like 50 science education experts across the country. We surveyed teachers, people in the university settings, researchers, and everything to kind of get a little bit more update of the state of science education right now. And so a lot of the things we’ve been talking about, we still are talking about with the people in this report four years later. So, work in progress. <Laugh>

Eric Cross (43:09):

And again, going back to 1977, based on what Eric was saying earlier, we’re looking at these large systems, these systemic changes don’t happen overnight.

Eric R. Banilower (43:20):

That’s right.

Eric Cross (43:21):

It’s very slow-moving.

Eric R. Banilower (43:22):

That’s right. I would say there is progress. I think we’ve learned a lot. We are getting better. Are we there yet? No, we’re not happy with where we are. But I think, you know, I think it’s important to be hopeful about the direction things are going in.

Eric Cross (43:37):

Well-said. I agree. Courtney. Eric, thank you so much for unpacking that report that speaks to, that validates what so many teachers across the country are experiencing. And thank you for your advocacy for high-quality science education and your passion for supporting teachers and being that voice from a data-driven perspective of what teachers experience and then advocating for solutions for them. It’s super-encouraging for me, and I know it’s gonna be really encouraging for a lot of our listeners. So thank you.

Eric R. Banilower (44:10):

Thank you for having us.

Courtney Plumley (44:12):

Yeah. Thank you, Eric.

Eric Cross (44:15):

Thanks so much for listening to my conversation with Eric Banilower, Vice President of Horizon Research, and Courtney Plumley, Senior Researcher at Horizon Research. For much more, check out the show notes for a link to the 2018 National Survey of Science and Mathematics Education. And please remember to subscribe to Science Connections wherever you get podcasts, so that you’re not missing any of the upcoming episodes in Season three. Next time on the show, we’re gonna start laying out the road map for using science more effectively. And we’ll start by looking at the how and the why of integrating literacy instruction.

Susan Gomez Zwiep (44:49):

When we look at Science First and build language development around it, the experience tends to be more authentic and organic.

Eric Cross (44:58):

That’s next time on Science Connections: The Podcast. Thanks so much for listening.

Stay connected!

Join our community and get new episodes every other Wednesday!

We’ll also share new and exciting free resources for your classroom every month!

What Eric R. Banilower says about science

“Our data is showing us places where the system needs to provide teachers and their students the opportunities to do great things.”

– Eric R. Banilower

Vice President of Horizon Research, Inc.

Meet the guests

Eric R. Banilower is a Vice President at Horizon Research, Inc. (HRI), and has worked in education for over 30 years. Eric was previously a high school physics and physical science teacher before he joined HRI in 1997, where he has worked on a number of research and evaluation projects. Most recently, he has been the Principal Investigator of the 2012 and 2018 iterations of the National Survey of Science and Mathematics Education, a nationally representative survey focusing on the status of the K–12 STEM education system.

A middle-aged man with light hair, glasses, and a short beard is smiling, wearing a plaid shirt. The photo has a circular frame with a star and decorative lines.

Courtney Plumley is a Senior Researcher at Horizon Research, Inc. She began her career in education as an elementary school teacher before starting at HRI in 2009. In her time at HRI she has worked on many K-12 STEM research and evaluation projects. Most recently, Ms. Plumley has worked with Carnegie Corporation of New York on mapping the landscape of K-12 science education in the US and is managing the field test for the OpenSciEd elementary materials.

A woman with wavy brown hair and a red top smiles at the camera, framed by a circular graphic with a star and accent lines.
A laptop screen displays the “Science Connections: The Community” private group page, with science-themed icons decorating the background and edges.

About Science Connections

Welcome to Science Connections! Science is changing before our eyes, now more than ever. So…how do we help kids figure that out? We will bring on educators, scientists, and more to discuss the importance of high-quality science instruction. In this episode, hear from our host Eric Cross about his work engaging students as a K-8 science teacher. 

Grade 6

Chapter 2: Fractions and Decimals

Big IdeasAmplify Classroom
Lesson 2: Dividing FractionsUnit 4
Lesson 3: Flour Planner
Lesson 4: Adding and Subtracting DecimalsUnit 5
Lesson 1: Dishing Out Decimals
Lesson 2: Decimal Diagrams and Algorithms
Lesson 5: Multiplying DecimalsUnit 5
Lesson 1: Dishing Out Decimals
Lesson 6: Dividing Whole NumbersUnit 5
Lesson 13: Movie Time
Lesson 7: Dividing DecimalsUnit 5
Lesson 13: Movie Time

Chapter 3: Ratios and Rates

Lesson 1: RatiosUnit 2
Lesson 1: Pizza Maker
Lesson 4: Fruit Lab
Lesson 8: Products and SumsTake Away (coming soon!)
Lesson 3: Using Ratio TablesUnit 2
Lesson 10: Disaster Preparation
Lesson 4: Graphing Ratio RelationshipsUnit 2
Lesson 10: Disaster Preparation
Lesson 5: Rates and Unit RatesUnit 3
Lesson 6: Soft Serve
Lesson 6: Converting MeasuresUnit 3
Lesson 1: Many Measurements

Chapter 4: Percents

Lesson 1: Percent and FractionsUnit 3
Lesson 9: Lucky Duckies
Lesson 2: Percent and DecimalsUnit 5
Lesson 2: Decimal Diagrams and Algorithms

Chapter 5: Algebraic Expressions and Properties

Lesson 2: Writing ExpressionsUnit 6
Lesson 8: Products and SumsTake Away (coming soon!)
Lesson 3: Properties of Addition and MultiplicationUnit 6
Lesson 8: Products and SumsTake Away (coming soon!)
Lesson 4: The Distributive PropertyUnit 6
Lesson 8: Products and SumsTake Away (coming soon!)

Chapter 6: Equations

Lesson 1: Writing Equations in One VariableUnit 6
Lesson 1: Weight for It

Chapter 7: Area, Surface Area, and Volume

Lesson 1: Areas of ParallelogramsUnit 1
Lesson 3: Exploring Parallelograms
Exploring Parallelograms, Part 2
Lesson 5: Surface Area of prismsUnit 1
Lesson 10: Renata’s Stickers

Chapter 8: Integers, Number Lines, and the Coordinate Plane

Lesson 1: IntegersUnit 7
Lesson 1: Can You Dig It?
Lesson 2: Comparing and Ordering IntegersUnit 7
Lesson 4: Order in the Class
Lesson 3: Rational NumbersUnit 7
Lesson 4: Order in the Class
Lesson 7: Writing and Graphing InequalitiesUnit 7
Lesson 7: Tunnel Travels

Chapter 9: Statistical Measures

Lesson 1: Introduction to StatisticsUnit 8
Lesson 3: Minimum Wage
Lesson 2: MeanUnit 8
Lesson 11: Toy Cars
Lesson 3: Measures of CenterUnit 8
Lesson 11: Toy Cars
Lesson 4: Measures of VariationUnit 8
Lesson 11: Toy Cars

Chapter 10: Data Displays

Lesson 2: HistogramsUnit 8
Lesson 5: The Plot Thickens
Lesson 4: Choosing Appropriate MeasuresUnit 8
Lesson 3: Minimum Wage
Lesson 11: Toy Cars

Grade 7

Chapter 1: Adding and Subtracting Rational Numbers

Big IdeasAmplify Classroom
Lesson 1: Rational NumbersUnit 5
Lesson 1: Floats and Anchors
Lesson 2: Adding Integers
Lesson 4: Subtracting Integers
Unit 5
Lesson 4: Draw Your Own
Lesson 10: Integer Puzzles
Lesson 3: Adding Rational Numbers
Lesson 5: Subtracting Rational Numbers
Unit 5
Lesson 4: Draw Your Own
Lesson 10: Integer Puzzles

Chapter 2: Multiplying and Dividing Rational Numbers

Lesson 1: Multiplying IntegersUnit 5
Lesson 10: Integer Puzzles

Chapter 3: Expressions

Lesson 1: Algebraic ExpressionsUnit 6
Lesson 10: Collect the Squares
Lesson 2: Adding and Subtracting Linear ExpressionsUnit 6
Lesson 10: Collect the Squares
Lesson 3: The Distributive PropertyUnit 6
Lesson 10: Collect the Squares

Chapter 4: Equations and Inequalities

Lesson 1: Solving Equations Using Addition or Subtraction
Lesson 2: Solving Equations Using Multiplication or Division
Unit 6
Lesson 16: Shira the Sheep
Lesson 4: Writing and Graphing InequalitiesUnit 6
Lesson 16: Shira the Sheep
Lesson 5: Solving Inequalities Using Addition or Subtraction
Lesson 6: Solving Inequalities Using Multiplication or Division
Unit 6
Lesson 16: Shira the Sheep
Lesson 7: Solving Two-Step InequalitiesUnit 6
Lesson 16: Shira the Sheep

Chapter 5: Ratios and Proportions

Lesson 1: Ratio and Ratio TablesUnit 2
Lesson 1: Paint
Lesson 3: Identifying Proportional RelationshipsUnit 2
Lesson 6: Two and Two
Lesson 3: Measuring Around
Lesson 5: Graphs of Proportional RelationshipsUnit 2
Lesson 8: Dino Pops

Chapter 6: Percents

Lesson 1: Fraction, Decimals, and PercentsUnit 4
Lesson 1: Mosaics
 
Lesson 4: Percents of Increase and DecreaseUnit 4
Lesson 5: Percent Machines
Lesson 12: Posing Percent Problems (coming soon!)
Lesson 5: Discounts and MarkupsUnit 4
Lesson 5: Percent Machines
Lesson 12: Posing Percent Problems (coming soon!)

Chapter 7: Probability

Chapter 8: Statistics

Lesson 1: Samples and PopulationsUnit 8
Lesson 10: Crab Island
Lesson 2: Using Random Samples to Describe populationsUnit 8 
Lesson 10: Crab Island
Lesson 3: Comparing Populations
Lesson 4: Using Random Samples to Compare Populations
Unit 8
Lesson 10: Crab Island

Chapter 9: Geometric Shapes and Angles

Lesson 1: Circle and CircumferenceUnit 3
Lesson 3: Measuring Around
Lesson 2: Areas of CirclesUnit 3
Lesson 9: Area Challenges
Lesson 5: Finding Unknown Angle MeasuresUnit 7
Lesson 4: Missing Measures

Grade 8

Chapter 1: Equations

Big ideasAmplify Classroom
Lesson 2: Solving Multi-Step EquationsUnit 4
Lesson 5: Equation Roundtable
Lesson 3: Solving Equations with Variables on Both SidesUnit 4
Lesson 5: Equation Roundtable

Chapter 2: Transformations

Chapter 3: Angles and Triangles

Lesson 2: Angles and TrianglesUnit 1
Lesson 12: Puzzling It Out
Lesson 4: Using Similar TrianglesUnit 2
Lesson 1: Sketchy Dilations
Lesson 2: Dilation Mini Golf

Chapter 4: Graphing and Writing Linear Equations

Lesson 1: Graphing Linear EquationsUnit 3 Lesson 4: Flags
Lesson 2: Slope of a LineUnit 3 Lesson 4: Flags
Lesson 3: Graphing Proportional RelationshipsUnit 3
Lesson 1: Turtle Time Trials
Lesson 4: Graphing Linear Equations in Slope-Intercept FormUnit 3
Lesson 4: Flags

Chapter 5: Systems of Linear Equations

Lesson 1: Solving Systems of Linear Equations by GraphingUnit 4
Lesson 11: Make Them Balance
Lesson 12: Line Zapper

Chapter 6: Data Analysis and Displays

Lesson 1: Scatter PlotsUnit 6
Lesson 3: Robots
Lesson 2: Lines of FitUnit 6
Lesson 4: Dapper Cats
Lesson 3: Two-Way TablesUnit 6
Lesson 11: Finding Associations

Chapter 7: Functions

Lesson 1: Relations and FunctionsUnit 5
Lesson 1: Turtle Crossing
Lesson 2: Guess My Rule
Lesson 2: Representations of FunctionsUnit 5
Lesson 5: The Tortoise and the Hare

Chapter 8: Exponents and Scientific Notation

Lesson 1: ExponentsUnit 7
Lesson 3: Power Pairs
Lesson 2: Products of Powers PropertyUnit 7
Lesson 3: Power Pairs
Lesson 6: Scientific Notation
Lesson 7: Operations in Scientific Notation
Unit 7
Lesson 9: Specific and Scientific
Lesson 11: Balance the Scale

Chapter 9: Real Numbers and the Pythagorean Theorem

Lesson 1: Finding Square RootsUnit 8
Lesson 4: Root Down
Lesson 3: Finding Cube RootsUnit 8
Lesson 4: Root Down

Chapter 10: Volume and Similar Solids

Lesson 1: Volumes of CylindersUnit 5
Lesson 11: Cylinders
Lesson 2: Volumes of ConesUnit 5
Lesson 13: Cones

Algebra 1

Chapter 1: Solving Linear Equations

Lesson 1.1: Solving Simple EquationsWorking Backwards
Lesson 1.3: Solving Equations with Variables on Both SidesSolving Strategies
Same Position
Lesson 1.5: Rewriting Equations and FormulasSubway Seats
Various Variables

Chapter 2: Solving Linear Inequalities

Lesson 2.4: Solving Multi-Step InequalitiesPizza Delivery

Chapter 3: Graphing Linear Functions

Lesson 3.2: Linear FunctionsShelley the Snail
Lesson 3.5: Graphing Linear Equations in Slope Intercept FormFive Representations

Chapter 4: Writing Linear Functions

Lesson 4.4: Scatter Plots and Lines of FitCorrelation Coefficient
How Hot Is It?
City Slopes
Lesson 4.5: Analyzing Lines of FitPenguin Populations
Behind the Headlines
City Data
Residual Fruit
Lesson 4.6: Arithmetic SequencesMore Visual Patterns
Sequence Carnival
Lesson 4.7: Piecewise FunctionsPumpkin Prices

Chapter 5: Solving Systems of Linear Equations

Lesson 5.2: Solving Systems of Linear Equations by SubstitutionShape It Up
Lesson 5.4: Solving Special Systems of Linear EquationsLizard Lines
Lesson 5.7: Systems of Linear InequalitiesQuilts
Seeking Solutions

Chapter 6: Exponential Functions and Sequences

Lesson 6.3: Exponential FunctionsCarlos’s Fish
Lesson 6.6: Geometric SequencesMore Visual Patterns
Sequence Carnival

Chapter 8: Graphing Quadratic Functions

Lesson 8.1: Solving Systems of Linear Equations by SubstitutionCraft-a-Graph
Quadratic Visual Patterns
Lesson 8.4: Solving Special Systems of Linear EquationsOn the Fence
Stomp Rockets
Plenty of Parabolas
Robot Launch
Lesson 8.5: Systems of Linear InequalitiesParabola Zapper
Two for One
Shooting Stars
Lesson 8.6: Systems of Linear InequalitiesPlane, Train, and Automobile
Detroit’s Population, Part 1
Detroit’s Population, Part 2
Revisiting Visual Patterns, Part 1
Sorting Relationships

Chapter 9: Solving Quadratic Equations

Lesson 9.4: Solving Quadratic Equations by Completing the SquareSquare Tactic
Lesson 9.5: Solving Quadratic Equations Using the Quadratic FormulaStomp Rockets in Space

Chapter 10: Radical Functions and Equations

Lesson 10.4: Inverse of a FunctionChip the Robot

Chapter 11: Data Analysis and Displays

Lesson 11.1: Measures of Center and VariationFinding Desmo

Disclaimer

This document is for informational purposes only; references to third-party programs do not imply endorsement or affiliation, and all trademarks are the property of their respective owners.

Families and caregivers, welcome to Amplify Desmos Math California
6–12!

Welcome to the Amplify Desmos Math California Grade 6–12 Caregiver Hub. We’ve designed this space to help you support your student at every stage of their math journey.

In class, your student engages with digital lessons using devices as well as write-in Student Edition books. They also may be assigned digital or print practice outside of class. Below, you’ll find some suggestions and resources for how you can support their learning at home.

Learn more about Amplify Desmos Math California.

Para la versión en español, haga clic aquí.

Ilustración de una persona en silla de ruedas con un casco que dirige la colocación de una pieza triangular, rodeada de símbolos matemáticos.

Caregiver Unit Resources

For every unit of the program, we’ve created a Caregiver Resource that provides a summary of each lesson, plus a problem to try with your student (and an answer key). These resources will be available in both English and Spanish, as well as a glossary of key terms in both languages.

  • Coming soon!
  • Coming soon!

Unit refresh videos

Unit 1

  • Sub-Unit 1a – Calculating the Area of Parallelograms
  • Sub-Unit 1b – Calculating the Area of Triangles
  • Sub-Unit 2 – Determining the Surface Area of Rectangular Prisms

Unit 2

Unit 3

Unit 4

  • Sub-Unit 1 – Dividing Fractions Using Tape Diagrams
  • Sub-Unit 2 – Dividing Fractions Using Common Denominators
  • Sub-Unit 3 – Determining the Volume of Prisms With Fractional Dimensions

Unit 5

  • Sub-Unit 1 – Adding and Subtracting Decimals
  • Sub-Unit 2 – Multiplying Decimals Using Area Models
  • Sub-Unit 3 – Dividing Decimals Using Fractions
  • Sub-Unit 4 – Converting Between Fractions, Percents, and Decimals

Unit 6

  • Sub-Unit 1 – Writing and Solving Equations
  • Sub-Unit 2 – Writing Equivalent Expressions Using the Area Model
  • Sub-Unit 3 – Evaluating Expressions With Exponents
  • Sub-Unit 4 – Interpreting Graphs

Unit 7

  • Sub-Unit 1 – Ordering and Comparing Positive and Negative Numbers
  • Sub-Unit 2 – Identifying Solutions to Inequalities
  • Sub-Unit 3 – Plotting Points on the Coordinate Plane

Unit 8

  • Sub-Unit 1 – Creating Dot Plots
  • Sub-Unit 2 – Calculating Mean Absolute Deviation
  • Sub-Unit 3 – Interpreting Box Plots
  • Sub-Unit 4 – Predicting Population Using Sample Data (For use with Amplify Desmos Math New York)
  • Sub-Unit 5 – Predicting Sample Spaces Using Proportional Relationship (For use with Amplify Desmos Math New York)

Unit 1

  • Sub-Unit 1 – Using Ratios to Determine the Scale Factor Between Scaled Copies
  • Sub-Unit 2 – Using Ratios to Determine Unknown Scales in Scale Drawings

Unit 2

  • Sub-Unit 1 – Determining the Constant of Proportionality
  • Sub-Unit 2 – Writing Equations for Proportional Relationships
  • Sub-Unit 3 – Comparing Proportional Relationships
  • Sub-Unit 4 – Representing Proportional Relationships with Multiple Representations

Unit 3

  • Sub-Unit 1 – Determining the Circumference of a Circle
  • Sub-Unit 2 – Calculating Areas of Complex Shapes

Unit 4

Unit 5

  • Sub-Unit 1 – Adding and Subtracting Positive and Negative Number
  • Sub-Unit 2 – Dividing Integers
  • Sub-Unit 3 – Solving Real-World Problems Involving Positive and Negative Numbers

Unit 6

  • Sub-Unit 1 – Writing Equations from Descriptions and Tape Diagrams
  • Sub-Unit 2 – Solving Equations With Positive and Negative Numbers
  • Sub-Unit 3 – Solving Inequalities

Unit 7

  • Sub-Unit 1 – Determining Unknown Angle Measures
  • Sub-Unit 2 – Determining If Three Segments Form a Triangle
  • Sub-Unit 3 – Calculating the Surface Area of Prisms

Unit 8

  • Sub-Unit 1 – Predicting Sample Spaces Using Proportional Relationships
  • Sub-Unit 2 – Predicting Population Using Sample Data

Unit 1

  • Sub-Unit 1 – Determining Coordinates After a Rotation
  • Sub-Unit 2 – Using Rigid Transformations to Determine if Two Figures on the Grid are Congruent
  • Sub-Unit 3 – Determining Unknown Interior and Exterior Angles

Unit 2

  • Sub-Unit 1 – Performing Dilations on a Square Grid
  • Sub-Unit 2 – Determining Missing Side Lengths in Similar Triangles
  • Sub-Unit 3 – Calculating Slope By Drawing Similar Triangles on a Coordinate Plane

Unit 3

  • Sub-Unit 1 – Writing Equations to Represent Proportional Relationships
  • Sub-Unit 2 – Interpreting Slope and Intercepts of Linear Relationships
  • Sub-Unit 3 – Calculating Slope Given Two Points

Unit 4

  • Sub-Unit 1 – Solve Single-Variable Equations with Parentheses
  • Sub-Unit 2 – Solving Systems of Linear Equations by Graphing

Unit 5

  • Sub-Unit 1 – Justifying Whether a Graph Represents a Function
  • Sub-Unit 2 – Comparing Properties of Linear Functions
  • Sub-Unit 3 – Calculating Volumes of Cylinders

Unit 6

  • Sub-Unit 1 – Interpreting Points on a Scatter Plot
  • Sub-Unit 2 – Using Lines of Fit to Make Predictions
  • Sub-Unit 3 – Calculating Missing Values in Two-Way Tables

Unit 7

Unit 8

  • Sub-Unit 1 – Approximating Square Roots
  • Sub-Unit 2 – Calculating Unknown Side Lengths
  • Sub-Unit 3 – Identifying Rational and Irrational Numbers

Unit 1

  • Sub-Unit 1 – Determining If a Sequence is Arithmetic, Geometric or Neither
  • Sub-Unit 2 – Using Visual Patterns or Terms in the Sequence to Write Explicit Expressions for Arithmetic and Geometric Sequences

Unit 2

  • Sub-Unit 1 – Solving Linear Equations
  • Sub-Unit 2 – Solving Multi-Variable Linear Equations
  • Sub-Unit 3 – Graphing Solutions of Two-Variable Linear Inequalities

Unit 3

  • Sub-Unit 1 – Calculating Values in Two-Way and Relative Frequency Tables
  • Sub-Unit 2 – Comparing Data Using Mean and Standard Deviation
  • Sub-Unit 3 – Interpreting Slope and y-intercept in Context

Unit 4

  • Sub-Unit 1 – Evaluating Function Notation
  • Sub-Unit 2 – Writing Domain and Range with Inequalities
  • Sub-Unit 3 – Graphing Piecewise-Defined Functions
  • Sub-Unit 4 – Writing Recursive Definitions in Function Notation

Unit 5

  • Sub-Unit 1 – Solving Systems of Linear Equations by Substitution
  • Sub-Unit 2 – Graphing Solutions to Systems of Inequalities

Unit 6

  • Sub-Unit 1 – Writing Exponential Functions from Graphs
  • Sub-Unit 2 – Calculating Percent Change in Exponential Functions
  • Sub-Unit 3 – Writing Equivalent Expressions Using Radicals and Rational Exponents
  • Sub-Unit 4 – Writing Exponential Functions Involving Compound Interest

Unit 7

  • Sub-Unit 1 – Describing Key Features of Parabolas
  • Sub-Unit 2 – Graphing Quadratic Functions in Factored Form
  • Sub-Unit 3 – Writing Quadratic Functions in Vertex Form

Unit 8

  • Sub-Unit 1 – Rewriting Factored-Form Expressions in Standard Form
  • Sub-Unit 2 – Solving Quadratic Equations by Graphing
  • Sub-Unit 3 – Solving Quadratic Equations by Completing the Square
  • Sub-Unit 4 – Solving Quadratic Equations Using the Quadratic Formula

Unit 1

  • Sub-Unit 1 – Determining If a Sequence is Arithmetic, Geometric or Neither
  • Sub-Unit 2 – Using Visual Patterns or Terms in the Sequence to Write Explicit Expressions for Arithmetic and Geometric Sequences

Unit 2

  • Sub-Unit 1 – Solving Linear Equations
  • Sub-Unit 2 – Solving Multi-Variable Linear Equations
  • Sub-Unit 3 – Graphing Solutions of Two-Variable Linear Inequalities

Unit 3

  • Sub-Unit 1 – Solving Systems of Linear Equations by Substitution
  • Sub-Unit 2 – Graphing Solutions to Systems of Inequalities
  • Sub-Unit 3 – Writing Equations for Parallel and Perpendicular Lines

Unit 4

  • Sub-Unit 1 – Evaluating Function Notation
  • Sub-Unit 2 – Writing Domain and Range with Inequalities
  • Sub-Unit 3 – Writing Recursive Definitions in Function Notation

Unit 5

  • Sub-Unit 1 – Writing Exponential Functions from Graphs
  • Sub-Unit 2 – Calculating Percent Change in Exponential Functions
  • Sub-Unit 3 – Writing Exponential Functions Involving Compound Interest

Unit 6

  • Sub-Unit 1 – Drawing Perpendicular Bisectors
  • Sub-Unit 2 – Determining Coordinates After a Rotation
  • Sub-Unit 3 – Using Rigid Transformations to Determine if Two Figures on the Grid are Congruent

Unit 7

  • Sub-Unit 1 – Calculating Values in Two-Way and Relative Frequency Tables
  • Sub-Unit 2 – Comparing Data Using Mean and Standard Deviation
  • Sub-Unit 3 – Interpreting Slope and y-intercept in Context

Access Amplify Desmos Math California at home.

Your student will have access to all learning, practice, and assessment materials through the Amplify platform. Students can access the digital curriculum in school and at home by following these simple instructions.

  • Click the Amplify Desmos Math California button.
  • Select Log in with Amplify.
  • Enter the username and password provided by your student’s teacher.
  • Select the desired grade level.

Once logged in, you and your student can view work by opening previous assignments.

Learn how to navigate the student home page.

Support math learning at home.

You can support your student’s math learning outside of school in many ways:

Relate math to daily activities at home, whether you’re baking, grocery shopping, or planning a trip. Your student can help you calculate the prices when you use a coupon, figure out how to cut a recipe in half, or determine the amount of gas you’ll need to make it to your destination.

Invite your student to walk you through how they solved each problem or talk about any parts that were challenging for them. To encourage the use of math language, consider asking, “How do you know?,” “How can you show your thinking?,” or “How would you describe that?” If students get stuck, consider asking questions like, “What information do you know here?” or “How could you represent this problem?”

Emphasize that getting stuck is part of the process and a necessary part of learning. Many students (and adults!) fear making mistakes, but research shows that making mistakes helps your brain grow. When your student gets stuck on a problem, encourage them to try different strategies, even if they think they can’t do it or will get it wrong.

We hope your student enjoys exploring math, working with friends to solve problems, and learning new and interesting concepts. And we hope you enjoy this exciting math journey with them!

Get more information.

Have a question about Amplify Desmos Math California? Visit our Help Library to search for articles with answers to your program questions. For additional support, please contact your student’s teacher.

Welcome Reviewers, to Amplify Desmos Math!

Amplify Desmos Math thoughtfully combines conceptual understanding, procedural fluency, and application. Each lesson is designed to tell a story by posing problems that invite a variety of approaches before guiding students to synthesize their understanding of the learning goals.

Scroll to learn more about the program and explore sample materials.

About the program

We believe in math that motivates. Our structured approach to problem-based learning builds on students’ curiosity to develop lasting grade-level understandings for all students. 

The program thoughtfully combines conceptual understanding, fluency, and application, motivating students with interesting problems they are eager to solve. Teachers can spend more time where it’s most impactful: creating a collaborative classroom of learners.

A powerful suite of math resources

Amplify Desmos Math combines the best of problem-based lessons, intervention, personalized practice, and assessments into a coherent and engaging experience for both students and teachers.

A digital interface displays a math screener report on the left and a math problem involving division, alongside a visual representation of students lined up on the right, integrating rich math resources from Amplify Desmos Math.

Screening and progress monitoring

mCLASS® Assessments, along with daily formative checks, measure not only what students know, but also how they think. The asset-based assessment system provides teachers with targeted, actionable insights, linked to core instruction and intervention resources.

Two side-by-side math activities for children: on the left, a caterpillar-themed block challenge, and on the right, a worksheet for finding pairs that sum to 10. These exercises are fantastic ways to amplify children's engagement with math concepts.

Core instruction

Amplify Desmos Math lessons provide a structured approach to problem-based learning, helping teachers create a collaborative math community with students at its center. Each lesson systematically builds on students’ curiosity to develop lasting grade-level understandings for all students.

Two pages from a New York math textbook on determining coordinates after a rotation. Includes sections on modeled review, guided practice, and teacher's notes, with diagrams and examples that amplify the learning experience.

Differentiation and intervention

Integrated resources like Mini-Lessons, Fluency Practice, and Math Adventures provide targeted intervention on a specific concept or skill connected to daily instruction. Extensions are also available to stretch students’ understanding.
Boost™ Personalized Learning activities help students access grade-level math through engaging, independent digital practice. Responsive Feedback™ adjusts to students’ work, providing item-level adaptivity to further support their learning.

Two pages from a New York math textbook on determining coordinates after a rotation. Includes sections on modeled review, guided practice, and teacher's notes, with diagrams and examples that amplify the learning experience.

An approach that supports teachers

Clear, step-by-step instructional moves help teachers plan and teach student-centered lessons that use student thinking to differentiate instruction and guide to grade-level understanding. They include:

  • Guidance on what to listen for and how to respond.
  • Clear learning objectives to keep learning on track for each activity and lesson.
  • Daily reinforcement activities to provide direct instruction when needed.

A structured approach to problem-based learning

Problem-based learning asks students to make sense of and think strategically about mathematically interesting problems. This approach allows students’ ideas to take
center stage, so they are active and engaged in their learning process. Teachers are able to hear and respond to student thinking in real time, guiding and differentiating instruction right in the moment.

Moving from “I do, We do, You do” to “You do, We do, I do”
Lessons begin by activating student’s prior knowledge and curiosity, inviting them to explore the math, collaborate, and refine their thinking. By focusing on developing student thinking first, teachers can better connect ideas, guide learning, and synthesize learning objectives.

Lessons that are rigorous and delightful

Every lesson in Amplify Desmos Math is designed to put students at the center of their learning. Utilizing research-based best practices, students engage in meaningful work based on rich problems and real-world experiences.

Two young girls build with colorful blocks at a table while an adult woman observes and assists them in a classroom setting.

Warm-Up

Lessons begin by inviting every student to contribute to the mathematical discussion. Instructional routines are often used to build fluency, set the context, activate prior knowledge, or highlight a strategy that may be helpful in the lesson. 

Rich learning activities

Math knowledge is built through experiences and meaningful interactions. Students notice, wonder, explore, calculate, predict, measure, explain their thinking, use math to settle disputes, create challenges for their classmates, and more. Teachers serve as a guide, using a Launch, Monitor, Connect framework:

  • Launch: Teachers offer a short introduction to the problem or challenge
  • Monitor: As students work individually, in pairs, or in groups, teachers ask questions and provide support to move student thinking closer to the intended math goal.
  • Connect: Teachers connect student ideas to the Key Takeaway of the activity to help students synthesize and solidify the big ideas.

Synthesis

Teachers ensure that students end the lesson with accurate and enduring understandings of the math goal through synthesis of student ideas, explicit instruction, and reflection.

A short Show What You Know assessment allows students to show what they know about the learning goals of the lesson and reveal what they are still learning.

Differentiation and practice

Lasting understanding requires reinforcement. Every lesson offers Lesson Practice instructional recommendations to Support, Strengthen, and Stretch learning.

Two side-by-side math activities for children: on the left, a caterpillar-themed block challenge, and on the right, a worksheet for finding pairs that sum to 10. These exercises are fantastic ways to amplify children's engagement with math concepts.

Print for every lesson with engaging digital experiences

Whether in print or digital form, engaging interactions enable students and teachers to openly exchange ideas. Each lesson includes student print materials, interactive teacher Presentation Screens, and digital resources for practice and differentiation. Some lessons also use manipulatives or provide options for students to use devices individually or in pairs. Device recommendations for student use are age-appropriate, with more frequent usage in middle and high school.

Demo access

Please login to the digital platform to experience our full program as part of your review. In order to access the digital platform, you’ll need to log into using your unique login credentials below.

  • Click the orange button below to access the platform.
  • Click “Log in with Amplify.”
  • Enter the username and password:
    • Username:
    • Password:
  • View the video for helpful platform navigation tips.

Assessments

By starting with what students already know, Amplify Desmos Math helps build a strong foundation for success to guide and support future learning. Teachers are empowered to transform every classroom into an engaged math community that invites, values, and develops student thinking. With explicit guidance on what to look for and how to respond, teachers can effectively support students as they develop their understanding.

Open math workbook showing an End-of-Unit Assessment with multiple-choice and written response questions on fractions and equivalent values.

Program assessments

A variety of performance data in Amplify Desmos Math provides evidence of student learning while helping students bolster their skills and understanding.

Unit-Level Assessments

Our embedded unit assessments offer key insights into students’ conceptual understanding of math. These assessments provide regular, actionable information about how students are thinking about and processing math, with both auto-scoring and in-depth rubrics that help teachers anticipate and respond to students’ learning needs.

Lesson-Level Assessments

Amplify Desmos Math lessons are centered around sense-making and in-the-moment feedback. Daily moments of assessment provide valuable evidence of learning for both the teacher and student.

Data and reporting

Amplify Desmos Math provides teachers and administrators with unified reporting and insights so that educators have visibility into what students know about grade-level math—and can plan instruction accordingly for the whole class, small groups, and individual students.

A table displays students' performance levels across various items, with a detailed score distribution for a specific assessment shown in a separate overlay. Geometric design elements accented the background, providing an engaging visual touch ideal for any math classroom using Amplify Desmos Math.

Assessment reports

Reporting functionality integrates unit assessments, lesson assessments, personalized learning, Benchmark assessments, and Progress Monitoring for a comprehensive look at student learning.

Our reports show proficiency and growth by domain, cluster, standard, and priority concept using performance data from unit assessments. Then our reports highlight areas of potential student need to allow teachers to modify their instruction and target differentiated support.

At-a-glance views of unit-level assessment results inform your instructional planning, and you can also drill down to item-level analysis.

Standards reports

Our standards report allows you to monitor proficiency at the class and individual student levels. Proficiency and growth are shown by domain, cluster, standard, and priority concepts. Areas of potential student need are highlighted to allow teachers to modify their instruction and target differentiated support.

Administrator reports

Amplify Desmos Math provides a complete picture of student, class, and district performance, allowing administrators to implement instructional and intervention plans.

  • Track student, class, and district performance with usage, completion, and assessment data.
  • Accurately group students and classes with the Benchmark and Progress Monitoring data of mCLASS Assessments and allow teachers to reliably implement and track the progress of Tier 2 and Tier 3 intervention.
  • Provide one data-driven solution that educators can rely on for high-quality math instruction.

Differentiation and intervention

Amplify Desmos Math views differentiation as an ongoing process where teachers are both reactive and proactive to student needs, ensuring that all students have clear pathways to proficiency. Through rich data and teacher support, Amplify Desmos Math uses flexible categories of intervention and enrichment that adjust daily according to student thinking.

In-the-moment differentiation supports are available for every lesson, both digitally and in the print Teacher Edition.

A teacher sits at a table with two students, using small objects and a workbook to provide individualized instruction during a Boost Math lesson in a classroom with large windows.
A table showing differentiation teacher moves with examples of representing groups in different ways, support prompts, and a stretch question about patterns with more teams.

In-lesson differentiation

Within every lesson activity, teachers can use the suggestions in the Differentiation Teacher Moves table to provide in-the-moment instructional support while students are engaged in the work of the lesson. This table can help teachers anticipate the ways students may approach the activity, and provides prompts that they can use during the lesson to Support, Strengthen, and Stretch individual students in their thinking. Teachers are provided with clear student actions and understanding to look for, each matched with immediately usable suggestions for how to respond to the student thinking illustrated in each row of the table. In addition to using these suggestions in the moment as teachers monitor student work, teachers can review the Differentiation table in advance to help them anticipate how students are likely to approach the activity.

Differentiation: Beyond the Lesson

Teachers are provided with recommendations for resources to use with each group of students needing support, strengthening, and stretching after each lesson. Support, Strengthen, and Stretch resources include:

  • Mini-Lessons: 15-minute, small-group direct instruction lessons targeted to a specific concept or skill
  • Item Banks: Space for teachers to create practice and assessments by using filters and searching for standards, summative-style items, and more
  • Fluency Practice: Adaptive, personalized practice built out for basic operations and more
  • Centers (K–5): Lesson-embedded routines and practice for students that are vertically aligned across grade levels
  • Extensions: Lesson-embedded Teacher Moves including possible stretch questions and activities for students
  • Lesson Practice: Additional practice problems support every lesson
  • Math Adventures: Strategy-based math games where students engage with math concepts and practice skills in a fun digital environment
Two pages from a math workbook on determining coordinates after a rotation, with diagrams, problem sets, and instructional text, displayed on a yellow and gray background.
A classroom teaching guide displays strategies for discussing pre-image and image in math, goals for a parallelogram lesson, and tips for supporting multilingual learners.

Multilingual/English Learner supports

Supports for multilingual/English learners (ML/ELs) are called out at intentiSupports for multilingual/English learners (ML/ELs) are called out at intentional points within each lesson. These suggested supports are specific, targeted actions that are beneficial for ML/ELs. They often describe a modification to increase access to the task or provide support with contextual or mathematical language development that can often be helpful to all learners. ML/EL supports may also be attached to Math Language Routines.onal points within each lesson. These suggested supports are specific, targeted actions that are beneficial for ML/ELs. They often describe a modification to increase access to the task or provide support with contextual or mathematical language development that can often be helpful to all learners. ML/EL supports may also be attached to Math Language Routines.

Math Language Development

Every lesson in Amplify Desmos Math includes opportunities for all students to develop mathematical language as they experience the content. Amplify Desmos Math purposefully progresses language development from lesson to lesson and across units by supporting students in making their arguments and explanations stronger, clearer, and more precise. This systematic approach to the development of math language can be broken down into the following four categories of support:

  • Vocabulary: Units and lessons start by surfacing students’ language for new concepts, then building connections between their language and the new vocabulary for that unit.
  • Language goals: Language goals attend to the mathematics students are learning, and are written through the lens of one or more of four language modalities: reading, writing, speaking, and listening.
  • Math Language Routines: Math Language Routines are used within lessons to highlight student-developed language and ideas, cultivate conversation, support mathematical sense-making, and promote meta-cognition.
  • Multilingual/English learner supports: Supports for multilingual/English learners (ML/ELs) are called out at intentional points within each lesson.
Two girls sit at a table with open books, one making hand gestures while smiling, the other looking at her and giving a thumbs up. Behind them are shelves filled with books, capturing the lively atmosphere of a math classroom.
Digital educational material showing an activity named "Hamster Homes" involving tube length and platform heights for a hamster cage. Includes a diagram with platforms measuring 9 inches.

K-5 sample materials

Click the links in the drop-down sections below to explore sample materials from each grade. For a full program review, please login to the digital platform or request physical samples.

For helpful navigation tips and more program information, download the Amplify Desmos Math Program Guide.

You can also watch a product expert walk through a lesson and the available program components.

Cover of Amplify Desmos Math Grade K Teacher Edition featuring three children playing with math-related objects and a group of rabbits sitting nearby, aligning with the engaging curriculum seen in New York math classrooms.

Teacher Edition

Planning and instructional guidance is visual, organized, and easy-to-follow. To help you preview the program, we have included samples from a complete sub-unit on this site: Unit 2, Sub-Unit 2: Counting and Comparing Images.

Cover of "Amplify Desmos Math: Student Edition Kindergarten," featuring an illustration of three children playing with math-related toys. A group of small white animals, possibly hamsters, play nearby. The scene brilliantly captures the joy of New York math exploration for young learners.

Student Edition

Motivate students with mathematics that is both rigorous and delightful. To help you preview the program, we have included samples from a complete sub-unit on this site: Unit 2, Sub-Unit 2: Counting and Comparing Images.

Cover of "Amplify Desmos Math Grade K Centers Resources" featuring a large, stylized red and pink "C" on a light pink background with simple geometric designs. This distinctive cover complements New York math curriculums with its engaging visual elements.

Ancillary sampler

Included in the ancillary sampler are examples from the program Assessment Resources, Intervention and Extension Resources, Centers Resources, Additional Practice, and Math Language Development Resources.

A digital activity screen, crafted in the style of Amplify Desmos Math, shows two paths with different quantities of mushrooms. The user is prompted to choose the path with more mushrooms. A bear is on the left side of the screen.

In this lesson, students apply their understanding of how to compare groups of images as they determine which group has more or fewer and then compare their strategies by guiding a bear through a path that has more mushrooms than the other.

Children interact with math activities on a large tablet while observing fish illustrations. The text reads "Amplify Desmos Math Grade 1 Teacher Edition, aligned with New York Math standards.

Skills Unit 2 Teacher Guide

Planning and instructional guidance is visual, organized, and easy-to-follow. To help you preview the program, we have included samples from a complete sub-unit on this site: Unit 1, Sub-Unit 1: Adding and Subtracting Within 10.

Illustration of three children engaged in math activities from the "Amplify Desmos Math: Student Edition 1" textbook. One child holds a number card, while the others manipulate counters and images, experiencing an exciting approach inspired by New York math techniques.

Student Edition

Motivate students with mathematics that is both rigorous and delightful. To help you preview the program, we have included samples from a complete sub-unit on this site: Unit 1, Sub-Unit 1: Adding and Subtracting Within 10.

Cover of "Amplify Desmos Math Centers Resources" for Grade 1, featuring a yellow and white 3D letter "C" on a light background.

Ancillary sampler

Included in the ancillary sampler are examples from the program Assessment Resources, Intervention and Extension Resources, Centers Resources, Additional Practice, and Math Language Development Resources.

An educational game screen, inspired by New York math standards, shows a subtraction problem, "4 - 1," with a frog moving along numbered lily pads to reveal the answer "3.

In this lesson, students find differences when subtracting 1 and 2 from the same number by helping a frog reach a lily pad where it can eat a bug.

Cover of the "Amplify Desmos Math" Grade 2 Teacher Edition, showcasing children measuring with rulers and a poster displaying a mathematical equation, set against whimsical scenery with a colorful dragon. Perfect for New York math classrooms.

Teacher Edition

Planning and instructional guidance is visual, organized, and easy-to-follow. To help you review the program, we have included samples from a complete sub-unit on this site: Unit 1, Sub-Unit 1: Adding and Subtracting.

Cover of "Amplify Desmos Math Student Edition 2" showing three children performing a New York math activity with blocks and measurements.

Student Edition

Motivate students with mathematics that is both rigorous and delightful. To help you preview the program, we have included samples from a complete sub-unit on this site: Unit 1, Sub-Unit 1: Adding and Subtracting.

Cover of an educational book titled "Amplify Desmos Math Grade 2 Centers Resources" featuring a green "C" on a light green background, perfect for enhancing New York math education.

Ancillary sampler

Included in the ancillary sampler are examples from the program Assessment Resources, Intervention and Extension Resources, Centers Resources, Additional Practice, and Math Language Development Resources.

An educational activity where users must select the block with the correct number to make a total of 10 using the given block numbers. The UI, inspired by New York math standards, features a caterpillar and two tree stumps to amplify engagement with Desmos Math tools.

Students continue to develop fluency by finding the number that makes 10 by helping a millipede reach its favorite food – a clump of leaves!

Cover of a "Grade 3 Amplify Desmos Math Teacher Edition" book, featuring a cutaway building with diverse students and a teacher working on New York math problems and organizing materials.

Teacher Edition

Planning and instructional guidance is visual, organized, and easy-to-follow. To help you review the program, we have included samples from a complete sub-unit on this site: Unit 1, Sub-Unit 3: Data on Scaled Graphs.

Cover of "Amplify Desmos Math Student Edition 3" showcasing illustrated children engaged in various mathematical activities inside a glass house structure, reflecting the dynamic energy of New York math.

Student Edition

Motivate students with mathematics that is both rigorous and delightful. To help you preview the program, we have included samples from a complete sub-unit on this site: Unit 1, Sub-Unit 3: Data on Scaled Graphs.

Cover of the Amplify Desmos Math Grade 3 Centers Resources book, featuring a 3D letter "C" in blue and white on a minimalistic background, perfect for aligning with New York math standards.

Ancillary sampler

Included in the ancillary sampler are examples from the program Assessment Resources, Intervention and Extension Resources, Centers Resources, Additional Practice, and Math Language Development Resources.

A page titled "Activity 2" features a table showing counts of rabbits, raccoons, and foxes, an image of animal stickers, and a bar graph representing the number of each animal, designed to amplify your New York math lesson with engaging visual data.

Students compare data represented on bar graphs with different scales by using animal stickers to create scaled bar graphs.

Cover of "Amplify Desmos Math: Teacher Edition Grade 4" showing children learning New York Math outdoors, using large mathematical tools and numbers, with one child in a wheelchair.

Teacher Edition

Planning and instructional guidance is visual, organized, and easy-to-follow. To help you review the program, we have included samples from a complete sub-unit on this site: Unit 1, Sub-Unit 2: Using Factors and Multiples.

Cover of "Amplify Desmos Math: Teacher Edition Grade 4" showing children learning New York Math outdoors, using large mathematical tools and numbers, with one child in a wheelchair.

Student Edition

Motivate students with mathematics that is both rigorous and delightful. To help you preview the program, we have included samples from a complete sub-unit on this site: Unit 1, Sub-Unit 2: Using Factors and Multiples.

Cover of the "Amplify Desmos Math" Grade 4 Centers Resources book, featuring a large, stylized blue letter "C" on a light blue background. This essential resource for New York math educators ensures engaging and effective instruction.

Ancillary sampler

Included in the ancillary sampler are examples from the program Assessment Resources, Intervention and Extension Resources, Centers Resources, Additional Practice, and Math Language Development Resources.

Interactive educational activity asking users to determine platform heights using a 3-inch tube. The interface, inspired by Desmos math tools, features a dragging function and feedback system with a checkbox and "Try another" option, amplifying the learning experience.

Students choose tube lengths to connect to platform heights for hamster homes, identifying possible heights using what they know about multiples.

Illustration of three students engaging with various math activities outdoors and around large blocks. Text at the top reads "Amplify Desmos Math, Grade 5, Teacher Edition" - a perfect resource for New York math educators.

Teacher Edition

Planning and instructional guidance is visual, organized, and easy-to-follow. To help you review the program, we have included samples from a complete sub-unit on this site: Unit 1, Sub-Unit 3: Volume of Solid Figures.

Cover of "Amplify Desmos Math: Student Edition, Grade 5" featuring students engaged in various mathematical activities outside, such as block building, measuring, and gardening—a perfect resource aligning with New York math standards.

Student Edition

Motivate students with mathematics that is both rigorous and delightful. To help you preview the program, we have included samples from a complete sub-unit on this site: Unit 1, Sub-Unit 3: Volume of Solid Figures.

Cover image of "Amplify Desmos Math Grade 5 Centers Resources" featuring a large purple letter C on a light purple background, showcasing the innovative approach of Amplify Desmos Math that's making waves in New York math education.

Ancillary sampler

Included in the ancillary sampler are examples from the program Assessment Resources, Intervention and Extension Resources, Centers Resources, Additional Practice, and Math Language Development Resources.

An interactive screen showing an activity about decomposing a figure into prisms, with a touch of Desmos Math integration. The user is asked to drag points to demonstrate the decomposition. Two prism illustrations are displayed, offering a glimpse of New York Math's approach.

Students decompose a figure into rectangular prisms and determine the volume of the figure by adding the volumes of the individual prisms.

6-A1 sample materials

Click the links in the drop-down sections below to explore sample materials from each grade. For a full program review, please login to the digital platform or request physical samples. 

For helpful navigation tips and more program information, download the Amplify Desmos Math Program Guide.

You can also watch a product expert walk through a lesson and the available program components.

A laptop displays a math warm-up activity with shapes and a scale, in front of two Amplify Desmos Math teacher edition books for grades 1 and 7.
Cover of the Grade 6 Amplify Desmos Math Teacher Edition, showcasing students engaging in various mathematical activities around a balance scale with variables, inspired by New York math educational standards.

Teacher Edition

Planning and instructional guidance is visual, organized, and easy-to-follow. To help you preview the program, we have included samples from a complete sub-unit on this site: Unit 6, Sub-Unit 1: Solving Equations.

Cover of “Amplify Desmos Math, Student Edition, Grade 6” featuring an illustration of children engaging in various New York math-related activities outdoors.

Student Edition

Motivate students with mathematics that is both rigorous and delightful. To help you preview the program, we have included samples from a complete sub-unit on this site: Unit 6, Sub-Unit 1: Solving Equations.

Cover image of "Amplify Desmos Math" for Grade 6, featuring a 3D pink letter "I" and the text "Intervention and Extension Resources." This New York math edition supports students with comprehensive resources.

Ancillary sampler

Included in the ancillary sampler are examples from the program Assessment Resources, Intervention and Extension Resources, Additional Practice, and Math Language Development Resources.

A digital math activity shows foxes on a seesaw balanced with 18-pound weights. A multiple-choice question and text box ask for the weight of a fox in pounds.

Students use equations and tape diagrams to represent seesaw situations and to determine unknown animal weights, helping them make connections between diagrams that represent equations of the form `x+p=q` or `px=q`.

Cover image of "Amplify Desmos Math Teacher Edition Grade 7" featuring an illustration of students engaging in math-related activities with geometric shapes and construction elements against a New York cityscape background.

Teacher Edition

Planning and instructional guidance is visual, organized, and easy-to-follow. To help you preview the program, we have included samples from a complete sub-unit on this site: Unit 6, Sub-Unit 3: Inequalities.

Cover of "Amplify Desmos Math, Student Edition, Grade 7" showing students engaged in math activities against a cityscape reminiscent of New York, with purple geometric structures and a crane in the background.

Student Edition

Motivate students with mathematics that is both rigorous and delightful. To help you preview the program, we have included samples from a complete sub-unit on this site: Unit 6, Sub-Unit 3: Inequalities.

Cover of "Amplify Desmos Math: Grade 7 – Intervention and Extension Resources" featuring a stylized 3D "I" on a light purple background, ideal for both New York math and national curricula.

Ancillary sampler

Included in the ancillary sampler are examples from the program Assessment Resources, Intervention and Extension Resources, Additional Practice, and Math Language Development Resources.

A digital math activity screen shows a character above a number line and a box with the inequality "x > -10" entered. A cursor points to the "Edit my response" button.

Students solve inequalities with positive and negative coefficients to solve a variety of challenges featuring a fictional sheep who eats grass according to an inequality.

Illustration of children engaging in learning activities outdoors near a large slide. The title "Amplify Desmos Math Grade 8 Teacher Edition" is shown at the top, highlighting its relevance to New York math curriculum standards.

Teacher Edition

Planning and instructional guidance is visual, organized, and easy-to-follow. To help you preview the program, we have included samples from a complete sub-unit on this site: Unit 6, Sub-Unit 2: Analyzing Numerical Data.

Cover of the "Amplify Desmos Math" Student Edition for Grade 8, featuring students engaging in various mathematical activities in a stylized outdoor New York setting.

Student Edition

Motivate students with mathematics that is both rigorous and delightful. To help you preview the program, we have included samples from a complete sub-unit on this site: Unit 6, Sub-Unit 2: Analyzing Numerical Data.

Cover of "Amplify Desmos Math Grade 8: Intervention and Extension Resources" featuring a stylized "I" on a gray background, tailored for New York math standards.

Ancillary sampler

Included in the ancillary sampler are examples from the program Assessment Resources, Intervention and Extension Resources, Additional Practice, and Math Language Development Resources.

A graph plots four robot colors by height and eye distance; on the right, matching colored robots stand side by side, labeled Red, Purple, Blue, and Green.

Students connect points on a scatter plot with individuals in a population and rows of data in a table. The analysis of scatter plots continues with data about the eye distances and heights of robots.

Cover of "Amplify Desmos Math: Algebra 1, Teacher Edition" featuring diverse characters engaged in mathematical activities, with a graph and a bridge in the background, illustrating the vibrant energy of New York math.

Teacher Edition

Planning and instructional guidance is visual, organized, and easy-to-follow. To help you preview the program, we have included samples from two complete sub-units on this site: Unit 2, Sub-Units 1–2: One-Variable Equations and Multi-Variable Equations.

Cover of "Amplify Desmos Math" Student Edition A1, featuring an illustration of diverse characters engaging in New York math activities against a backdrop of graphs and mathematical concepts.

Student Edition

Motivate students with mathematics that is both rigorous and delightful. To help you preview the program, we have included samples from two complete sub-units on this site: Unit 2, Sub-Units 1–2: One-Variable Equations and Multi-Variable Equations.

Cover of an Amplify Desmos Math Algebra 1 ancillary sampler, featuring students interacting with graphs and mathematical models, including a rocket and a parabola.

Ancillary sampler

Included in the ancillary sampler are examples from the program Assessment Resources, Intervention and Extension Resources, Additional Practice, and Math Language Development Resources.

A math activity screen shows a cartoon snail, purple blocks, and a table comparing blocks and a math equation; a cursor hovers over the "Edit my response" button.

Students represent the solutions of a situation using a table, a graph, and multiple forms of an equation to identify multiple combinations of blocks that can help Shelley the Snail cross a gap.

Eureka Math-NEW

To view this protected page, enter the password below:


Grade 6

Unit 1: Numbers

GO Math!Amplify Classroom
Module 4: Operations with Fractions
Lesson 4.1: Applying GCF and LCM to Fraction OperationsUnit 4
Lesson 6: Fill the Gap
Module 5: Operations with Decimals
Lesson 5.2: Adding and Subtracting DecimalsUnit 5
Lesson 1: Dishing Out Decimals
Lesson 2: Decimal Diagrams and Algorithms
Lesson 5.4: Dividing DecimalsUnit 5
Lesson 13: Movie Time

Unit 2: Number Operations

Module 4: Operations with Fractions
Lesson 4.1: Applying GCF and LCM to Fraction OperationsUnit 4
Lesson 6: Fill the Gap
Module 5: Operations with Decimals
Lesson 5.2: Adding and Subtracting DecimalsUnit 5
Lesson 1: Dishing Out Decimals
Lesson 2: Decimal Diagrams and Algorithms
Lesson 5.4: Dividing DecimalsUnit 5
Lesson 13: Movie Time

Unit 3: Proportionality, Ratios, and Rates

Module 6: Representing Ratios and Rates
Lesson 6.1: RatiosUnit 2
Lesson 1: Pizza Maker
Lesson 6.2: Rates Unit 3
Lesson 6: Soft Serve
Lesson 6.3: Using Ratios and Rates to Solve ProblemsUnit 2
Lesson 4: Fruit Lab
Lesson 10: Disaster Preparation
Module 7: Applying Ratios and Rates
Lesson 7.1: Ratios, Rates, Tables, and GraphsUnit 2
Lesson 4: Fruit Lab
Lesson 10: Disaster Preparation
Unit 3
Lesson 6: Soft Serve
Module 8:  Percents
Lesson 8.1 Understanding Percent.Unit 3
Lesson 9: Lucky Duckies

Unit 4: Equivalent Expressions

Module 10: Generating Equivalent Algebraic Expressions
Lesson 10.1: Modeling and Writing Expressions
Lesson 10.2: Evaluating Expressions
Unit 6
Lesson 8: Products and Sums
Take Away (coming soon!)
Lesson 10.3: Generating Equivalent ExpressionsUnit 6
Lesson 8: Products and Sums
Take Away (coming soon!)

Unit 5: Equations and Inequalities

Module 11:  Equations and Relationships
Lesson 11.1:  Writing Equations to Represent Situations
Lesson 11.2:  Addition and Subtraction Equations
Lesson 11.3:  Multiplication and Division Equations
Unit 6
Lesson 1:  Weight For It
Lesson 11.4: Writing InequalitiesUnit 7
Lesson 7:  Tunnel Travels
Module 12:  Relationships in Two Variables
Lesson 12.2:  Independent and Dependent Variables in Tables and GraphsUnit 6
Lesson 16: Subway Fares
Take Away (coming soon!)
Lesson 12.3:  Writing Equations from Tables.Unit 6
Lesson 16: Subway Fares
Take Away (coming soon!)
Lesson 12.4:  Representing Algebraic Relationships in Tables and GraphsUnit 6
Lesson 16: Subway Fares
Take Away (coming soon!)

Unit 6: Relationships in Geometry

GO Math!Amplify Classroom
Module 13: Area and Polygons
Lesson 13.1: Area of QuadrilateralsUnit 1
Lesson 1: Shapes on a Plane
Lesson 3: Exploring Parallelograms
Exploring Parallelograms, Part 2
Lesson 13.2: Area of TrianglesUnit 1
Lesson 1: Shapes on a Plane
Lesson 13.4: Area of PolygonsUnit 1
Lesson 1: Shapes on a Plane
Module 14:  Distance and Area in the Coordinate Plane
Lesson 14.1: Distance in the Coordinate Plane
Lesson 14.2: Polygons in the Coordinate Plane
Unit 1
Lesson 1: Shapes on a Plane

Unit 7: Measurement and Data

Module 16: Displaying, Analyzing, and
Summarizing Data
Lesson 16.1: Measures of CenterUnit 8
Lesson 11: Toy Cars
Lesson 16.4: Dot Plots and Data DistributionUnit 8
Lesson 3: Minimum Wage
Lesson 16.5: HistogramsUnit 8
Lesson 5: The Plot Thickens

Grade 7

Unit 1: The Number System

GO Math!Amplify Classroom
Module 1:  Adding and Subtracting Integers
Lesson 1.2: Adding Integers With Different Signs
Lesson 1.3: Subtracting Integers
Unit 5
Lesson 1: Floats and Anchors
Lesson 4: Draw Your Own
Lesson 10: Integer Puzzles
Module 2: Multiplying and Dividing Integers
Lesson 2.1: Multiplying Integers Unit 5
Lesson 10: Integer Puzzles
Lesson 2.2: Dividing IntegersUnit 5
Lesson 10: Integer Puzzles
Module 3:  Rational Numbers
Lesson 3.2: Adding Rational Numbers
Lesson 3.3: Subtracting Rational Numbers
Unit 5
Lesson 4: Draw Your Own

Unit 2: Ratios and Proportional Relationships

Module 4:  Rates and Proportionality
Lesson 4.1: Unit RatesUnit 2
Lesson 6: Two and Two
Lesson 4.2: Constant Rates of ChangeUnit 2
Lesson 1: Paint
Lesson 6: Two and Two
Lesson 4.3:  Proportional Relationships and GraphsUnit 2
Lesson 1: Paint
Lesson 6: Two and Two
Module 5:  Proportions and Percent
Lesson 5.1: Percent Increase and DecreaseUnit 4
Lesson 1: Mosaics
Lesson 5: Percent Machines
Lesson 5.3: Applications of PercentUnit 4
Lesson 12: Posing Percent Problems(coming soon!)

Unit 3: Expressions, Equations, and Inequalities

Module 6: Expressions and Equations
Lesson 6.3: Writing Two-Step EquationsUnit 6
Lesson 10: Collect the Squares
Module 6: Expressions and Equations
Lesson 7.2: Writing Two-Step InequalitiesUnit 6
Lesson 16: Shira the Sheep
Lesson 7.3: Solving Two-Step InequalitiesUnit 6
Lesson 16: Shira the Sheep

Unit 4: Geometry

Module 8: Modeling Geometric Figures
Lesson 8.1: Similar Shapes and Scale DrawingsUnit 1
Lesson 1: Scaling Machines
Lesson 7: Will It Fit?
Unit 7
Lesson 5: Can You Build It?
Lesson 8.2: Geometric DrawingsUnit 1
Lesson 7: Will It Fit?
Lesson 8.4: Angle RelationshipsUnit 7
Lesson 2: Friendly Angles
Lesson 4: Missing Measures
Module 9:  Circumference, Area, and Volume
Lesson 9.1: CircumferenceUnit 3
Lesson 3: Measuring Around
Lesson 9.2: Area of CirclesUnit 3
Lesson 8: Area Challenges
Lesson 9.3: Area of Composite FiguresUnit 3
Lesson 8: Area Challenges

Unit 5: Statistics

Module 10: Random Samples and
Populations
Lesson 10.1: Populations and SamplesUnit 8
Lesson 10: Crab Island
Module 11: Analyzing and Comparing Data
Lesson 11.3: Using Statistical Measures to Compare PopulationsUnit 8
Lesson 10: Crab Island

Unit 6: Probability

Module 13: Theoretical Probability and
Simulations
Lesson 13.1: Theoretical Probability of Simple EventsUnit 8
Lesson 1: How Likely?
Lesson 2: Prob-bear-bilities

Grade 8

Unit 1: Real Numbers, Exponents, and Scientific Notation

GO Math!Amplify Classroom
Module 1: Real Numbers
Lesson 1.3: Ordering Real NumbersUnit 8
Lesson 4: Root Down
Module 2: Exponents and Scientific
Notation
Lesson 2.1: Integer ExponentsUnit 7
Lesson 1: Circles
Lesson 3: Power Pairs
Lesson 2.4: Operations with Scientific NotationUnit 7
Lesson 9: Specific and Scientific
Lesson 11: Balance the Scale

Unit 2: Proportional and Nonproportional Relationships and Functions

Module 3: Proportional Relationships
Lesson 3.1: Representing Proportional Relationships.Unit 3
Lesson 1: Turtle Time Trials
Lesson 3.2: Rate of Change and SlopeUnit 3
Lesson 4: Flags
Lesson 5: The Tortoise and the Hare
Module 4: Nonproportional Relationships
Lesson 4.1: Representing Linear Nonproportional RelationshipsUnit 3
Lesson 4: Flags
Lesson 4.2: Determining Slope and y-interceptUnit 3
Lesson 4: Flags
Lesson 4.3: Graphing Linear Nonproportional Relationships using Slope and y-intercept.Unit 3
Lesson 4: Flags
Lesson 4.4: Proportional and Nonproportional SituationsUnit 3
Lesson 1: Turtle Time Trials
Module 5: Writing Linear Equations
Lesson 5.1: Writing Linear Equations from Situations and GraphsUnit 3
Lesson 4: Flags
Lesson 5.3: Linear Relationships and Bivariate DataUnit 6
Lesson 3: Robots
Lesson 4: Dapper Cats
Lesson 6: Find the Fit
Module 6: Functions
Lesson 6.1: Identifying and Representing FunctionsUnit 5
Lesson 2: Guess My Rule
Lesson 5: The Tortoise and the Hare
Lesson 6.3: Comparing FunctionsUnit 5
Lesson 5: The Tortoise and the Hare
Lesson 6.4: Analyzing GraphsUnit 5
Lesson 1: Turtle Crossing
Lesson 5: The Tortoise and the Hare

Unit 3: Solving Equations and Systems of Equations

Module 7:  Solving Linear Equations
Lesson 7.1: Equations with the Variable on Both SidesUnit 4
Lesson 5: Equation Roundtable
Lesson 7.2: Equations with Rational Numbers
Lesson 7.3: Equations with the Distributive PropertyUnit 4
Lesson 5: Equation Roundtable
Module 8:  Solving Systems of Linear Equations
Lesson 8.1: Solving Systems of Linear Equations by Graphing.Unit 4
Lesson 11: Make Them Balance
Lesson 12: Line Zapper

Unit 4: Transformational Geometry

Module 9:  Transformations and Congruence
Lesson 9.1: Properties of Translations
Lesson 9.2: Properties of Reflections
Lesson 9.3:  Properties of Rotations
Unit 1
Lesson 1: Transformers
Lesson 2: Spinning, Flipping, Sliding
Lesson 4: Moving Day
Module 10: Transformations and Similarity
Lesson 10.1: Properties of DilationsUnit 2
Lesson 2: Dilation Mini Golf
Lesson 6: Social Scavenger Hunt
Lesson 10.3: Similar FiguresUnit 2
Lesson 1: Sketchy Dilations
Lesson 6: Social Scavenger Hunt

Unit 5: Measurement Geometry

Module 11: Angle Relationships in Parallel Lines and Triangles
Lesson 11.1: Parallel Lines Cut by a Transversal.Unit 1
Lesson 12: Puzzling It Out
Lesson 11.2: Angle Theorems for TrianglesUnit 1
Lesson 12: Puzzling It Out
Lesson 11.3: Angle-Angle SimilarityUnit 2
Lesson 6: Social Scavenger Hunt
Module 12: Pythagorean Theorem
Lesson 12.1: The Pythagorean TheoremUnit 8
Lesson 8: Triangle-Tracing Turtle
Lesson 10: Taco Truck
Module 13: Volume
Lesson 13.1: Volume of CylindersUnit 5
Lesson 11: Cylinders
Lesson 13.2: Volume of ConesUnit 5
Lesson 13: Cones

Unit 6: Statistics

Module 14: Scatter Plots
Lesson 14.1: Scatter Plots and AssociationUnit 6
Lesson 3: Robots
Lesson 14.2: Trend Lines and PredictionsUnit 6
Lesson 4: Dapper Cats
Lesson 6: Find the Fit
Module 15: Two-Way Tables
Lesson 15.2: Two-Way Relative Frequency TablesUnit 6
Lesson 11: Finding Associations

Disclaimer

This document is for informational purposes only; references to third-party programs do not imply endorsement or affiliation, and all trademarks are the property of their respective owners.

Grade 6

Unit 1: Numbers

GO Math!Desmos Math 6–A1
Module 4: Operations with Fractions
Lesson 4.1: Applying GCF and LCM to Fraction OperationsUnit 4
Lesson 6: Fill the Gap [Free lesson]
Lesson 7: Break It Down
Lesson 4.2: Dividing FractionsUnit 4
Lesson 8: Potting Soil
Lesson 9: Division Challenges
Lesson 10: Swap Meet (Print available)
Practice Day
Lesson 4.3: Dividing Mixed NumbersUnit 4
Lesson 8: Potting Soil
Lesson 10: Swap Meet
Practice Day
Lesson 4.4: Solving Multistep Problems with Fractions and Mixed NumbersUnit 4
Lesson 11: Classroom Comparisons
Lesson 12: Puzzling Areas [Free lesson]
Lesson 13: Volume Challenges
Lesson 14: Planter Planner
Module 5: Operations with Decimals
Lesson 5.1: Dividing Whole NumbersUnit 5
Lesson 9: Long Division Launch
Lesson 10: Return of Long Division
Lesson 5.2: Adding and Subtracting DecimalsUnit 5
Lesson 1: Dishing Out Decimals [Free lesson]
Lesson 2: Decimal Diagrams [Free lesson]
Lesson 3: Fruit by the Pound
Lesson 4: Missing Digits
Lesson 5.3: Multiplying DecimalsUnit 5
Lesson 5: Decimal Multiplication
Lesson 6: Multiplying With Areas
Lesson 7: Multiplication Methods
Lesson 5.4: Dividing DecimalsUnit 5
Lesson 8: Division Diagrams
Lesson 10: Return of Long Division
Lesson 11: Movie Time [Free lesson]
Lesson 5.5: Applying Operations with Rational NumbersUnit 5
Practice Day 1
Lesson 12: Budget Vehicles
Lesson 13: Grocery Prices

Unit 2: Number Operations

Module 4: Operations with Fractions
Lesson 4.1: Applying GCF and LCM to Fraction OperationsUnit 4
Lesson 6: Fill the Gap [Free lesson]
Lesson 7: Break It Down
Lesson 4.2: Dividing FractionsUnit 4
Lesson 8: Potting Soil
Lesson 9: Division Challenges
Lesson 10: Swap Meet (Print available)
Practice Day (Print available)
Lesson 4.3: Dividing Mixed NumbersUnit 4
Lesson 8: Potting Soil
Lesson 10: Swap Meet (Print available)
Practice Day
Lesson 4.4: Solving Multistep Problems with Fractions and Mixed NumbersUnit 4
Lesson 11: Classroom Comparisons
Lesson 12: Puzzling Areas (Print available) [Free lesson]
Lesson 13: Volume Challenges
Lesson 14: Planter Planner (Print available)
Module 5: Operations with Decimals
Lesson 5.1: Dividing Whole NumbersUnit 5
Lesson 9: Long Division Launch (Print available)
Lesson 10: Return of Long Division
Lesson 5.2: Adding and Subtracting DecimalsUnit 5
Lesson 1: Dishing Out Decimals (Print available) [Free lesson]
Lesson 2: Decimal Diagrams [Free lesson]
Lesson 3: Fruit by the Pound
Lesson 4: Missing Digits
Lesson 5.3: Multiplying DecimalsUnit 5
Lesson 5: Decimal Multiplication
Lesson 6: Multiplying With Areas
Lesson 7: Multiplication Methods (Print available)
Lesson 5.4: Dividing DecimalsUnit 5
Lesson 8: Division Diagrams
Lesson 10: Return of Long Division (Print available)
Lesson 11: Movie Time [Free lesson]
Lesson 5.5: Applying Operations with Rational NumbersUnit 5
Practice Day 1 (Print available)
Lesson 12: Budget Vehicles (Print available)
Lesson 13: Grocery Prices (Print available)

Unit 3: Proportionality, Ratios, and Rates

Module 6: Representing Ratios and Rates
Lesson 6.1: RatiosUnit 2
Lesson 1: Pizza Maker [Free lesson]
Lesson 2: Ratio Rounds (Print available)
Lesson 3: Rice Ratios (Print available)
Lesson 7:  Mixing Paint, Part 1
Lesson 12: Mixing Paint, Part 2
Lesson 6.2: Rates Unit 2
Lesson 8: World Records (Print available)
Unit 3
Lesson 4: Model Trains
Lesson 5: Soft Serve [Free lesson]
Lesson 6: Welcome to the Robot Factory (Print available)
Lesson 7: More Soft Serve
Lesson 13: A County as a Village
Lesson 6.3: Using Ratios and Rates to Solve ProblemsUnit 2
Lesson 4: Fruit Lab [Free lesson]
Lesson 5: Balancing Act
Lesson 6: Product Prices (Print available)
Lesson 9: Disaster Preparation [Free lesson]
Lesson 10: Balloons
Lesson 11: Community Life (Print available)
Lesson 13:City Planning
Lesson 14: Lunch Waste (Print available)
Module 7: Applying Ratios and Rates
Lesson 7.1: Ratios, Rates, Tables, and GraphsUnit 2
Lesson 4: Fruit Lab [Free lesson]
Lesson 6: Product Prices (Print available)
Lesson 9: Disaster Preparation [Free lesson]
Unit 3
Lesson 5: Soft Serve [Free lesson]
Lesson 6: Welcome to the Robot Factory
Lesson 7.2: Solving Problems with Proportions
Lesson 7.3: Converting Within Measurement SystemsUnit 3
Lesson 2: Counting Classrooms
Lesson 7.4: Converting Between Measurement SystemsUnit 3
Lesson 3: Pen Pals
Module 8:  Percents
Lesson 8.1 Understanding Percent.Unit 3
Lesson 8: Lucky Duckies [Free lesson]
Lesson 9: Bicycle Goals
Lesson 8.2: Percents, Fractions, and Decimals.Unit 3
Lesson 11: Cost Breakdown
Lesson 12: More Bicycle Goals
Lesson 13: A Country as a Village
Lesson 8.3: Solving Percent ProblemsUnit 3
Lesson 9: Bicycle Goals
Lesson 10: What’s Missing? (Print available)
Lesson 11: Cost Breakdown
Lesson 12: More Bicycle Goals
Lesson 13: A Country as a Village

Unit 4: Equivalent Expressions

Module 9: Generating Equivalent Numerical Expressions
Lesson 9.1: ExponentsUnit 6
Lesson 10: Powers
Lesson 11: Exponent Expressions (Print available)
Lesson 12: Squares and Cubes
Lesson 9.2: Prime Factorization
Lesson 9.3: Order of Operations
Module 10: Generating Equivalent Algebraic Expressions
Lesson 10.1: Modeling and Writing Expressions
Lesson 10.2: Evaluating Expressions
Unit 6
Lesson 6: Vari-apples
Lesson 8: Products and Sums [Free lesson]
Lesson 9: Products, Sums, and Differences (Print available)
Lesson 10.3: Generating Equivalent ExpressionsUnit 6
Lesson 7: Border Tiles
Lesson 8: Products and Sums [Free lesson]
Lesson 9: Products, Sums, and Differences (Print available)

Unit 5: Equations and Inequalities

Unit 6: Relationships in Geometry

Unit 7: Measurement and Data

Grade 7

Unit 1: The Number System

GO Math!Desmos Math 6–A1
Module 1:  Adding and Subtracting Integers
Lesson 1.1: Adding Integers With the Same Sign
Lesson 1.2: Adding Integers With Different Signs
Lesson 1.3: Subtracting Integers
Unit 5
Lesson 1: Floats and Anchors [Free lesson]
Lesson 2: More Floats and Anchors
Lesson 3: Bumpers
Lesson 4: Draw Your Own (Print available) [Free lesson]
Lesson 5: Number Puzzles
Lesson 9: Expressions (Print available)
Lesson 10: Integer Puzzles [Free lesson]
Lesson 1.4:  Applying Addition and Subtraction of IntegersUnit 5
Lesson 11: Changing Temperatures
Lesson 12: Arctic Sea Ice (Print available)
Lesson 13: Solar Panels and More (Print available)
Module 2: Multiplying and Dividing Integers
Lesson 2.1: Multiplying Integers Unit 5
Lesson 6: Floating in Groups
Lesson 7: Back in Time
Lesson 10: Integer Puzzles [Free lesson]
Lesson 2.2: Dividing IntegersUnit 5
Lesson 6: Floating in Groups
Lesson 10: Integer Puzzles [Free lesson]
Lesson 2.3: Applying Integer OperationsUnit 5
Lesson 8: Speeding Turtles
Lesson 12: Arctic Sea Ice (Print available)
Lesson 13: Solar Panels and More (Print available)
Module 3:  Rational Numbers
Lesson 3.1: Rational Numbers and Decimals
Lesson 3.2: Adding Rational Numbers
Lesson 3.3: Subtracting Rational Numbers
Unit 5
Lesson 2: More Floats and Anchors
Lesson 3: Bumpers
Lesson 4: Draw Your Own (Print available) [Free lesson]
Lesson 5: Number Puzzles
Lesson 3.4: Multiplying Rational NumbersUnit 5
Lesson 6: Floating in Groups
Lesson 7: Back in Time
Lesson 3.5: Dividing Rational Numbers Unit 5
Lesson 6: Floating in Groups
Lesson 3.6: Applying Rational Number OperationsUnit 5
Lesson 8: Speeding Turtles
Lesson 12: Arctic Sea Ice (Print available)
Lesson 13: Solar Panels and More (Print available)

Unit 2: Ratios and Proportional Relationships

Module 4:  Rates and Proportionality
Lesson 4.1: Unit RatesUnit 2
Lesson 3: Sugary Drinks (Print available)
Lesson 5: Snapshots
Lesson 6: Two and Two (Print available) [Free lesson]
Lesson 9: Gallon Challenge
Unit 4
Lesson 2: Peach Cobbler (Print available)
Lesson 3: Sticker Sizes
Lesson 4.2: Constant Rates of ChangeUnit 2
Lesson 1: Paint [Free lesson]
Lesson 2: Balloon Float
Lesson 3: Sugary Drinks (Print available)
Lesson 4:  Robot Factory
Lesson 5: Snapshots
Lesson 6: Two and Two (Print available) [Free lesson]
Lesson 7: All Kinds of Equations
Lesson 4.3:  Proportional Relationships and GraphsUnit 2
Lesson 1: Paint [Free lesson]
Lesson 2: Balloon Float
Lesson 3: Sugary Drinks (Print available)
Lesson 4: Robot Factory
Lesson 5: Snapshots
Lesson 6: Two and Two (Print available) [Free lesson]
Lesson 7: All Kinds of Equations
Lesson 8: DinoPops [Free lesson]
Lesson 9: Gallon Challenge
Lesson 10: Three Turtles
Lesson 11: Four Representations (Print available)
Lesson 12: Water Efficiency
Unit 4
Lesson 3: Sticker Sizes
Module 5:  Proportions and Percent
Lesson 5.1: Percent Increase and DecreaseUnit 4
Lesson 1: Mosaics [Free lesson]
Lesson 4: More and Less
Lesson 5: All the Equations
Lesson 7: Percent Machines [Free lesson]
Lesson 9: Minimum Wage (Print available)
Lesson 13: Decimal Deep Dive (Print available)
Lesson 5.2: Rewriting Percent ExpressionsUnit 4
Lesson 9: Minimum Wage
Lesson 5.3: Applications of PercentUnit 4
Lesson 6: 100% (Print available)
Lesson 8: Tax and Tip
Lesson 9: Minimum Wage (Print available)
Lesson 10: Cost of College (Print available)
Lesson 11: Bookcase Builder
Lesson 12: Posing Percent Problems [Free lesson]

Unit 3: Expressions, Equations, and Inequalities

Unit 4: Geometry

Module 8: Modeling Geometric Figures
Lesson 8.1: Similar Shapes and Scale DrawingsUnit 1
Lesson 1: Scaling Machines [Free lesson]
Lesson 2: Scaling Robots
Lesson 3: Make It Scale
Lesson 4: Scale Factor Challenges
Lesson 5: Tiles
Lesson 6: Introducing Scale
Lesson 7: Will It Fit? (Print available) [Free lesson]
Lesson 8: Scaling States (Print available)
Lesson 9: Scaling Buildings
Lesson 10: Room Redesign (Print available)
Unit 7
Lesson 5: Can You Build It? [Free lesson]
Lesson 6: Is It Enough?
Lesson 7: More Than One?
Lesson 8.2: Geometric DrawingsUnit 1
Lesson 6: Introducing Scale
Lesson 7: Will It Fit? (Print available) [Free lesson]
Lesson 8: Scaling States (Print available)
Lesson 9: Scaling Buildings
Lesson 10: Room Redesign (Print available)
Unit 7
Lesson 8:  Can You Draw It? (Print available)
Lesson 8.3: Cross SectionsUnit 7
Lesson 9: Slicing Solids
Lesson 8.4Angle RelationshipsUnit 7
Lesson 1: Pinwheels
Lesson 2: Friendly Angles [Free lesson]
Lesson 3: Angle Diagrams
Lesson 4: Missing Measures (Print available) [Free lesson]
Module 9:  Circumference, Area, and Volume
Lesson 9.1: CircumferenceUnit 3
Lesson 3: Measuring Around [Free lesson]
Lesson 9.2: Area of CirclesUnit 3
Lesson 5: Area Strategies
Lesson 6: Radius Squares (Print available)
Lesson 7: Why Pi?
Lesson 8: Area Challenges [Free lesson]
Lesson 9: Circle vs. Square
Lesson 9.3: Area of Composite FiguresUnit 3
Lesson 5: Area Strategies
Lesson 8: Area Challenges [Free lesson]
Lesson 9.4: Solving Surface Area ProblemsUnit 7
Lesson 12: Surface Area Strategies (Print available)
Lesson 13: Popcorn Possibilities
Lesson 9.5: Solving Volume ProblemsUnit 7
Lesson 10: Simple Prisms
Lesson 11: More Complicated Prisms
Lesson 13: Popcorn Possibilities

Unit 5: Statistics

Module 10: Random Samples and
Populations
Lesson 10.1: Populations and SamplesUnit 8
Lesson 10: Crab Island [Free lesson]
Lesson 11: Headlines
Lesson 12: Flower Power
Lesson 13: Plots and Samples
Lesson 14: School Newspaper (Print available)
Lesson 15: Asthma Rates (Print available)
Lesson 10.2: Making Inferences from a Random Sample
Lesson 10.3: Generating Random Samples
Unit 8
Lesson 13: Plots and Samples
Lesson 15: Asthma Rate (Print available)
Module 11: Analyzing and Comparing Data
Lesson 11.1: Comparing Data Displayed in Dot PlotsUnit 8
Lesson 14: School Newspaper (Print available)
Lesson 15: Asthma Rates (Print available)
Lesson 11.2: Comparing Data Displayed in Box PlotsUnit 8
Lesson 13: Plots and Samples
Lesson 15: Asthma Rates (Print available)
Lesson 11.3: Using Statistical Measures to Compare PopulationsUnit 8
Lesson 9: Car, Bike, or Train? (Print available)
Lesson 10: Crab Island [Free lesson]
Lesson 15: Asthma Rates (Print available)

Unit 6: Probability

Module 12: Experimental Probability
Lesson 12.1: ProbabilityUnit 8
Lesson 1: How Likely? (Print available) [Free lesson]
Lesson 2: Prob-bear-bilities [Free lesson]
Lesson 12.2: Experimental Probability of Simple EventsUnit 8
Lesson 3: Mystery Bag
Lesson 4: Spin Class
Lesson 5: Is It Fair?
Lesson 12.3: Experimental Probability of Compound EventsUnit 8
Lesson 7: Weather or Not
Lesson 12.4: Making Predictions with Experimental ProbabilityUnit 8
Lesson 3: Mystery Bag
Lesson 5: Is It Fair?
Module 13: Theoretical Probability and
Simulations
Lesson 13.1: Theoretical Probability of Simple EventsUnit 8
Lesson 1: How Likely? (Print available) [Free lesson]
Lesson 2: Prob-bear-bilities [Free lesson]
Lesson 13.2: Theoretical Probability of Compound EventsUnit 8
Lesson 6: Fair Games
Lesson 13.3: Making Predictions with Theoretical ProbabilityUnit 8
Lesson 8: Simulate It! (Print available)
Lesson 13.4: Using Technology to Conduct a SimulationUnit 8
Lesson 7: Weather or Not
Lesson 8: Simulate It! (Print available)

Grade 8

Unit 1: Real Numbers, Exponents, and Scientific Notation

GO Math!Desmos Math 6–A1
Module 1: Real Numbers
Lesson 1.1: Rational and Irrational Numbers
Lesson 1.2: Sets of Real Numbers
Unit 8
Lesson 12: Fractions to Decimals
Lesson 13: Decimals to Fractions
Lesson 14: Hit the Target
Lesson 1.3: Ordering Real NumbersUnit 8
Lesson 4: Root Down [Free lesson]
Module 2: Exponents and Scientific
Notation
Lesson 2.1: Integer ExponentsUnit 7
Lesson 1: Circles [Free lesson]
Lesson 2: Combining Exponents
Lesson 3: Power Pairs (Print available) [Free lesson]
Lesson 4: Rewriting Powers
Lesson 5: Zero and Negative Exponents
Lesson 6: Write a Rule (Print available)
Lesson 2.2: Scientific Notation with Positive Powers of 10Unit 7
Lesson 7: Scales and Weights
Lesson 8: Point Zapper
Lesson 9: Use Your Powers
Lesson 2.3: Scientific Notation with Negative Powers of 10Unit 7
Lesson 8: Point Zapper
Lesson 9: Use Your Powers
Lesson 2.4: Operations with Scientific NotationUnit 7
Lesson 10: Solar System [Free lesson]
Lesson 11: Balance the Scale [Free lesson]
Lesson 12: City Lights
Lesson 13: Star Power 

Unit 2: Proportional and Nonproportional Relationships and Functions

Module 3: Proportional Relationships
Lesson 3.1: Representing Proportional Relationships.Unit 3
Lesson 1: Turtle Time Trials [Free lesson]
Lesson 2: Water Tank
Lesson 3: Posters
Lesson 3.2: Rate of Change and SlopeUnit 2
Lesson 9: Water Slide
Lesson 10: Points on a Line
Unit 3
Lesson 4: Stacking Cups
Lesson 5: Flags [Free lesson]
Lesson 7: Water Cooler
Lesson 8: Landing Planes
Lesson 9: Coin Capture
Unit 5
Lesson 5: The Tortoise and the Hare [Free lesson]
Lesson 3.3: Interpreting the Unit Rate as SlopeUnit 3
Lesson 2: Water Tank
Lesson 3: Posters
Module 4: Nonproportional Relationships
Lesson 4.1: Representing Linear Nonproportional RelationshipsUnit 3
Lesson 4: Stacking Cups
Lesson 5: Flags [Free lesson]
Lesson 4.2: Determining Slope and y-interceptUnit 3
Lesson 5: Flags [Free lesson]
Lesson 4.3: Graphing Linear Nonproportional Relationships using Slope and y-intercept.Unit 3
Lesson 4: Stacking Cups
Lesson 5: Flags [Free lesson]
Lesson 6: Translations
Lesson 9: Coin Capture
Lesson 4.4: Proportional and Nonproportional SituationsUnit 3
Lesson 1: Turtle Time Trials [Free lesson]
Module 5: Writing Linear Equations
Lesson 5.1: Writing Linear Equations from Situations and GraphsUnit 3
Lesson 5: Flags [Free lesson]Lesson 9: Coin Capture
Lesson 5.2: Writing Linear Equations from a Table
Lesson 5.3: Linear Relationships and Bivariate DataUnit 6
Lesson 1: Click Bait
Lesson 2: Wing Span
Lesson 3: Robots [Free lesson]
Lesson 4: Dapper Cats [Free lesson]
Lesson 5: Fit Fights [Free lesson]
Lesson 6: Interpreting Slopes
Lesson 7: Scatter Plot City
Lesson 8: Animal Brains
Module 6: Functions
Lesson 6.1: Identifying and Representing FunctionsUnit 5
Lesson 2: Guess My Rule [Free lesson]
Lesson 3: Function or Not?
Lesson 4: Window Frames
Lesson 5: The Tortoise and the Hare [Free lesson]
Lesson 6.2: Describing FunctionsUnit 5
Lesson 3: Function or Not?
Lesson 7: Feel the Burn (Print available) [Free lesson]
Lesson 8: Charge! (Print available)
Lesson 6.3: Comparing FunctionsUnit 5
Lesson 5: The Tortoise and the Hare [Free lesson]
Lesson 6: Graphing Stories
Lesson 7: Feel the Burn (Print available) [Free lesson]
Lesson 6.4: Analyzing GraphsUnit 5
Lesson 1: Turtle Crossing [Free lesson]
Lesson 3: Function or Not?
Lesson 5: The Tortoise and the Hare [Free lesson]
Lesson 6: Graphing Stories
Lesson 7: Feel the Burn (Print available) [Free lesson]
Lesson 8: Charge! (Print available)
Lesson 9: Piecing It Together

Unit 3: Solving Equations and Systems of Equations

Module 7:  Solving Linear Equations
Lesson 7.1: Equations with the Variable on Both SidesUnit 4
Lesson 2: Keep It Balanced
Lesson 3: Balanced Moves
Lesson 4: More Balanced Moves (Print available)
Lesson 5: Equation Roundtable (Print available) [Free lesson]
Lesson 6: Strategic Solving (Print available)
Lesson 7: All, Some, or None?
Lesson 8: When Are They the Same?
Lesson 7.2: Equations with Rational NumbersUnit 4
Lesson 6: Strategic Solving (Print available)
Lesson 7.3: Equations with the Distributive PropertyUnit 4
Lesson 4: More Balanced Moves (Print available)
Lesson 5: Equation Roundtable (Print available) [Free lesson]
Lesson 6: Strategic Solving (Print available)
Lesson 7: All, Some, or None?
Lesson 7.4: Equations with Many Solutions or No SolutionUnit 4
Lesson 7:  All, Some, or None?
Module 8:  Solving Systems of Linear Equations
Lesson 8.1: Solving Systems of Linear Equations by Graphing.Unit 4
Lesson 9: On or Off the Line?
Lesson 10: On Both Lines
Lesson 11: Make Them Balance [Free lesson]
Lesson 12: Line Zapper [Free lesson]
Lesson 8.2: Solving Systems by SubstitutionUnit 4
Lesson 13: All, Some, or None? Part 2
Lesson 14: Strategic Solving, Part 2 (Print available)
Lesson 8.3: Solving Systems by Elimination
Lesson 8.4: Solving Systems by Elimination with Multiplication
Lesson 8.5: Solving Special SystemsUnit 4
Lesson 13: All, Some, or None? Part 2

Unit 4: Transformational Geometry

Unit 5: Measurement Geometry

Module 11: Angle Relationships in Parallel Lines and Triangles
Lesson 11.1: Parallel Lines Cut by a Transversal.Unit 1
Lesson 10: Transforming Angles
Lesson 12: Puzzling It Out [Free lesson]
Lesson 11.2: Angle Theorems for TrianglesUnit 1
Lesson 11: Tearing It Up (Print available)
Lesson 12: Puzzling It Out [Free lesson]
Lesson 11.3: Angle-Angle SimilarityUnit 2
Lesson 3: Match My Dilation
Lesson 6: Social Scavenger Hunt (Print available) [Free lesson]
Lesson 7: Are Angles Enough?
Module 12: Pythagorean Theorem
Lesson 12.1: The Pythagorean TheoremUnit 8
Lesson 6: The Pythagorean Theorem
Lesson 7: Pictures to Prove It
Lesson 8: Triangle-Tracing Turtle [Free lesson]
Lesson 10: Taco Truck [Free lesson]
Lesson 12.2: Converse of the Pythagorean TheoremUnit 8
Lesson 9: Make It Right
Lesson 12.3: Distance Between Two PointsUnit 8
Lesson 11: Pond Hopper
Module 13: Volume
Lesson 13.1: Volume of CylindersUnit 5
Lesson 10: Volume Lab
Lesson 11: Cylinders [Free lesson]
Lesson 12: Scaling Cylinders
Lesson 14: Missing Dimensions (Print available)
Lesson 13.2: Volume of ConesUnit 5
Lesson 10: Volume Lab
Lesson 13: Cones [Free lesson]
Lesson 14: Missing Dimensions (Print available)
Lesson 13.3: Volume of SpheresUnit 5
Lesson 10: Volume Lab
Lesson 15: Spheres

Unit 6: Statistics

Module 14: Scatter Plots
Lesson 14.1: Scatter Plots and AssociationUnit 6
Lesson 1: Click Battle
Lesson 2: Wing Span
Lesson 3: Robots [Free lesson]
Lesson 6: Interpreting Slopes
Lesson 7: Scatter Plot City
Lesson 8: Animal Brains
Lesson 14.2: Trend Lines and PredictionsUnit 6
Lesson 4: Dapper Cats [Free lesson]
Lesson 5: Fit Fights [Free lesson]
Lesson 8: Animal Brains
Module 15: Two-Way Tables
Lesson 15.1: Two-Way Frequency TablesUnit 6
Lesson 9: Tasty Fruit
Lesson 15.2: Two-Way Relative Frequency TablesUnit 6
Lesson 10: Finding Associations [Free lesson]
Lesson 11: Federal Budgets

Welcome to Amplify Desmos Math California!

California educators, welcome to math that motivates. Introducing Amplify Desmos Math California, a new, curiosity-driven TK–12 program that builds lifelong math proficiency. Each lesson poses problems that invite a variety of approaches before guiding students to synthesize their understanding of the learning goals. Students encounter math problems they are eager to solve; teachers spend more time where it’s most impactful: creating a collaborative classroom of learners.

Scroll to learn more about the program and explore sample materials.

About the program

Amplify Desmos Math California is a TK–12 core math program designed to meet the CA Math Framework and the Common Core State Standards for Mathematics. Offered in English and Spanish, Amplify Desmos Math California thoughtfully combines conceptual understanding, procedural fluency, and application through a structured approach to problem-based learning. Through engaging activities, Amplify Desmos Math California invites curiosity and math discourse into the classroom to create lifelong math proficiency.

Please scroll to learn more about the K–8 program and explore sample materials. (TK and high school materials are in development and will be available soon.)

A powerful math suite

Amplify Desmos Math California combines the best of assessment, problem-based core lessons, personalized practice, and intervention into a coherent and engaging experience for both students and teachers.

Laptop displaying a math problem interface with student assessment reports in the background.

Assessment

mCLASS benchmark assessments, along with daily formative checks, measure not only what students know, but also how they think. The asset-based assessment system provides teachers with targeted, actionable insights, linked to core instruction and intervention resources. Unit- and lesson-level core assessments give teachers data at their fingertips to guide and differentiate instruction. In grades 3–8, core assessments and performance tasks are designed to prepare students for success on the Smarter Balanced Assessment Consortium (SBAC) testing.

Core instruction

Amplify Desmos Math California core lessons pair problems students are eager to solve with clear instructional moves for teachers. Each lesson is designed to tell a story by posing problems that invite a variety of approaches before guiding students to synthesize their understanding of the learning goals. With built-in differentiation and Multilingual / English Learner support, Amplify Desmos Math California will allow every student to find success in the math classroom.

An educational game screen with a worm on a log and numbered blocks. Adjacent is a worksheet titled "Finding the Missing Pair" with instructions and incomplete equations.
A digital educational screen showing a math problem about converting meters to centimeters. It involves a diving toy sinking 5 meters into a pool. Text prompts users to input the conversion.

Personalized learning

Boost Personalized Learning activities help students access grade-level math through engaging, independent digital practice. Responsive Feedback adjusts to students’ work, providing item-level adaptivity to further support their learning.

Intervention

Integrated resources like Mini-Lessons, Fluency Practice, and Math Adventures provide targeted intervention on a specific concept or skill connected to the daily lesson. Extensions are also available to stretch students’ understanding.

Two pages of a math workbook displaying exercises on determining coordinates after rotation. The pages include diagrams, tables, and practice problems.
Network diagram with interconnected nodes labeled: Measure and Compare Objects, Represent Data, Dollars and Cents, Problem Solving with Measure, Skip Counting to 100, Number Strategies, Squares in an Array, Seeing Fraction in Shapes.

Big Ideas

The CA Mathematics Framework encourages a shift from power standards to thinking about math as a series of connected Big Ideas. Each Amplify Desmos Math California lesson supports one or more Big Ideas and the connections between Big Ideas. The grade-level diagram changes through the course based on the math concepts being addressed.

Focus, coherence, and rigor

Each lesson highlights why the content being covered is important, how students will engage with the mathematics, and what students will do with the learning. Our lesson opener helps teachers understand the most important concepts of the lesson, and includes the Drivers of Investigation (DI), Content Connections (CC), and Standards for Mathematical Practice (SMP) that drive learning in each lesson.

An educational slide on addition story problems, detailing goals for solving problems, language goals, and strategies using equal expressions, tens and ones, and number sense.
A screen titled "Match the Score" with a 2D target graph showing various scores. Instructions request four ordered pairs to total 400. Four pairs are listed: (4, 2), (7, 4), (7, 6), (10, 6). A "Try again" button is shown.

Built-in authentic tasks

Mathematics is not learning in isolation. Students are connected to each other’s thinking and can use math to understand the world. With accessible invitations to authentic tasks, all students can experience mathematical success. Amplify Desmos Math California provides these authentic invitations in a variety of ways:

Each unit begins with an “Explore” lesson, which allows students to engage with authentic exploration in low-floor, high-ceiling tasks. These tasks are designed in such a way that all students can access the basic mathematical concepts, but they also offer possibilities for advanced exploration and problem-solving for those ready for more complex work, promoting an inclusive and differentiated learning environment.

Our innovative course-level investigations are designed to facilitate multipart exploration. Students grapple with Big Ideas, diving deep into key concepts that encourage comprehensive understanding. Data science is infused into the approach, equipping students with a strong foundation in interpreting and applying data-driven solutions. The Environmental Principles and Concepts (EP&Cs) are also a focus of our investigations, enabling students to understand and appreciate the coherence and interrelationship of Earth’s environmental systems.

A focus on multilingual and English learners

Children sitting at desks in a classroom with a large illustrated caterpillar on the wall. Beside them are printed educational materials labeled “Amplify Desmos Math” and “Ying’s Aquarium Story.”.

In building Amplify Desmos Math California, we partnered with the English Learner Success Forum (ELSF) to provide guidance on our multilingual/English learner support for teachers. ELSF is a national nonprofit organization that advocates for high-quality instructional materials that are inclusive of multilingual learners. ELSF’s guiding documents reflect research-based instructional strategies that are critical to curriculum design and were created by researchers, linguists, and practitioners from across the country. ELSF reviewed our materials and provided directional guidance and feedback to ensure that the program fully supports multilingual/English learners.

A component of our K–5 curriculum is the engaging unit stories that interweave mathematics with real-life situations and relatable narratives. These unit stories are specifically crafted to inspire curiosity and foster a deep connection between the learner and the math concepts being explored. This unique approach not only makes learning fun and interesting, but also allows our young learners to see themselves in the math.

To help students grow their domain-specific and academic vocabulary, Amplify Desmos Math California provides embedded vocabulary routines, such as prompting teachers to use a Frayer Model. These routines allow students to make connections to new language and offer repeated opportunities to develop and refine language.

Amplify Desmos Math California recognizes the diverse language needs of our students and is designed to be inclusive. Each lesson in the program features a parallel language activity, designed to be available to all students, in the form of teacher guidance and student activities. The activities in the Math Language Development Resource has leveled ELD (Emerging, Expanding, Bridging) differentiation to support all levels of Multilingual and English Learners. This approach ensures that all students, regardless of their language skills, can participate fully, grasp the material, and excel in their mathematical journey.

Uploaded digital glossary for languages other than Spanish. Up to nine languages of translations will be provided for.

Amplify Desmos Math California will include support resources for Spanish-speaking students across TK–Algebra 1/Integrated I beginning in the 20262027 school year.

A computer displays an educational activity about measuring platform heights. A notebook page is layered behind it, with a colorful hamster-themed illustration.

K–5 sample materials

Click the links in the drop-down sections below to explore sample materials from each grade. 

For helpful navigation tips and more program information, download the Amplify Desmos Math Program Guide.

You can also watch a product expert walk through a lesson and the available program components.

Screenshot of a kindergarten curriculum outline featuring units like Math in Our World, Numbers 1-10, Positions and Shapes, Understanding Addition, Making 10, and Shapes All Around Us. This comprehensive program utilizes New York Math standards to build foundational skills.
Program structure

Get to know the content and structure of Kindergarten Amplify Desmos Math California.

Cover of Amplify Desmos Math Grade K Teacher Edition featuring three children playing with math-related objects and a group of rabbits sitting nearby, aligning with the engaging curriculum seen in New York math classrooms.
Teacher Edition pages

Planning and instructional guidance is visual, organized, and easy-to-follow. To help you review the program, we have included samples from a complete sub-unit on this site: Unit 2, Sub-Unit 1: Counting and Comparing Objects.

Digital educational activity showing a blue backpack illustration with dots, a task to match dots on cards, and printed sheet featuring a similar dot-matching exercise.
Digital experience

Explore our digital experience! Every lesson in Amplify Desmos Math California has student print materials and digital recommendations.

Cover of "Amplify Desmos Math: Student Edition Kindergarten," featuring an illustration of three children playing with math-related toys. A group of small white animals, possibly hamsters, play nearby. The scene brilliantly captures the joy of New York math exploration for young learners.
Student Edition pages

Motivate students with mathematics that is both rigorous and delightful.

Cover of "Amplify Desmos Math Grade K Centers Resources" featuring a large, stylized red and pink "C" on a light pink background with simple geometric designs. This distinctive cover complements New York math curriculums with its engaging visual elements.
Centers Resources

Engaging, hands-on games for students to play collaboratively to strengthen their understanding of key skills and concepts.

Cover of "Amplify Desmos Math: Grade K." The title is displayed with a geometric "I" illustration in the center. Subtitle reads "Intervention and Extension Resources" on a pink and white background, ideal for New York math standards.
Intervention and Extension Resources

Additional resources to reinforce and extend key concepts, including Mini-Lessons and Extensions.

Illustration of a bear choosing a path with more mushrooms. Activity book page titled "A Furry Feast" with groups of objects to compare quantities.

In this lesson, students apply their understanding of how to compare groups of images as they determine which group has more or fewer and then compare their strategies by guiding a bear through a path that has more mushrooms than the other.

A clear plastic box contains various math manipulatives, including counting cubes, geometric shapes, rulers, and dice, displayed outside the box.
Hands-on manipulative kit

An optional add-on to your Amplify Desmos Math California program, the manipulative kit provides hands-on learning tools designed to simplify and illustrate complex mathematical concepts.

Grade 1 math curriculum overview displaying six units with instructional and assessment days: counting, addition, subtraction, numbers to 10, comparing numbers, measuring length, and geometry—aligned with the New York Math standards.
Program structure

Get to know the content and structure of Grade 1 Amplify Desmos Math California.

Children interact with math activities on a large tablet while observing fish illustrations. The text reads "Amplify Desmos Math Grade 1 Teacher Edition, aligned with New York Math standards.
Teacher Edition pages

Planning and instructional guidance is visual, organized, and easy-to-follow. To help you review the program, we have included samples from a complete sub-unit on this site: Unit 2, Sub-Unit 1: Story Problems in Maui.

A digital educational activity showing a math problem about leaves on a kalo plant with a related worksheet on plant growth.
Digital experience

Explore our digital experience! Every lesson in Amplify Desmos Math California has student print materials and digital recommendations.

Illustration of three children engaged in math activities from the "Amplify Desmos Math: Student Edition 1" textbook. One child holds a number card, while the others manipulate counters and images, experiencing an exciting approach inspired by New York math techniques.
Student Edition pages

Motivate students with mathematics that is both rigorous and delightful.

Centers Resources

Engaging, hands-on games for students to play collaboratively to strengthen their understanding of key skills and concepts.

Intervention and Extension Resources

Additional resources to reinforce and extend key concepts, including Mini-Lessons and Extensions.

Interactive math activity for kids featuring a frog and number line for subtraction problems, asking to find differences to locate bugs.

In this lesson, students find differences when subtracting 1 and 2 from the same number by helping a frog reach a lily pad where it can eat a bug.

A clear plastic box contains various math manipulatives, including counting cubes, geometric shapes, rulers, and dice, displayed outside the box.
Hands-on manipulative kit

An optional add-on to your Amplify Desmos Math California program, the manipulative kit provides hands-on learning tools designed to simplify and illustrate complex mathematical concepts.

A curriculum overview for Grade 2 in New York Math displaying 8 units, including topics like comparisons, addition, subtraction, and geometric shapes, with details on the number of instructional and assessment days. This plan integrates resources from Amplify Desmos Math to enrich learning experiences.
Program structure

Get to know the content and structure of Grade 2 Amplify Desmos Math California.

Cover of the "Amplify Desmos Math" Grade 2 Teacher Edition, showcasing children measuring with rulers and a poster displaying a mathematical equation, set against whimsical scenery with a colorful dragon. Perfect for New York math classrooms.
Teacher Edition pages

Planning and instructional guidance is visual, organized, and easy-to-follow. To help you review the program, we have included samples from a complete sub-unit on this site: Unit 2, Sub-Unit 1: Adding and Subtracting.

Two digital worksheets about Theo's aquarium with tasks to estimate animal quantities using draggable graphs and illustrations of fish, frogs, and shrimps.
Digital experience

Explore our digital experience! Every lesson in Amplify Desmos Math California has student print materials and digital recommendations.

Cover of "Amplify Desmos Math Student Edition 2" showing three children performing a New York math activity with blocks and measurements.
Student Edition pages

Motivate students with mathematics that is both rigorous and delightful.

Cover of an educational book titled "Amplify Desmos Math Grade 2 Centers Resources" featuring a green "C" on a light green background, perfect for enhancing New York math education.
Centers Resources

Engaging, hands-on games for students to play collaboratively to strengthen their understanding of key skills and concepts.

Cover of "Amplify Desmos Math Grade 2: Intervention and Extension Resources" featuring a green numeral 1 on a light green background, aligning with the New York math standards.
Intervention and Extension Resources

Additional resources to reinforce and extend key concepts, including Mini-Lessons and Extensions.

Educational activity on a screen showing a worm and blocks with numbers. Another page shows an activity titled "Finding the Missing Pair," with numbered options and a video prompt.

Students continue to develop fluency by finding the number that makes 10 by helping a millipede reach its favorite food – a clump of leaves!

A clear plastic box contains various math manipulatives, including counting cubes, geometric shapes, rulers, and dice, displayed outside the box.
Hands-on manipulative kit

An optional add-on to your Amplify Desmos Math California program, the manipulative kit provides hands-on learning tools designed to simplify and illustrate complex mathematical concepts.

An educational curriculum outline for Grade 3 with seven units covering various mathematics topics, including multiplication, shapes, fractions, and measurement. Suggested instructional days are provided. The New York Math approach ensures a thorough understanding of each concept.
Program structure

Get to know the content and structure of Grade 3 Amplify Desmos Math California.

Cover of a "Grade 3 Amplify Desmos Math Teacher Edition" book, featuring a cutaway building with diverse students and a teacher working on New York math problems and organizing materials.
Teacher Edition pages

Planning and instructional guidance is visual, organized, and easy-to-follow. To help you review the program, we have included samples from a complete sub-unit on this site: Unit 2, Sub-Unit 1: Concepts of Area Measurement.

Math activity screenshot showing a problem to calculate the area of an unpainted wall space with given side lengths in a room diagram.
Digital experience

Explore our digital experience! Every lesson in Amplify Desmos Math California has student print materials and digital recommendations.

Cover of "Amplify Desmos Math Student Edition 3" showcasing illustrated children engaged in various mathematical activities inside a glass house structure, reflecting the dynamic energy of New York math.
Student Edition pages

Motivate students with mathematics that is both rigorous and delightful.

Cover of the Amplify Desmos Math Grade 3 Centers Resources book, featuring a 3D letter "C" in blue and white on a minimalistic background, perfect for aligning with New York math standards.
Centers Resources

Engaging, hands-on games for students to play collaboratively to strengthen their understanding of key skills and concepts.

Cover of an "Amplify Cover of the "Amplify Desmos Math" Grade 3 book featuring intervention and extension resources, with a blue geometric "I" on a light blue background, aligning with New York Math standards.
Intervention and Extension Resources

Additional resources to reinforce and extend key concepts, including Mini-Lessons and Extensions.

Activity sheets showing a bar graph and a table for counting animal stickers: 7 rabbits, 5 raccoons, and 2 foxes. Includes instructions for arranging data points on a graph.

Students compare data represented on bar graphs with different scales by using animal stickers to create scaled bar graphs.

A clear plastic box contains various math manipulatives, including counting cubes, geometric shapes, rulers, and dice, displayed outside the box.
Hands-on manipulative kit

An optional add-on to your Amplify Desmos Math California program, the manipulative kit provides hands-on learning tools designed to simplify and illustrate complex mathematical concepts.

A course outline for Algebra 1 with 8 units, each detailing the number of instructional and optional days. The total suggested instructional days are 144 and 28 optional days, aligning with New York Math standards.
Program structure

Get to know the content and structure of Grade 4 Amplify Desmos Math California.

Cover of "Amplify Desmos Math: Teacher Edition Grade 4" showing children learning New York Math outdoors, using large mathematical tools and numbers, with one child in a wheelchair.
Teacher Edition pages

Planning and instructional guidance is visual, organized, and easy-to-follow. To help you review the program, we have included samples from a complete sub-unit on this site: Unit 2, Sub-Unit 1: Size and Location of Fractions.

Screenshot of a digital math activity showing a fraction number line task with a log-cutting visual and an instruction page titled "Locating Fractions.
Digital experience

Explore our digital experience! Every lesson in Amplify Desmos Math California has student print materials and digital recommendations.

Cover of "Amplify Desmos Math, Student Edition, Grade 4," showcasing students collaborating on math problems involving shapes and numbers against a vibrant backdrop that blends cityscapes and natural scenery, capturing the essence of New York math learning.
Student Edition pages

Motivate students with mathematics that is both rigorous and delightful.

Cover of the "Amplify Desmos Math" Grade 4 Centers Resources book, featuring a large, stylized blue letter "C" on a light blue background. This essential resource for New York math educators ensures engaging and effective instruction.
Centers Resources

Engaging, hands-on games for students to play collaboratively to strengthen their understanding of key skills and concepts.

Cover of "Amplify Desmos Math, Grade 4: Intervention and Extension Resources," featuring a geometric illustration and a blue and orange color scheme inspired by New York math standards.
Intervention and Extension Resources

Additional resources to reinforce and extend key concepts, including Mini-Lessons and Extensions.

An educational activity displays a drag-and-drop task to determine platform heights using tube lengths, showing a room scene and instructions on a digital interface.

Students choose tube lengths to connect to platform heights for hamster homes, identifying possible heights using what they know about multiples.

A clear plastic box contains various math manipulatives, including counting cubes, geometric shapes, rulers, and dice, displayed outside the box.
Hands-on manipulative kit

An optional add-on to your Amplify Desmos Math California program, the manipulative kit provides hands-on learning tools designed to simplify and illustrate complex mathematical concepts.

A Grade 5 curriculum scope and sequence chart with units covering volume, fractions, multiplication, shapes, place value, and measurement. Each unit lists instructional and assessment days to amplify Desmos Math activities.
Program structure

Get to know the content and structure of Grade 5 Amplify Desmos Math California.

Illustration of three students engaging with various math activities outdoors and around large blocks. Text at the top reads "Amplify Desmos Math, Grade 5, Teacher Edition" - a perfect resource for New York math educators.
Teacher Edition pages

Planning and instructional guidance is visual, organized, and easy-to-follow. To help you review the program, we have included samples from a complete sub-unit on this site: Unit 2, Sub-Unit 1: Fractions as Quotients.

Activity worksheet and digital screen showing a panda on a cliff, with instructions about placing a missing bamboo shoot to help it reach the leaf.
Digital experience

Explore our digital experience! Every lesson in Amplify Desmos Math California has student print materials and digital recommendations.

Cover of "Amplify Desmos Math: Student Edition, Grade 5" featuring students engaged in various mathematical activities outside, such as block building, measuring, and gardening—a perfect resource aligning with New York math standards.
Student Edition pages

Motivate students with mathematics that is both rigorous and delightful.

Cover image of "Amplify Desmos Math Grade 5 Centers Resources" featuring a large purple letter C on a light purple background, showcasing the innovative approach of Amplify Desmos Math that's making waves in New York math education.
Centers Resources

Engaging, hands-on games for students to play collaboratively to strengthen their understanding of key skills and concepts.

Cover of "Amplify Desmos Math Grade 5: Intervention and Extension Resources," featuring a large, stylized number five in purple against a light purple background with minimal geometric patterns, ideal for New York math curriculum support.
Intervention and Extension Resources

Additional resources to reinforce and extend key concepts, including Mini-Lessons and Extensions.

Screen showing a student activity about decomposing a figure into prisms, with a drag-and-drop exercise and an adjacent worksheet labeled "Seeing Prisms.

Students decompose a figure into rectangular prisms and determine the volume of the figure by adding the volumes of the individual prisms.

A clear plastic box contains various math manipulatives, including counting cubes, geometric shapes, rulers, and dice, displayed outside the box.
Hands-on manipulative kit

An optional add-on to your Amplify Desmos Math California program, the manipulative kit provides hands-on learning tools designed to simplify and illustrate complex mathematical concepts.

6–A1 sample materials

Click the links in the drop-down sections below to explore sample materials from each grade. 

For helpful navigation tips and more program information, download the Amplify Desmos Math Program Guide.

You can also watch a product expert walk through a lesson and the available program components.

Laptop showing a math activity with geometric shapes. Two textbooks titled "Amplify Desmos Math" are displayed above.
An educational document titled "Scope and Sequence" for Grade 6 math, designed in collaboration with Amplify Desmos Math, outlining six units with instructional and optional days for topics such as fractions, integers, and expressions.
Program structure

Get to know the content and structure of Grade 6 Amplify Desmos Math California.

Cover of the Grade 6 Amplify Desmos Math Teacher Edition, showcasing students engaging in various mathematical activities around a balance scale with variables, inspired by New York math educational standards.
Teacher Edition pages

Planning and instructional guidance is visual, organized, and easy-to-follow. To help you review the program, we have included samples from three sub-units on this site: Unit 1, Sub-Unit 1: Area; Unit 3, Sub-Unit 1: Units and Measurement; and Unit 6, Sub-Unit 1: Solving Equations.

A digital activity showing two model trains on a track with a question about speed. A printed page on the right is titled "Model Trains" with warm-up instructions.
Digital experience

Explore our digital experience! Every lesson in Amplify Desmos Math California has student print materials and digital recommendations.

Cover of “Amplify Desmos Math, Student Edition, Grade 6” featuring an illustration of children engaging in various New York math-related activities outdoors.
Student Edition pages

Motivate students with mathematics that is both rigorous and delightful.

Cover image of "Amplify Desmos Math" for Grade 6, featuring a 3D pink letter "I" and the text "Intervention and Extension Resources." This New York math edition supports students with comprehensive resources.
Intervention and Extension Resources

Additional resources to reinforce and extend key concepts, including Mini-Lessons and Extensions.

A digital illustration of math balancing scales featuring boxes and a fox, alongside a worksheet displaying similar content and activities for learning math concepts.

Students use equations and tape diagrams to represent seesaw situations and to determine unknown animal weights, helping them make connections between diagrams that represent equations of the form `x+p=q` or `px=q`.

A clear plastic storage box filled with educational math manipulatives, including colorful blocks, shapes, measuring tools, and counting cubes displayed outside the box.
Hands-on manipulative kit

An optional add-on to your Amplify Desmos Math California program, the manipulative kit provides hands-on learning tools designed to simplify and illustrate complex mathematical concepts.

A Grade 7 math curriculum outline, featuring units on scale drawings, proportional relationships, measuring circles, rational numbers, operations, equations, angles, area, and probability with sequencing and days allocated. Perfectly aligned with Amplify Desmos Math for New York Math standards.
Program structure

Get to know the content and structure of Grade 7 Amplify Desmos Math California.

Cover image of "Amplify Desmos Math Teacher Edition Grade 7" featuring an illustration of students engaging in math-related activities with geometric shapes and construction elements against a New York cityscape background.
Teacher Edition pages

Planning and instructional guidance is visual, organized, and easy-to-follow. To help you review the program, we have included samples from three sub-units on this site: Unit 1, Sub-Unit 1: Scaled Copies; Unit 4, Sub-Unit 1: Percentages as Proportional Relationships; and Unit 6, Sub-Unit 1: Equations and Tape Diagrams.

Activity page showing a grid for shape creation with an area of 8 square centimeters. Includes shape options and instructions on rotation. A booklet page displays area challenges and warm-up tasks.
Digital experience

Explore our digital experience! Every lesson in Amplify Desmos Math California has student print materials and digital recommendations.

Cover of "Amplify Desmos Math, Student Edition, Grade 7" showing students engaged in math activities against a cityscape reminiscent of New York, with purple geometric structures and a crane in the background.
Student Edition pages

Motivate students with mathematics that is both rigorous and delightful.

Cover of "Amplify Desmos Math: Grade 7 – Intervention and Extension Resources" featuring a stylized 3D "I" on a light purple background, ideal for both New York math and national curricula.
Intervention and Extension Resources

Additional resources to reinforce and extend key concepts, including Mini-Lessons and Extensions.

Screenshot of an educational website showing a math activity featuring a sheep named Shira. There is a graph and a worksheet on inequalities displayed.

Students solve inequalities with positive and negative coefficients to solve a variety of challenges featuring a fictional sheep who eats grass according to an inequality.

A clear plastic storage box filled with educational math manipulatives, including colorful blocks, shapes, measuring tools, and counting cubes displayed outside the box.
Hands-on manipulative kit

An optional add-on to your Amplify Desmos Math California program, the manipulative kit provides hands-on learning tools designed to simplify and illustrate complex mathematical concepts.

Grade 8 math curriculum chart featuring 9 units, such as Rigid Transformations and Congruence, with Suggested Instructional days. Each unit outlines instructional days, assessment days, and optional days—complemented by insights from Amplify Desmos Math to enhance your New York math learning experience.
Program structure

Get to know the content and structure of Grade 7 Amplify Desmos Math California.

Illustration of children engaging in learning activities outdoors near a large slide. The title "Amplify Desmos Math Grade 8 Teacher Edition" is shown at the top, highlighting its relevance to New York math curriculum standards.
Teacher Edition pages

Planning and instructional guidance is visual, organized, and easy-to-follow. To help you review the program, we have included samples from three sub-units on this site: Unit 1, Sub-Unit 1: Rigid Transformations; Unit 3, Sub-Unit 2: Linear Relationships; and Unit 6, Sub-Unit 2: Analyzing Numerical Data.

Image of a digital math activity titled "Line Capture #2" featuring a grid, equations, and instructions. A paper worksheet with graphs and a "Line Zapper" title is displayed alongside.
Digital experience

Explore our digital experience! Every lesson in Amplify Desmos Math California has student print materials and digital recommendations.

Cover of the "Amplify Desmos Math" Student Edition for Grade 8, featuring students engaging in various mathematical activities in a stylized outdoor New York setting.
Student Edition pages

Motivate students with mathematics that is both rigorous and delightful.

Cover of "Amplify Desmos Math Grade 8: Intervention and Extension Resources" featuring a stylized "I" on a gray background, tailored for New York math standards.
Intervention and Extension Resources

Additional resources to reinforce and extend key concepts, including Mini-Lessons and Extensions.

An educational worksheet on robots, featuring a graph with red, purple, and blue robot icons, and instructions for a warm-up activity.

Students connect points on a scatter plot with individuals in a population and rows of data in a table. The analysis of scatter plots continues with data about the eye distances and heights of robots.

A clear plastic storage box filled with educational math manipulatives, including colorful blocks, shapes, measuring tools, and counting cubes displayed outside the box.
Hands-on manipulative kit

An optional add-on to your Amplify Desmos Math California program, the manipulative kit provides hands-on learning tools designed to simplify and illustrate complex mathematical concepts.

A course outline for Algebra 1 with 8 units, each detailing the number of instructional and optional days. The total suggested instructional days are 144 and 28 optional days, aligning with New York Math standards.
Program structure

Get to know the content and structure of Algebra 1 Amplify Desmos Math California.

Cover of "Amplify Desmos Math: Algebra 1, Teacher Edition" featuring diverse characters engaged in mathematical activities, with a graph and a bridge in the background, illustrating the vibrant energy of New York math.
Teacher Edition pages

Planning and instructional guidance is visual, organized, and easy-to-follow. To help you review the program, we have included samples from two complete sub-units on this site: Unit 2, Sub-Units 1–2: One-Variable Equations and Multi-Variable Equations.

A digital educational interface shows a graph with data points and textual instructions comparing year and breeding pairs. Adjacent is a page discussing penguin populations with charts and illustrations.
Digital experience

Explore our digital experience! Every lesson in Amplify Desmos Math California has student print materials and digital recommendations.

Cover of "Amplify Desmos Math" Student Edition A1, featuring an illustration of diverse characters engaging in New York math activities against a backdrop of graphs and mathematical concepts.
Student Edition pages

Motivate students with mathematics that is both rigorous and delightful.

A digital math activity screen showing block arrangements and a worksheet page titled "Shelley the Snail" with related graphics.

Students represent the solutions of a situation using a table, a graph, and multiple forms of an equation to identify multiple combinations of blocks that can help Shelley the Snail cross a gap.

Contact us

For questions, samples, or more information, please contact your local Amplify Account Executive:

Erin King
Sales Director, CA
(512) 736-3162
eking@amplify.com

Northern CA
Wendy Garcia
Senior Account Executive
(510) 368-7666
wgarcia@amplify.com

Bay Area
Lance Burbank
Account Executive
(415) 830-5348
lburbank@amplify.com

Central Valley and Central Coast
Demitri Gonos
Senior Account Executive
(559) 355-3244
dgonos@amplify.com

Ventura and L.A. County
Jeff Sorenson
Associate Account Executive
(310) 902-1407
jsorenson@amplify.com

Orange and L.A. County
Lauren Sherman
Senior Account Executive
(949) 397-5766
lsherman@amplify.com

San Bernardino and L.A. County
Michael Gruber
Senior Account Executive
(951) 520-6542
migruber@amplify.com

Riverside and L.A. County
Brian Roy
Account Executive
(818) 967-1674
broy@amplify.com

San Diego County
Kirk Van Wagoner
Senior Account Executive
(760) 696-0709
kvanwagoner@amplify.com

Under 2300 students in Bay Area, Sacramento Valley, and Northern Counties
Kevin Mauser
Lead Account Executive
(815) 534-0148
kmauser@amplify.com

Under 2300 students in Southern CA, Central Coast, and Southern Central Valley Counties
Charissa Snyder
Account Executive
(720) 936-6802
chsnyder@amplify.com

Request additional samples.

Ready to learn more? Connect with an Amplify Desmos Math California expert to request additional program samples.

S3-04: Using AI and ChatGPT in the science classroom

A graphic with the text "Science Connections" and "Amplify" features colorful circles and curved lines on a dark gray background.

In the latest episode of the Science Connections podcast, we explore AI in education and its impact on students. Listen as I sit down with teachers Donnie Piercey and Jennifer Roberts to discuss ChatGPT and how we can use it to build science and literacy skills in K–12 classrooms while preparing students for the real world.

And don’t forget to grab your Science Connections study guide to track your learning and find additional resources!

We hope you enjoy this episode and explore more from Science Connections by visiting our main page!

DOWNLOAD TRANSCRIPT

Jennifer Roberts (00:00:00):

If a kid graduates from school without knowing that AI exists, they’re not gonna be prepared for what they face out in the world.

Eric Cross (00:00:07):

Welcome to Science Connections. I’m your host, Eric Cross.

Eric Cross (00:00:12):

This season of the podcast, we’re making the case for everyone’s favorite underdog, science. Recently we’ve been highlighting the magic that can come from integrating science and literacy. So if you haven’t checked out those recent episodes, definitely go back in your feed after you’re done with this one. This time around, we’re going to deep dive into what artificial intelligence means for literacy instruction, and how science can be a force for good, in responsibly exposing students to AI. To help me out, I’m joined by two extremely accomplished educators. Jen Roberts, a veteran high-school English teacher from San Diego, who among many things runs the website LitAndTech.com. And I’m also joined by fifth-grade teacher Donnie Piercey. In addition to being Kentucky’s 2021 Teacher of the Year, Donnie also has an upcoming book about bringing AI into the classroom. Whether you’ve never heard of ChatGPT or whether you’re already using it every day, I think you’ll find this a valuable discussion about the intersection of science, English, and technology. Here’s Jen and Donnie.

Eric Cross (00:01:17):

So first off, welcome to the show. It’s good to see you all. What I wanna do is kind of start off by introducing both of you. And so we’ll just go K–12. So <laugh>, Donnie.

Jennifer Roberts (00:01:30):

Donnie goes first.

Eric Cross (00:01:31):

Donnie’s gonna go first. Donnie out in Kentucky. Just a little background. What do you teach; how long you’ve been in the classroom; and what are you having fun with right now?

Donnie Piercey (00:01:38):

Yeah, so my name is Donnie Piercey. I’m a fifth-grade teacher from Kentucky. Live and teach right here in Lexington, Kentucky, right in the center of the state. I’m the 2021 Kentucky Teacher of the Year. But I’ve been teaching elementary school for the past … I think this is year 16 or 17. It’s long enough where I’ve lost count, and I can’t even count on fingers anymore. My friends like to joke that I’ve taught long enough where now I can count down. You know, it’s like, “All right, only so many more years left.” But yeah, teach all subjects. Science definitely is one of the subjects that I don’t just try to squeeze into my day, but make sure that … it’s not even a devoted subject, but one that I definitely try to — don’t just have that set time, but also try to do some cross-curricular stuff with it. So definitely the rise of AI in these past few months, which feels like years by this point, has definitely played quite the role, in not just changing the way that I’ve been teaching science, but really all my subjects. So, excited to chat with y’all about it.

Eric Cross (00:02:47):

Nice. I’m excited that you’re here. And Jen?

Jennifer Roberts (00:02:51):

Hi, I’m Jen Roberts. I teach ninth-grade English at Point Loma High School, and that’s where I usually stop when I introduce myself. But for your sake—

Eric Cross (00:03:00):

I will keep introducing you if you stop there. <laugh>

Jennifer Roberts (00:03:04):

I am nationally board-certified in English Language Arts for early adolescence. I am the co-author of a book called Power Up: Making the Shift to 1:1 Teaching and Learning, from Stenhouse, with my fabulous co-author Diana Neebe. Shout out to Diana. I blog at LitAndTech.com about teaching and technology and literacy and the intersection of those things. And I’m looking forward to talking about how AI is showing up in my classroom and the fun things I’m doing with it.

Donnie Piercey (00:03:31):

And one of us is actually secretly a robot, and you have to guess which one.

Jennifer Roberts (00:03:35):

Have to guess which one. Yes. <laugh>

Eric Cross (00:03:37):

That would be super-meta. And you were the CUE — Computer-Using Educator — outstanding teacher or educator? Whatever. Either one. Of the year.

Jennifer Roberts (00:03:45):

I was the CUE ’22 Outstanding Educator. Yes. And I’ve won a few other things as well.

Eric Cross (00:03:53):

The gaming backpack.

Jennifer Roberts (00:03:54):

I’ve won a gaming backpack recently! Yes. I once won an iPad in a Twitter chat.

Eric Cross (00:03:58):

What?

Donnie Piercey (00:03:58):

What’s a gaming backpack? Hold on. We need to talk about that.

Jennifer Roberts (00:04:01):

We will talk about that. <laugh> And then, I was once a finalist for county Teacher of the Year. That’s as close as I got to Donnie. Donnie was the Kentucky Teacher of the Year. He got to go to the White House and stuff. That was exciting.

Donnie Piercey (00:04:13):

<laugh> I mean, to be fair, there’s only three million people in Kentucky, and about what, 50 million people that live in California? <Laugh> So odds are definitely stacked in my favor, I think.

Jennifer Roberts (00:04:23):

So you’re saying we’re even there? Is that, is that what you’re going for?

Donnie Piercey (00:04:25):

Yeah, evens out. Evens out.

Eric Cross (00:04:27):

So I’ve been looking forward to talking to you both for a while now, and talking about artificial intelligence. It’s like the big thing. And both of you, at different ends of the spectrum and in my life, have contributed to this. Donnie, you’ve been sharing so much great information online about how you’re using AI in elementary. Jen, you are the reason I got into education technology years ago, right when I was becoming a teacher. And so being able to talk with you both about it excites me a lot. So first off, for the listeners who may not have any experience with it — and there’s still a lot of people out there who have not been exposed to it, haven’t got their feet wet with it yet — I’m hoping we could start off maybe with an explanation of … we could do AI, ChatGPT, I know that’s the big one. But simply explaining what it is, just for the new person. And whoever wants to start off can tell us about it. Or maybe we’ll start … we’ll, let’s actually, let’s do this: Let’s continue going like K–12? So Donnie, maybe you could … what’s your pitch to the new person of, “Hey, this is what it is”?

Donnie Piercey (00:05:31):

All right. So, AI, artificial intelligence, probably the way that most people are exposed to it, at least since November when it launched, is through ChatGPT. Where if you Google it, you know it’s made by a company called OpenAI. The best way to describe what it is … when you go there for the first time, make an account, it’s free. You have like a little search window, looks like a Google search bar. And instead of searching for information, you can ask it to create stuff for you. So for example, like on Google search, you might type in a question like, “Who was the 19th president of the United States?” Where on ChatGPT, instead of just searching for information, it creates stuff for you. So you could say, you could ask it to, “Hey, write a poem about the 19th president of the United States.” Or, “Write a short little essay comparing, I don’t know, Frederick Douglass to Martin Luther King Jr.” And it would do that for you. You know, that’s most people’s first exposure to AI, at least in these past few months. Instead of … you know, it’s artificial intelligence, but it’s not just chatbots. There’s lots of other AI that exist out there.

Jennifer Roberts (00:06:47):

And I think that’s the thing: that people don’t realize how much AI is already in their lives.

Donnie Piercey (00:06:51):

For sure. Yeah.

Jennifer Roberts (00:06:52):

You know, they just haven’t seen … the term that I see being used a lot now is “generative AI.” AI that can produce something. It can produce writing, it can produce art, it can produce a script, it can produce a character. But the AI that has been helping you pick what to watch next on Netflix and the AI that’s helping Google help you get where you wanna go on Google Maps faster, those are forms of artificial intelligence as well.

Donnie Piercey (00:07:21):

Yeah. I mean, even those, when you get that that message in Gmail, and instead of having to type out that response that says, “Yeah, that sounds great,” you can just click the little button that says, “Yeah, that sounds great.” I mean, that’s been in Gmail for years, but that’s artificial intelligence too.

Eric Cross (00:07:39):

Absolutely. So why is it important, do you think, for educators to, to be familiar with it? Like, why are we all so excited about it?

Jennifer Roberts (00:07:47):

So, educators need to know what kids are into, and kids are obviously into ChatGPT. And anyone who’s an educator right now has probably already had something cross their desk — or more likely their computer screen — that was written by AI and passed off as a student’s own work. And that is, of course, the great fear among teachers everywhere, that this is what kids are just gonna do these days and they won’t be able to catch it and children won’t be doing their own work and this and this. But I think the big reason teachers need to know what’s going on is because teachers need to be futurists. Our clientele will live in the future. We teach kids, kids will become adults, adults will live in the world. And so if we’re not thinking about and trying to predict on some level what’s gonna happen 5, 10, 15 years from now … we might be wrong, but what if we’re right?

Jennifer Roberts (00:08:38):

And if we’re not at least trying to think about what is their future world gonna look like, then we’re not serving our students well. I did a whole night talk on that. So I think ChatGPT is part of that. I teach seniors. I had this moment of realization I felt a few months ago. I’m like, “This is gonna be the world they graduate into. They need to know what this is before they leave me.” If I don’t teach them how to use this well, and not the way they’re using it — which is to copy and paste the teacher’s assignment and drop it into ChatGPT and take whatever it spits out and turning that in without even looking at it — if I don’t teach ’em how to use it critically, if I don’t teach them how to write effective prompts, if I don’t teach them how to use the AI as a tool, as a collaborator, then they’re gonna graduate into a world where they lose out to people who do know how to do that. And I think the advantage goes to kids who have access and knowledge of what’s in front of them and what’s available, and can use all of the tools at their disposal. Because when you’re writing in school and you write with a collaborator, that could be considered cheating. But when you do that out in the adult world, that’s considered doing a good job. <Laugh> Being a team player. <Laugh> You know, adults don’t work alone for the most part. And adults are expected to churn out beautiful, perfect content no matter how they got there. So if I’m not teaching my kids how to use this, they’re not being ready. They’re not gonna be ready to be the adults that I want them to be.

Donnie Piercey (00:10:07):

A hundred percent agree. And I also believe … as you know, I teach elementary school. I also don’t think anybody is saying that on the first day of kindergarten, you hand a kid a Chromebook and load up an AI chatbot or ChatGPT and say, Hey, this thing’s gonna do all your work for you for the next 12 years; just coast through life. You don’t have to think creatively. You don’t have to learn how to develop a paragraph or learn how to write a speech or develop an idea. Like, I don’t think anybody’s saying that, because as an elementary school teacher, there’s many days when I’m like, “Y’all, we’re just putting the Chromebooks away today and we’re just gonna go old-school. We’re just gonna maybe just jot down five quick ideas and stand up and present those ideas to the class.”

Donnie Piercey (00:10:54):

Because while AI definitely will, like you were saying, Jen, play a significant role in the lives of our students who are, not just graduating, but the 10- and 11-year-olds in my classroom this year. A significant role in their lives. It’s also really important to recognize that we’re not saying that this means that “Hey, kids don’t have to work anymore.” They still have to put forth that effort. There’s still — one of the ways that you become a good writer is by trial and error. And sometimes that trial and error comes through talking to a teacher or talking like you were saying to a peer or collaborating with a peer and saying to them, “Well, this sentence here, this paragraph here, really doesn’t make sense.” And I do believe one of the ways — especially as AI starts to become more fine-tuned and starts to be embedded more and more in tools like Google Docs and Microsoft Word — is it’s almost going to be a tutor to students.

Donnie Piercey (00:11:56):

Mm-hmm. <affirmative> Where I could very easily see in a few years, or maybe a few months, who knows what Google or any of these other big companies has rolling out, where a student could highlight a paragraph that they wrote simply, and then say, “Hey, proofread this for me,” or “Check for coherence.” Or even just ask a simple question: “Does this paragraph make sense?” Because you can already do that. You can copy a paragraph over into a chatbot and say, “Hey, does this make sense?” You know, “Rate my idea from one to 10,” and it’ll do that for ’em.

Jennifer Roberts (00:12:26):

We did that last week <laugh>.

Donnie Piercey (00:12:28):

Yeah. Right. I mean, that’s the thing. That technology exists now. It’s just not totally embedded yet. But based on what I’ve read and what I’ve seen, that’s gonna happen sooner rather than later. And it’s really, really important that we teach our students that, “No, you’re not just gonna use this, this tool to cheat, but you can use this tool to help you become a more creative student.”

Jennifer Roberts (00:12:50):

This is the use case in my classroom. Can I talk about that? You ready for that?

Eric Cross (00:12:53):

Please.

Jennifer Roberts (00:12:54):

OK.

Eric Cross (00:12:54):

Please.

Jennifer Roberts (00:12:55):

So my ninth graders are writing a comparative analysis essay, where I took them to the student art gallery and I made them pick two pieces of completely unknown student art and take notes on it, so they could go back and write this essay. And as soon as we got back to class, I said, can ChatGPT write this for you? And they all kind of froze ’cause I didn’t tell them what ChatGPT was. And they weren’t sure if they were allowed to know or not. And finally one of them kind of bravely raised his hand and said, “No.” And I said, “Why not?” And he said, “Well, the AI hasn’t seen the art. How can it write an essay about art when the art is completely original that we just went and looked at?” I said, “It’s almost like I planned it that way, isn’t it?” And they laughed nervously. And then I said, “Does that mean it can’t help us with this assignment?” And they said, “Well, no — of course it can’t help us, because it has not seen the art.” And I said, “Well. …” And I open ChatGPT, and I typed in what they were trying to do: “I need to write a comparative analysis essay comparing two pieces of student art on these reasons. And I need to choose which one did it better, basically. Can you help me with an outline?” and ChatGPT produced a lovely outline. And I looked at that with my students and we looked at it together and I said, “This is what it gave us. Would this be helpful to you?” And they’re like, “Yeah, that would be helpful to us.” So we — to be clear here, I was the only one using ChatGPT in the room. They were not actually using it. We were using it together. I copied and pasted the outline that it gave us and put it in their learning management system where they could access it so they could use the outline that the robot provided, and then they could use that to make their own writing better. So then I let them write for a little while, and, after they’d written for a little while, I said, “Does anybody wanna let me share your first paragraph with ChatGPT and see what it thinks of how you’re doing?” And a brave student raised his hand and we took his paragraph and we put it in ChatGPT, and it spit back advice. We said, “This is what I have so far for my first paragraph. Do you have any advice for me?” And we gave it the writing, and the first piece of advice it gave back was very generic, you know, “Add a hook,” you know, like kind of thing. But after that, it started to get more specific about things he was actually doing in his writing. And it started to give him some feedback. And we looked at that together as a class. And I said, “Does any of that feedback help you?” And he said, “Oh yeah, absolutely. I’m gonna go add some revisions to my paragraph.” And other students did too. They looked at the feedback he got and used that to improve their writing. And so everybody went and revised. And I said, “Look, if you take what the robot gives you and you copy and paste it, and you turn it in as your own work, it’s gonna get flagged for plagiarism. And that’s not gonna go well. But if it gives you writing advice the same way I would give you writing advice, and you decide that advice is good, and you take that advice and you incorporate it into your own writing yourself, then the robot’s making you better, but you’re still the one doing your own writing.” And the writing they turned in from that assignment was, was better. It wasn’t written by ChatGPT; it was still about the student art that they found in the gallery. But I showed them a path. Like, it can help you with an outline, it can help you with feedback. Right? These are fair ways to use it that’s gonna make you better. And they really liked that. They really liked — no one had shown them that before. The idea that you don’t just take the teacher’s prompt and give it to it … like, these are new uses to students and worked well.

Eric Cross (00:16:17):

So right now, you both just laid out these ways that you’re using it. And I do this with people that I’m trying to introduce to ChatGPT or AI. ‘Cause I get excited. Anyone could write a 500-word persuasive essay on the use of color in The Great Gatsby or The Outsiders, and they can get something back within seconds. But for a lot of educators, it might feel like the sky is falling.

Donnie Piercey (00:16:43):

Oh, understandably! Understandably. I mean, that totally makes sense.

Eric Cross (00:16:49):

What would you say to them? Donnie, go ahead.

Donnie Piercey (00:16:51):

Yeah. Well, I feel like every teacher kind of goes through the same experience when they see like a generative chatbot. I mean, all these major companies are gonna start incorporating AI, the generative AI piece. And a lot of times, when they see it for the first time, two things. First they’ll say “Oh, but I’ll know that that’s not my students’ writing.” Which, frankly, I think is a good thing, because that tells me that the teachers know their students’ writing. They’ve seen them write in person. They’ve conferenced with them one-on-one. And if a student were to turn something in to me, who I know might be a struggling writer, maybe it’s not their strength, and all of a sudden they’re turning in this10-page dissertation-worthy thesis written at a PhD level, I’m like, “All right, man, you’re nine. Can we talk about where this came from?” <laugh> But I also don’t think that at like the heart, I don’t feel like kids want to cheat. I really don’t. I feel like sometimes like kids are in a situation where they’re like, “OK, I’ve got nothing left. I gotta get this assignment done.” And when those kind of things happen, that’s when we as teachers, we have those one-on-one conversations. Even when I showed my students ChatGPT and even some of the AI image-generating stuff for the first time, and I talked to them about, “What do y’all think about this?” Because, you know, they’re under 13. In my district, ChatGPT is blocked for students. Staff, we have access to it. And that’s just because one, it’s so new, and at the same time, we need to figure out, “What’s the best way they can go about using this tool?” But when we were talking about it as a class, you know, I didn’t want to ignore the elephant in the room. So I asked them, I said, “Hey, do you feel like this is something that you all would use to. …” I mean, I used the word. I said “cheat.” And to be honest, the majority of the students in my class, they were taken aback. They’re like, “What? You think we just would cheat all the time?” Right? <Laugh> And I’m like, “Oh, well good. I’m glad to know that integrity is still alive and well.” But yeah, that’s definitely my thoughts on it, as far as not only the student integrity piece — I think that that’s the big thing that you need to just bring up with your students. Because again, I like to think that I’ve seen my students write enough that if they were going to turn something in that wasn’t their voice, or it didn’t sound like them, like I could have that conversation. And don’t be surprised, too, if in the next … I don’t know, one month to a year, there’s lots of AI detectors that exist. A lot of them are these like third-party things. You can go ahead, but I would not be surprised if in the next year or so, like you start to see those AI detectors be built into Google Docs, into Microsoft Word, into even Canva. And honestly, it’s almost like a fail-safe button for teachers, that we could say “All right, this is telling me that this is 99% probably written by AI.” So you can have that conversation with a student that way.

Jennifer Roberts (00:20:03):

I mean, if you’re worried about it, Formative, right now, will even tell you if something is copy-and-pasted into the boxes that they give you for students to write in. I find that kids who cheat are desperate, you know. Especially at the high school level. They’re panic mode. And, and usually their panic comes from, “I have no idea how to even start this assignment.” And so part of what I wanna use ChatGPT for is to lower that barrier for them. Like, you’ve got an assignment, you don’t know where to start. Tell the robot, tell ChatGPT, about the assignment and ask it for a list of steps. You know, ask it for an outline. Ask it for a time management plan. I see so much tremendous potential for this to help many of my students with IEPs who have executive functioning issues.

Donnie Piercey (00:20:49):

Oh, a hundred percent, right?

Jennifer Roberts (00:20:51):

Yes, a hundred percent. This can be their personal assistant who, you know, instead of me sitting with them one-on-one and saying, you know, “This is the task you need to do, let’s break it down into these six discrete chunks,” the artificial intelligence can do that for them. And it can do that for teachers too. <laugh>

Donnie Piercey (00:21:09):

Jen, I was just thinking about, how long until we see like the phrase artificial intelligence written onto a student’s IEP? I could see that happening very, very soon.

Jennifer Roberts (00:21:20):

Right? They should be able to use that. And then, also, of course, all of its amazing beneficials for teachers. I had to completely rewrite a unit of my curriculum. I knew what I wanted to do. I had some ideas of things I wanted to put in there. And I resorted to, I went to EducationCopilot.com and typed in my stuff that I had: You know, what standards I wanted to cover, what outcomes I was hoping for mm-hmm. <affirmative>. And it generated an eight-week unit for me. And I actually told it then to go back and do it as a 12-week unit so that I’d have more stuff in there to go and cherry-pick to decide what I really wanted to do. But it gave me ideas. It gave me places to start. It saved me an hour of just brainstorming. And I don’t think that was cheating. I still got to go in and decide which ideas were valid. And I still got to … you know, I mean, I’m a teacher. Can I get accused of cheating? I don’t think that’s a thing. It’s—

Eric Cross (00:22:18):

That’s collaborating! It’s collaborating!

Donnie Piercey (00:22:20):

Collaborating! It’s a feature! It’s a feature.

Jennifer Roberts (00:22:22):

It’s Tony Stark talking to Jarvis. You know, they’re figuring it out together.

Donnie Piercey (00:22:26):

Oh, when you use the AI, Jennifer, do you call yours Jarvis? In my class we call him Jeeves. ‘Cause remember Ask Jeeves?

Jennifer Roberts (00:22:33):

I think Eric calls it Jarvis.

Eric Cross (00:22:35):

Yeah. Jarvis is gonna be the AI’s name when, when I can get that fully functioning. There are some things that you had said, I just wanna circle back on. Donnie, Jen — so what I heard was like, best intentions. The part you said about integrity and students wanting to cheat … even the mindset that we go in assuming our students, what they would want to do and assuming best intentions, really kind of frames how you look at this kind of technology. And then Jen, you kind of brought up why students cheat, and realizing that either they don’t feel equipped, or maybe it’s time management, or something else. But most people — and I believe this as an educator — most students want to learn, and they want to be able to perform and achieve. And when they cheat, it’s because they didn’t feel like they could, for whatever reason. Whether it’s it’s outside factors, whether it’s something internal, motivation, whatever it is.

Jennifer Roberts (00:23:24):

Or they were very disconnected and just didn’t care.

Eric Cross (00:23:27):

Sure.

Jennifer Roberts (00:23:27):

This is just busy work the teacher’s giving me, so I’m gonna give it very little of my time and energy. But I think, yeah, it can be that. But if the kid cares about it, if they wanna learn, they wanna learn, you know?

Eric Cross (00:23:40):

Right.

Jennifer Roberts (00:23:40):

This is the day of the internet. Any kid can learn anything they really want to learn. And we see that all the time in our classes. The kid who has zero interest in what I’m teaching in English, but he is an expert coder, and that’s what he wants to spend his time learning. He’s like, “Can I read this C++ book as my independent reading book?” And I’m like, “You know, actually, you can. Go ahead.” <Laugh>

Eric Cross (00:24:01):

Yeah. And for both of you, saying that this makes content more accessible … and I think Donnie, or Jen, you said something about IEPs. I actually put in having it write an IEP to see what would happen. I gave it a prompt for a student’s ability level and I asked it to create a plan. And then I asked it to create a rationale. And it did! And it was good! I went through and vetted it. And right now … you know, a lot of it is funny, ’cause the conversation I’m having with different teachers is kind of like the Wikipedia one. Remember when Wikipedia first got out and everyone was like trying to discourage everybody from using it, because, well, it could be changed by anybody? And now everyone’s like, “Oh, check Wikipedia, and then steal the sources, ’cause they’re already done for you.” Like, the mindset has shifted since then. And I was talking to someone and they said, “Well. …” And I said, “We can use AI, it could be a tutor, these other things. …” And they said, “Yeah, but what happens?” And then insert apocalyptic scenario. Like, what happens if you don’t have access to wifi? And it reminded me of, for some reason, cooking classes. So in the 1700s you probably had to be able to farm to be able to generate your food. Right? Like, you had to get it from somewhere. But if you take a culinary class now, you just go to the grocery store. And someone might say, “Well, but you should know how to farm, ’cause what if there was this worldwide apocalypse and nobody could go to the grocery stores?” <Laugh> And you’re like, “Well, balance of probability though.” You know, it’s like we’ve been really been living in these iterations of life, and I think this next step for some folks … like, we don’t even realize, even like something like bank statements, right? So many folks are paperless. And there’s always a what-if scenario. What if you need it and the internet goes down. But we get so used to to to technology advancing and making our lives different. This kind of seems like that next iteration. And I wanna ask you this question: Are we looking at like the next calculator? The next internet, with this tech? Or do you think it’s too early to say?

Donnie Piercey (00:26:01):

Well, I’ve seen a lot of people compare ChatGPT to a calculator. I’ve seen that pop up on social media. There’s, “Oh well, no, this is like when the calculator was invented. Everyone was up in arms about how ‘that’s not what math students should do.’ Math should be pencil and paper, math should be this.’” However, you can give a kid a calculator and you can give ’em a word problem and they can punch in all the numbers, but they could do the wrong operation or they could put the decimal point in the wrong place, ’cause the student is still the one who’s controlling what’s on the calculator. Where with AI, all you gotta do is just copy it and then paste it into the bot and it’ll spit out whatever the question asked it for. Whether it was, you know, a 500-word rationale or proof for something in geometry, or if it’s analyzing data on a chart, it’ll do all that.

Jennifer Roberts (00:27:00):

Yes. But it’s not that magical. It’s back to what Eric did with the IEP. He put in a prompt and then he knew enough to ask for a rationale and then he knew enough about IEPs to critically read the results he got and make sure they actually worked for what he needed. He had to know all that. He was an expert using it to do an expert thing. My husband’s a computer scientist; he got ChatGPT to help him write an app, and it was a new programming language to him, and he could put in the data and he could ask for things that I would’ve never thought to ask for. But because he knows the language of computer science, he knew what to ask for. And when it gave him results that were bad, he could see that, and he could say, “Yes, but do it again, but without this,” or “make this part more efficient.” He, again, knew what to ask for. So I think the generative AI is, as a partner with humans, a powerful thing. But if the human doesn’t know what they’re doing, yeah. You’re still not gonna get great results.

Donnie Piercey (00:28:03):

<laugh> And I think that’s why I’m coming at this from the elementary school perspective, right? Because in K–5 students are still learning, like, “Hey, where does the decimal point go?” They’re still learning, you know, if you’re dividing by a two-digit number, where does the first digit go, if you go in the old long-division algorithm? And so they’re still acquiring that base-level knowledge that … I don’t know, maybe this is similar to in Jurassic Park when Jeff Goldblum says, “It didn’t take any knowledge to attain,” you know, “they stood on the shoulders of geniuses,” that whole thing. Like they had to acquire the knowledge for themselves, was his whole point. And so that’s why I don’t think it’s exactly the same as the calculator. It is definitely going to change things, in a similar way that the calculator did. But to me it’s just a whole new animal. And I don’t know if it’s going to be like the next internet, Eric — if you’re gonna get little devices that have AI built into it, like a Star Wars kind of thing, like a droid or something that follows you around — all that would be kind of cool, not gonna lie. But whether it’s something that you’ll access through the internet, something that’s built into your TV, that part I don’t know. But I do know that there’s a reason why all of these apps and all these companies are investing so much — not just energy, but time and money into it. Because they’re recognizing. “OK, this really has the potential to change things.” But if used well, and used safely, to change people’s lives for the better.

Eric Cross (00:29:41):

So I definitely hear that you both agree with the statement that if AI ChatGPT was used in the classroom, it could be a force for good. And literacy development. And I wanna shift gears a bit and then come back to the AI. So with that said — and we’re gonna get into some best practices in a minute — in Science Connections right now in this season, we’re making the case for how science can do more in classrooms and in schools. And so I’m I’m curious about what both of you think about the role in science fostering a better future when it comes to AI and education. And this season we’re really talking a lot about literacy. You know, in schools, so often it’s taught in a siloed way. And Donnie, you’re doing multi-subject. Jen, you’re single-subject: English. And we’ve really been trying to make this case for how science can actually support literacy, and these skills that students are trying to develop. So we’re going a little old-school, kind of diving into your content specialty, but maybe even pre-AI, or maybe AI has a component in this. But Don, maybe we’ll start with you. How has science been a way that has been helpful for your own literacy instruction? I know you do a lot of science, because I see your Google Earth stuff and the thing you did with the solar systems back in the day. And I think —.

Donnie Piercey (00:30:54):

Oh my gosh! You remember my <laugh> … wow.

Eric Cross (00:30:58):

That was amazing!

Donnie Piercey (00:31:00):

We haven’t done that since the pandemic. But I had my students go out, and using Google Earth, we built a scale model. Each of the students partnered up and they planned out on Google Earth a scale model of the solar system. They picked an object from around their house and we talked about like, “Don’t pick something bigger than a beach ball, or else, you know, your Neptune’s gonna end up like 10 miles away.” But you know, they just picked like a small ball, like a basketball, soccer ball, something like that. Or football, for international friends. And then we calculated the size of every other planet. And then on Google Earth, using their front lawn as where the sun was, then we went and we calculated where other planets would be, and then we actually drove to those locations and like held up the objects that would represent Neptune, Jupiter, Saturn, and all that. But it was a lot of fun.

Eric Cross (00:31:59):

And is that still accessible? ‘Cause I know you have some websites that you put resources out there.

Donnie Piercey (00:32:03):

Yeah. Yeah, I can … I wanna say on my Resources page — Resources.MrPiercey.com — I’ve got a link on there to a couple of student examples that I can share. And if not, when we get off this call, I’m gonna go on and put them on there <laugh> so people can find it. I’ll even throw on there just the assignment itself. So if you wanted to copy that and do that with your students, you could.

Eric Cross (00:32:27):

Donnie, the reason why I brought that up is because I saw that you had posted that or shared it a long time ago, and I just thought it was the coolest thing that you could totally do with middle-school students or high-school students. Jen, when I became a teacher, you said, “We’re all teachers of literacy.”

Jennifer Roberts (00:32:43):

<laugh> Yeah. I think we forgot to tell them that I was one of your professors.

Eric Cross (00:32:47):

Yes. <Jennifer laughs> One of the people who’ve definitely influenced and shaped my teaching. And that statement has never left my mind: that we’re all teachers of literacy. And I want to ask you, at the high-school level, how can science educators, or how can science — how have you seen it, or how does it, support literacy, when it’s done right?

Jennifer Roberts (00:33:09):

Like I said, I think we’re all teachers of literacy, but I think literacy is bigger than just reading and writing. I don’t think someone is literate if they can’t talk somewhat knowledgeably about what’s happening with climate change. I don’t think someone’s literate if they don’t know what’s going on in the world. And I think so much of what’s going on in the world has to do with science. We’re doing that all the time. If I could teach English just by giving kids articles about science, things to read, that would make my day. Right? We would never read another piece of fiction again. It would all be, you know, what’s happening to the ice sheet in Greenland. My students thrive on reading non-fiction. And then whenever that non-fiction touches on science is even more interesting. And whenever I can get them writing about data, particularly their own data that they collected, I think that’s building those science literacy skills as well. So I think science and English blend together very, very well. I think the literacy aspects of that are fantastic. There are more subject-specific vocabulary words, advanced vocabulary words, in science than any other discipline. And I don’t see why those shouldn’t come up in English as well. You know, my seniors will do a unit at the end of the year on the new space race. Unless I replace it with a unit about generative AI, which I’m seriously considering doing, ’cause I think they really need to learn about bias in AI algorithms and things like that. And I would like to have them read a whole bunch about that stuff. And I wanna give them the open letter that all those CEOs signed that said that AI research should slow down, and make them part of that live conversation about what’s happening in that field. So science comes into that. You know, when we read Into the Wild, we start talking about a whole bunch of scientific concepts. And when it rains in Southern California, we pull up weather maps and look at radar and talk about that and how that works.

Donnie Piercey (00:34:59):

That’s like once every 10 years, Jen? <Laugh>

Jennifer Roberts (00:35:02):

Well, actually, this year it rained a lot. It rained a lot in San Diego. Which is actually very high-interest for them. ‘Cause they wanna know, is it gonna be raining at lunchtime?

Eric Cross (00:35:12):

Jen, you said something … you have your students writing about data?

Jennifer Roberts (00:35:16):

Oh yeah.

Eric Cross (00:35:17):

Can you tell me more about that?

Jennifer Roberts (00:35:19):

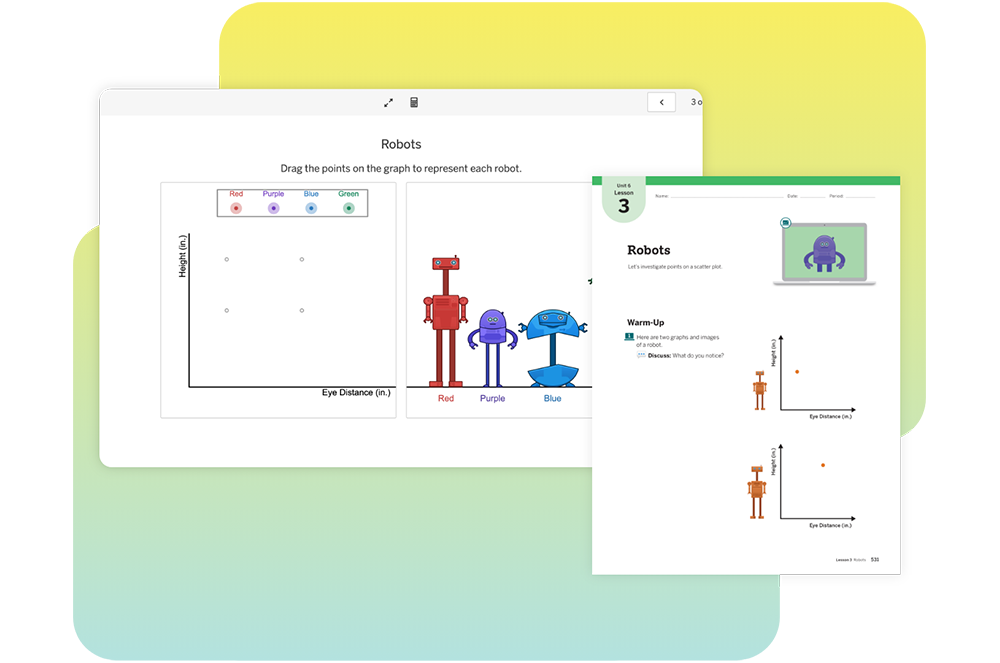
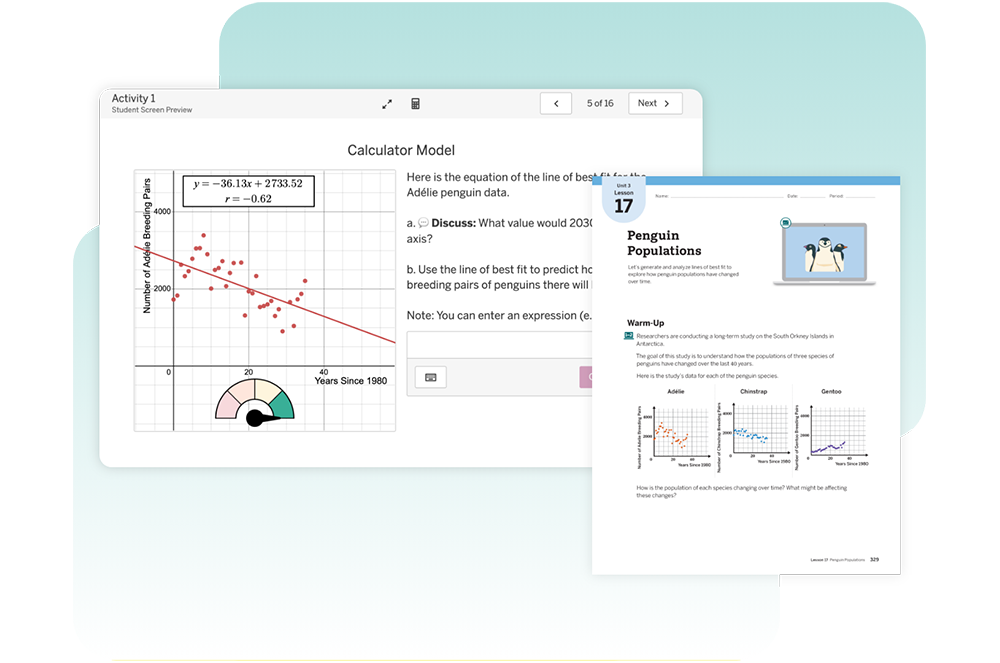
So, this is something we’ve done with the ninth grade team for a long time now, is writing about their own data. So it started with a unit about stereotypes and stereotype threat. And they would collect data individually and then they would enter that data into a Google form and then we would give them the spreadsheet of the aggregate data from the whole ninth grade. And then we morphed that unit into one about academic honesty, and they filled out a survey at the beginning of the unit about their feelings about academic honesty and about experiences with academic honesty and cheating and homework and things like that. And then we would do the unit. We’d do all the readings in the unit. And they’d have these “aha” moments about things that were happening at other schools. And then at the end of the unit, we would give them back their own aggregate data and ask them to write about whether or not academic honesty was an issue at our school. And then to support that answer with evidence from their own dataset. So they had that spreadsheet to comb through and figure out, you know, where am I gonna stand on this? We give them the multiple-choice questions we gave them as the graphs, in Google Slides, so that they could write about them and talk about them, too. So yeah, getting kids to write about data. And the the sentence frames we gave them were sentence frames out of, They Say, I Say, from the chapter on writing about science. And <laugh> as they write this stuff, they’re like, “I feel so smart writing this way.” And I’m like, “I know, ’cause you’re writing about big important topics!” Right? And writing about their own data come to think of it is another great way to make an assignment both very personal to them, but also make it ChatGPT-proof, you know, if you’re looking for something that kids can’t just hand to the robot, the robot doesn’t have that data set.

Eric Cross (00:37:08):

Absolutely. And Donnie, at the elementary level, do you, do you make connections between science and literacy? In your class? You talked about with math, definitely with the solar system, but now, I’m curious, what are your newer projects? What have you been working on lately?

Jennifer Roberts (00:37:23):

What’s up now, Donnie?

Eric Cross (00:37:24):

Yeah, what are you doing?

Donnie Piercey (00:37:25):

Oh, man. Well, let me think. I’m just trying to think of some fun projects that we’ve done this year. Science that we can tie in Literacy and also some student creation. Just recently we had a … so I’ve wanted to expose my students to famous scientists that weren’t just white dudes from Europe. So for this year, what I did — and I actually used AI for this — I went into ChatGPT and I asked for 64 famous scientists and it listed them all off. And then I asked it, like, how many of these were white? And I think it said like 61 of them. You know, it had like Neil DeGrasse Tyson, and a couple of other … I didn’t know who they were. So I’m like, “All right, so we need to make this more diverse and make this more equitable.” ‘Cause you know, with the student population in my classroom, try to find equal representation to make sure they can see themselves in some of these scientists. So, eventually got it narrowed down to where I had about 64 scientists. Half are women, half are men from all continents except Antarctica. I assigned these scientists to my students. Some got two; some got three. And their assignment was to go and one, do some individual research on this person, find out what they were famous for, what they were most well-known for, turn it actually into a persuasive piece, where I said, “Hey, you’re gonna have one slide.” And I’ll tell you why I gave him one slide in a minute. On that one slide, you’ve gotta convince the person who sees it that this scientist is the most important scientist since the dawn of creation. I said, “You could use images, text — I don’t care if they were famous for something that you didn’t even understand what it was. It’s a persuasive piece. You’re 10. Go all out. Add gifs, do that whole thing.

Eric Cross (00:39:21):

This is awesome.

Jennifer Roberts (00:39:21):

I wanna do this project.

Donnie Piercey (00:39:23):

And if you picked up on the number 64, and I did this in March, so what we did was throughout the weeks of March Madness of the women’s and men’s NCAA tournament, whenever a game was going on, we had another round of voting. I just paired ’em up. I was gonna like seed them, like 1 to 64 — that’s just way too much work for me <laugh>. So I just kind of did random kind of thing. But all the students had to do — they just saw the slides side-by-side, and the only question they had was, “Based on what you see here, who is the most important scientist? This person or this person?” And it eventually came down to Carl Sagan going up against Marie Curie.

Eric Cross (00:40:04):

OK, that’s a good matchup.

Donnie Piercey (00:40:06):

Yeah, well, the Marie Curie slide, they just liked the radium piece. So they added like some green glowing gifs. And I said, “Guys, it doesn’t always grow glow green.” But whatever. Anyway, eventually Carl Sagan, in case you wanted to know, according to the 10-year-olds in my classroom, is the most important scientist in the history of the world. So I don’t know if I agree with that per se — I think maybe Newton or somebody else might have had something else to say about it — but fun assignment. It was a unique way to expose my students to a bunch of ideas. I remember the student that I assigned Newton, the only thing that that she knew about Isaac Newton was “Didn’t he get hit in the head with an apple?” And I said, “Well, not exactly, I think you might have read or maybe seen too many like old-school cartoons or whatever.” But she ended up doing some research. She’s like, “Oh, I’ve heard of that before! That equal and opposite reaction thing.” Didn’t know what it meant. I had another student that just got really … you know, if you’ve ever been on one of those YouTube kicks where it’s just, you go like nine levels deep onto like, “What does this theorem mean?” Student sits in back of my classroom, I walked by one day and he’s just watching something on like the fifth dimension and what it might be. And I said, “Oh, your scientist got you started on that.” So definitely was a lot of fun. Unique way to combine reading, writing, but also expose my students to some ideas. And we’re definitely gonna do it again. I’ve actually done this assignment before. I picked 64 random elements on the periodic table. But their only slide that they have to make is “What’s your element? What is it used for? And then, why is this the most important element since the dawn of creation?” <Laugh> And, you know, there’s always that student that gets hydrogen. They’re just like “Sweet!” Right? They get excited about that one. <laugh>

Eric Cross (00:41:59):

Explosions.

Donnie Piercey (00:42:00):

Yeah. But then, for that kid who likes a challenge, or that student with the “gifted” label, you give them, like, einsteinium or palladium. Some of the more challenging ones. And they go all out with this. I didn’t use AI for that one, but it was kind of fun, and I figured it’d be neat to share an idea that another teacher could try.

Eric Cross (00:42:20):

Well you probably have at least two teachers right now that are gonna go and try that. And we’re both looking at you. So.

Donnie Piercey (00:42:24):

Go for it.

Eric Cross (00:42:25):

Thanks for that idea. I’m imagining my students coming in with jerseys with “neon.”

Donnie Piercey (00:42:29):

Oh yeah. <laugh>

Eric Cross (00:42:30):

“Neon” on it. Just all ’80s out.

Donnie Piercey (00:42:33):

The game behind it, too, is you tell kids — again, this is just so the 10-year-olds in my class don’t get their feelings hurt — but I say, “Hey, and if your element gets knocked out, you just have to start cheering for whoever beats you in the tournament.” So by the end, you kind of got half the class cheering for one and half the class cheering for whatever.

Jennifer Roberts (00:42:53):

So the only thing I got outta that whole story that I’ve got for you is, as a child I met Carl Sagan. That’s all I got.

Donnie Piercey (00:43:02):

For real?

Jennifer Roberts (00:43:02):

For real.

Donnie Piercey (00:43:03):

So did he talk with that cadence and tone?

Jennifer Roberts (00:43:06):

Yes.

Donnie Piercey (00:43:06):

Like in real life? Wow.

Jennifer Roberts (00:43:07):

Yes. My father was one of the cinematographers on the original Cosmos. And I got to go to the set a few times.

Donnie Piercey (00:43:14):

That’s incredible!

Jennifer Roberts (00:43:15):

I did not appreciate what I was seeing as a child. But as an adult, I’m like, “That was cool. I was there.”

Donnie Piercey (00:43:20):

“You can see my shadow off in the distance.”

Jennifer Roberts (00:43:23):

I mean, maybe that’s part of why I’ve always had an interest in science. I’ve always had fantastic science teachers. Every science teacher I ever had was amazing.

Donnie Piercey (00:43:31):

I credit mine to Mr. Wizard. I don’t know if you ever watched Mr. Wizard and Beakman’s World?

Eric Cross (00:43:35):

I remember Mr. Wizard. Yep. Yep. I definitely remember Mr. Wizard, Beakman’s World, all those. That was on Nickelodeon back in the day. I had to get up early to watch that one. But there’s a YouTube video—

Donnie Piercey (00:43:44):

Six am!

Eric Cross (00:43:44):

<laugh> It was! It was super-early! But there was one, Don, I don’t know if you’ve seen this on YouTube, but it said “Mr. Wizard Is Mean,” and it’s just clips of when he’s—

Donnie Piercey (00:43:56):

Yelling at kids!

Eric Cross (00:43:56):

Chastising. Or being really direct. It’s just one after another.

Donnie Piercey (00:44:02):

He always asked ’em a question and if the kid, you know, didn’t answer it right, he’d be like, “Well, you’re not right, but you’re wrong.” You know, whatever. <Laugh>

Eric Cross (00:44:14):

I have to make sure I’m not subconsciously saying Mr. Wizard quotes when I’m talking in the classroom, when things are happening. But yeah, that video’s hilarious. So I just want to bring us back to AI, and ask this question: Do you think science has a special role to play when it comes to teaching kids about AI responsibly? Does science have a special role in that?

Jennifer Roberts (00:44:36):

I think the responsible piece of AI I wanna teach my students about is the part about the bias in the algorithms and the bias in the training. And I want them to understand how it works, well enough to make informed decisions about how it impacts their lives.

Donnie Piercey (00:44:56):

Hmm.

Jennifer Roberts (00:44:57):

Because I do have concerns about a tool that was trained on the internet. And the answers it gives you is the average of the internet. And do we trust the internet? And the answer from kids is always, “Well sorta, no.” <Laugh> So I want them to understand the social science behind that.

Donnie Piercey (00:45:18):

Yeah. And just along that same point, having the students recognize that just because, you know, you copy-and-paste a question in, the answer it spits out might not always be correct. So, teaching them that just like you would with a source that you find about a topic that you’re researching, you’ve gotta fact-check.

Jennifer Roberts (00:45:44):

It’s just like being a good scientist. A good scientist wouldn’t always accept a single result or the first result. You know, you would look at multiple angles. You would try things different ways. Last week I took the article my seniors were reading about victim compensation after 9-11, and in front of them, I gave ChatGPT, I said, “Are you familiar with this article by Amanda Ripley? And ChatGPT came back and said, “Oh yes, this was written in the Atlantic in 2020 and it’s about these things, blah, blah blah.” And my students looked at that and went, “That’s not the article we read.” And I said, “I know. It got it wrong. That’s amazing!” Yeah. And I was so happy that it got it wrong! ‘Cause I wanted them to see that happen.

Donnie Piercey (00:46:21):

And I guess one of the big science questions there, or one of the big science components there, is that idea of inquiry. Right? It’s almost like you have to teach students how to ask those deep questions about what AI spits out.

Eric Cross (00:46:35):

All of those tips are great. And it leads me to this last question I want to ask. New teachers that are out there — it actually doesn’t even matter; new teachers, experienced teachers, all of us are kind of new at different levels of this race. We’re all kind of starting it together. I mean, it hit mainstream. We’re all getting exposed to it. You all really dive into it. When tech comes out, I know you two really like, “OK, how can we use this to transform education and do awesome things for kids?”

Donnie Piercey (00:47:04):

Usually, when new tech comes out, “How can this make my life easier?” is usually the question. Yeah.

Jennifer Roberts (00:47:09):

“How can I save myself time with this?” Yes.

Donnie Piercey (00:47:11):

“How can this result in me watching more TV and you know, less grading,” sometimes.

Eric Cross (00:47:16):

And I start there like you, but then I end up more time that I fill with another project. And I need to learn how to stop doing that. I’m like, “Oh! I got more free time! … to go take on this other task.”

Jennifer Roberts (00:47:28):

Oh, all of my tech adoption is driven by “how can I work less?”

Eric Cross (00:47:32):

So you’re you’re talking to a new teacher, teacher’s getting exposed to this, they’re starting the school year or they’re just getting their feet wet with it. What advice would you give them about AI, incorporated into content or even just best practices? Where you’re at right now in your own journey, and someone’s asking you about it —what would you share with ’em? And Jen, I want to start with you.

Jennifer Roberts (00:47:53):

So, the first thing I did is I was in the middle of grading, you know, 62 essays from my seniors about Into the Wild, when ChatGPT became a thing last November. And I wanted to see what would happen. So the first thing I did was take the prompt that I had given my students and gave it to ChatGPT, ’cause I had just graded a whole bunch of those essays and my brain was very attuned to what my rubric was doing and what I was expecting as the outcome. So I could take what ChatGPT gave me as that quote unquote “essay” and evaluate it critically. And I was ready to do that. So my first advice is take something you’re already asking students to do and ask ChatGPT to do the same thing. So that as you look at the student results, you can compare that to what ChatGPTgives you. If what you’re finding is that ChatGPT can generate something that would earn a decent grade from you, you might need to change that assignment. And it doesn’t need to be a big change, but it might need a tweak or something, so that it, it does rely on the student voice, the students to do something more personal. I’m finding very helpful in my classroom is having my kids do projects where they are recording themselves on — I like Flip. So they’re writing a scene together and they’re having to record the scene together. And I’m emphasizing more of the speaking roles than the writing roles necessarily. So yes, first, take something you’re already doing, paste in to ChatGPT, see what the results are, see how that fits with what your students are doing, and then do that for every assignment you give and just sort of see what comes out of that, and see which assignments are failing and which assignments are working. ‘Cause that’s gonna give you a sense, when you do see one of those results from your students, you’ll be able to recognize it. But it’ll also help you tweak your assignments and decide, “How can I make this a little more original or a little bit more authentic for my students?” And if the robot, if the AI, can’t generate a response, what could the AI do that would be helpful to your students? Would be my next question. So can you use the AI to help them generate an outline? Can you use the AI to help them generate a list of steps to help them get started? And when you’re comfortable enough doing that by yourself, then don’t be afraid to open it in front of your class. If it’s not blocked at your school site, which I hope it’s not. Because I think the advantage goes to kids who have access to this in the long run, or at least see what it is and know what it is. Right? Because if a kid graduates from school without knowing that AI exists, they’re not gonna be prepared for what they face out in the world. So give them a chance to see you using it. Model effectively using it. I have a blog post about that. I just wrote it. LitAndTech.com. You can check that out. “Introducing 9th graders to ChatGPT.” How it went, right? There’s a chart there you can have. It’s my very first draft of this, but it seems to be very popular. So, you know, show students how it can be used as their mentor. If I can’t come read your paragraph because I have 36 kids in my classroom and I cannot stop and read everybody’s first paragraph, can you, if you want to, give your first paragraph to ChatGPT and ask for advice? And will that advice be helpful to you? So showing students how it can be used responsibly is, I think, something every teacher should be doing right now. And don’t hold back just because you’re afraid you’re gonna be teaching them what this is. They know what this is. Right?

Donnie Piercey (00:51:13):

They know what it is.

Jennifer Roberts (00:51:13):

Especially if you teach high school. They know what it is. I’ve had parents thank me for showing them how to use it responsibly. You know, this can actually be a really useful tool, but if you’re trying to make it do your work for you, it will probably fail you. If you’re trying to use it to help you do your work, it will probably be helpful. Sort of the way I’m breaking it down for them at this point. You want the great metaphor? The great metaphor is if you build a robot and send it to the top of a mountain, did you climb that mountain? No. If you build a robot and ask it to help you get to the top of the mountain, and you and the robot go together, did you climb that mountain? Yes.

Eric Cross (00:51:53):

I like that. I’m thinking through this. I’m processing that now.

Donnie Piercey (00:51:57):

Me too.

Eric Cross (00:51:59):

Yeah. I just imagine a robot holding my hand climbing Mount Everest and I’m like, “Yeah, I did it.”

Donnie Piercey (00:52:04):

If I got a robot though, like I would have to dress it like Arnold Schwarzenegger in Terminator 2. Like I would just have to.

Eric Cross (00:52:10):

Of course.

Donnie Piercey (00:52:10):

Of course.

Eric Cross (00:52:13):

Donnie, same question. Advice. Teachers getting immersed into it. Tips. What would you say?

Donnie Piercey (00:52:20):

So, I would definitely agree with everything that Jen said. Just, if anything else, to familiarize yourself with it. Almost like pretend like it’s a student in your classroom and it’s answering questions, just so that way you can see what it can do. And you’re kind of training yourself, like, “Oh, well, if I ever need examples, exemplars.” If you’re in a writing piece and you don’t wanna sit there and write out four different types of student responses — you know, advanced writer, beginning writer, whatever — great way to to do that is you just—

Jennifer Roberts (00:52:48):

Oh yeah. We did that.

Donnie Piercey (00:52:48):

—copy the prompt in and give a beautifully written piece that a fifth grader would be impressed with. Boom. It’ll do it for you. In my classroom, the way that I approach it is I kinda look at AI as almost like this butler that I don’t have to pay. That if I need it to do something for me, it’s just bookmarked. I can click it. And I mean, sometimes I just talk to it like it’s a person. And it’s almost like, in the chat window, I’m just rambling at it, what I’m trying to do. And it’s almost like I’m talking to a coworker, and I’m trying to hedge out some ideas for a lesson. Simple example: For a science lesson, if you’re trying to come up with … let’s say you’re a fifth-grade — or, sorry, I teach fifth grade. Say you’re a seventh-grade science teacher. And you’re trying to teach the students in your class about Newton’s third law of motion. You know, every action [has an ] equal and opposite reaction. Look around your room. See what you have. Maybe look around and you’re like, “All right, I got a whiteboard, microscope, I’ve got magnets, a cylinder. …” And you just copy all this stuff into ChatGPT. Say, like, “Hey, I have all of these items. Cotton balls, peanut butter, whatever.” And say, “I’m trying to teach students Newton’s third law of motion. Give me some ideas of some ways I could teach it using some of these materials.” And it’ll do it! It’ll give you like five to 10 ideas!

Jennifer Roberts (00:54:15):

And then tell it what your students are into. Like, my students are really into basketball. Can you work that into this lesson?

Donnie Piercey (00:54:21):

Yeah! They’re into the Avengers! Hey, find some way to tie Spider-Man into this. You know, that was a pun that didn’t go so well. But, you know <laugh> figure out some way that you could incorporate this and it’ll do it. And Eric, like you said, it won’t be perfect. Right? But if anything else, if you’re a starting teacher and you’re trying to brainstorm ideas — try it.

Eric Cross (00:54:44):

And Donnie, as you were saying that, I was thinking — first, I imagined Spider-Man shooting cotton balls with peanut butter all over them — and then my mind went to having students have these items, like you were saying. And then they create labs, working alongside AI. To do inquiry. To create a lab about something, and then going and performing and collecting data. OK, that’s — now I wanna go do that tomorrow!

Donnie Piercey (00:55:10):

Listen, it is so easy to do. If you have an extra computer in your classroom. … We were talking about Jarvis and Iron Man and Tony Stark earlier. Make a new chat in ChatGPT. Tell it, “I want you to pretend that you are Tony Stark. Only answer questions as if you are Tony Stark.” Or “Pretend you’re Jarvis.” Whatever. “Stay in character the whole time. I’m going to have sixth grade students come up to you and ask you questions about science or forces of nature, and only answer questions like you’re Iron Man.” And guess what? You keep that station in your classroom. Students are working on a project — you know, in elementary school, a lot of times we’ll have that, “ask three before me” — you’re supposed to ask three friends before you go and bug the teacher. Well, maybe one of those “three before me” can be that little computer station, where they go up and ask Tony Stark a question, and then it answers them as Jarvis or Iron Man. I mean, we’re really just scratching the surface with all this AI stuff. And as more and more companies and more and more creatives are gonna start to realize everything that it can do, we’re gonna start to see it more and more. And hopefully we as teachers can really figure out how to use this tool to, of course, help students, but also help them be creative and explore and learn on their own.

Eric Cross (00:56:35):

That’s amazing. And just both of you are just dropping gems right now. And I wanna wrap up by saying — and I’ve said this before on earlier podcasts I’ve done — but at this phase in my life, the people that I’m the biggest fans of are teachers. And it’s true. I don’t mean that in a cliche way. When I watch celebrities and things like that, when I watch professional sports, that doesn’t fill me the way it used to when I was a kid. At this point, as a professional, I get inspired by other educators who are just doing awesome things. And when I think about educators who are doing that, you two are on that list of people that make me better. And when I get better, I can do better things for my kids. And so, one, I want to thank you for staying in the classroom and continue to support students. They’re so lucky to have you both. The second thing I wanted to say is, Jen, I wanna start with you. Where can people — and I know we said at the beginning — but where can people find the stuff that you put out? You got blogs, your social, your book.

Jennifer Roberts (00:57:28):

I got lots of social. Twitter, I’m JenRoberts1 on Twitter. And then my blog is LitAndTech.com. And then I’m on lots of the new social too, the Mastodons, the Spoutables, the Posts — those kinds of things — as just Jen Roberts, because I got in early and I got my real name without a 1. And there was some other one I’m on recently that I’ve forgotten about. But there’s lots of ’em. They’re fun. And I’m Jen Roberts. You can find me there.

Donnie Piercey (00:57:56):

And I’m SergeantPepperD on AOL, if anyone’s interested.

Eric Cross (00:58:00):

If you wanna hit Donnie up on AIM. <Laugh>

Donnie Piercey (00:58:03):

SergeantPepperD.

Jennifer Roberts (00:58:04):

You know, speaking of rock stars and people who do amazing things, I did write a blog post about using ChatGPT in the classroom, but I hear Donnie wrote a whole book.

Eric Cross (00:58:13):

Oh yeah. So, Donnie! Donnie, that’s a great segue. Thanks Jen. Donnie, how do people find out more? And can you tell us about this book you wrote, that’s coming out in the summer?

Donnie Piercey (00:58:22):

Yeah, so the book I wrote is called 50 Strategies for Integrating AI Into the Classroom. It’s published by Teacher Created Materials. They reached out to me. They had seen some of the stuff that I was doing, not just with ChatGPT, but also some image-generating AI stuff. You know, I got featured on Good Morning America, which was kind of cool. And they saw that and they said, ‘Hey, that looks really neat.” Reached out to me and asked me to write a book. And the idea behind the book, that launches this summer, it’s just 50 ideas, 50 prompts, different things that, as a classroom teacher, that you can do. So, you know, I think there’s so many AI books that are out there now. A lot of them are big ideas, which I think are important. Definitely important discussions that need to be, have around, the ethics of AI. What’s the role that AI should play in the classroom. But I just wanted to write a book, kind of like the discussion that, that Jen and I were just having, which is like, “Can we just share a whole bunch of ideas, different things that we could try with our students?” So definitely check it out. And I appreciate you giving me a shout-out too. That was cool, Eric. Thank you.

Eric Cross (00:59:35):

Of course. Definitely. And Donnie, your Twitter is again. …

Donnie Piercey (00:59:39):

Oh, @MrPiercey, M R P I E R C E Y.

Eric Cross (00:59:44):

Follow Donnie. Follow Jen. Tons of stuff on there. Both of you, thank you so much. For your time, for talking about students and how we can take care of them, science, literacy, AI. I hope we can talk about this again. I feel like even if in just six months, we might be saying different things. In a year, the landscape might completely change. And that makes it really fun. But thank you both for being on the show.

Jennifer Roberts (01:00:04):

Thank you for having us, Eric.

Donnie Piercey (01:00:05):

Thank you so much, Eric. We appreciate it, bud.

Eric Cross (01:00:10):

Thanks so much for listening to my conversation with Jen Roberts and Donnie Piercey. Jen Roberts is a veteran English teacher at San Diego’s Point Loma High School and author of the book Power Up: Making the Shift to 1:1 Teaching and Learning. You can keep up with her at LitAndTech.com. And Donnie Piercey is a fifth-grade teacher from Lexington, Kentucky. He hosts the podcast Teachers Passing Notes. Stay up-to-date with him at Resources.MrPiercey.com. And let us know what you think of this episode in our Facebook discussion group, Science Connections: The Community. Make sure you don’t miss any new episodes of Science Connections by subscribing to the show, wherever you get podcasts. And as always, we’d really appreciate it if you can leave us a review. It’ll help more people and AI robots find the show. You can find more information on all of Amplify’s shows on our podcast hub, Amplify.com/hub. Thanks again for listening.

Stay connected!

Join our community and get new episodes every other Wednesday!

We’ll also share new and exciting free resources for your classroom every month!

What Jennifer Roberts says about science

“If I’m not teaching my students how to use this, then they’re not going to turn into the adults we need them to be… If we’re not at least trying to think about what our future world is going to look like, then we’re not serving our students well.”

– Jennifer Roberts

High School English Teacher

Meet the guests

Jen Roberts is a Nationally Board Certified high school English teacher with 25+ years of experience teaching Social Science and English Language Arts in grades 7-12. She has had 1:1 laptops for her students since 2008 and is the co-author of Power Up: Making the Shift to 1:1 Teaching and Learning. A Google for Education Certified Innovator since 2011, Jen was named the CUE Outstanding Educator in 2022. Her interests include literacy instruction, standards based grading, and leveraging Google tools to make her teaching more efficient and effective.

A woman with light skin and blond hair stands outdoors, framed by illustrated graphics including a blue flask and curved lines. Green foliage is visible in the background.

Donnie Piercey, the 2021 Kentucky Teacher of the Year, is a fifth-grade teacher in Lexington, Kentucky.  With a passion for utilizing technology to promote student inquiry, learning, and engagement, he has been teaching since 2007. In addition to being in the classroom, he runs a podcast, Teachers Passing Notes that is produced by the Peabody Award winning GZMShows, and holds several recognitions, including a National Geographic Fellowship to Antarctica in 2018. His most recent work in Artificial Intelligence has not gone unnoticed, earning him multiple appearances on Good Morning America, the Associated Press, and PBS. His upcoming book, “50 Strategies for Integrating AI in the Classroom” published by Teacher Created Materials, is written for educators looking for practical classroom approaches to using AI. All told, Donnie has been invited to keynote and present at schools in thirty-three states and on five continents.

A man with short brown hair and a beard smiles at the camera, wearing a red shirt, framed by a circular graphic with a blue flask icon.
A laptop screen displays the “Science Connections: The Community” private group page, with science-themed icons decorating the background and edges.

About Science Connections

Welcome to Science Connections! Science is changing before our eyes, now more than ever. So…how do we help kids figure that out? We will bring on educators, scientists, and more to discuss the importance of high-quality science instruction. In this episode, hear from our host Eric Cross about his work engaging students as a K-8 science teacher. 

Big gains but slow progress in reading readiness

A woman shows a young girl something on a smartphone while they sit together at a table in a classroom, exploring reading comprehension strategies.

Amplify’s end-of-year research brief for 2024–25 shows that the youngest learners have made the greatest progress with foundational reading skills in the last five years: more kindergarteners, first graders, and second graders are on track to learn to read and fewer are far behind than at any time since the pandemic.

Kindergarteners made the biggest strides in the knowledge and skills measured by elementary reading assessments, with 70% on track to learn to read—a 21-point improvement since the pandemic.

Post-pandemic slide

In 2020–21 (the year students returned to school after the pandemic shutdowns), only 55% of K–2 students were on track to learn to read by the end of the year.

The youngest cohort struggled the most, with only 49% of kindergarteners at or above benchmark.

More students on track to learn to read

But by the end of the 2024–25 school year, the overall picture of reading readiness was much brighter.

Our data shows a 13-point increase, with 68% of the youngest readers at or above benchmark.

First and second graders were also far ahead of where they were five years ago, with improvements of 14 and 8 points, respectively.

Progress slowing

While our 2024–25 end-of-year early reading data shows significant progress relative to 2020-21, the picture is less rosy when we compare it to last year:

  • Overall, the number of K–2 students at or above literacy benchmarks was only one percentage point higher at the end of 2024–25 than it was at the end of the previous school year.
  • Within that cohort, both kindergarten and first graders saw a 2% increase, but second graders only saw a 1% increase.

Fewer students far behind

Similarly, our data showed a significant drop in the number of young readers well below benchmark between the post-pandemic school year and the 2024–25 school year.

  • Kindergarteners, again, showed the most improvement, with the number of students far behind dropping from 38% in 2020–21 to 20% at the end of the 2024–25 school year.
  • Among first graders, we saw a 12-point decline in students who were not on track to learn to read compared to 2020–21
  • Second graders showed the least improvement, with a decline of six percentage points relative to 2020-21.

Improvements among this cohort followed a similar trend to those of the at-benchmark readers: a noticeable decline over five years, but a barely noticeable year-over-year improvement.

  • Only 1% fewer students across K–2 were far behind at the end of this year compared to the year before.

More improvement during the school year

Our data also revealed some good news about annual progress in early literacy development:

  • Across K–2, students showed a bigger improvement in reading readiness than they did in prior years.
  • By the end of the 2024–25 school year, 70% of kindergarten students were on track to learn to read, compared to 36% at the beginning of the year (the greatest improvement since 2020–21).
  • First graders had a 19% improvement by the end of the 2024–25 school year (70% on track by end of year) compared to 56% in 2021.
  • Second graders showed an 11-point increase in reading readiness from beginning to end of year (65% to 54%).

Putting the Science of Reading to work for students

“Grades K–2 remain critical years for literacy development,” said Susan Lambert, Chief Academic Officer of elementary humanities at Amplify and host of Science of Reading: The Podcast. “To support young readers, educators need data-driven insights into student reading development and instructional practices that are based in the Science of Reading.”

Research has shown that data-driven strategies and tools provide the best support for young learners’ future academic success. Here are a few of the ways teachers, administrators, and parents can put them into practice:

  • Administering elementary reading assessments three times a year, to monitor student risk level for reading challenges
  • Supporting students at risk for not learning to read by analyzing data from reading assessments and making informed decisions
  • Allocating extra classroom time and resources to help students who aren’t on track
  • Monitoring progress and making adjustments as needed
  • Ensuring that evidence-based reading instruction is offered at every grade level
  • Instilling a love of reading in and out of school, in partnership with caregivers and community

Let’s keep the conversation going! Join the discussion in our Amplify learning communities.

Dive into the findings in our End-of-Year Report.

More to explore

Science of Reading: The Podcast

Beyond My Years podcast

Science of Reading

Science of Reading: A New Teacher’s Guide ebook

Families and caregivers, welcome to Amplify Desmos Math 6–12!

Welcome to the Amplify Desmos Math Grade 6–Algebra 2 Caregiver Hub. We’ve designed this space to help you support your student at every stage of their math journey. 

In class, your student engages with digital lessons using devices as well as write-in Student Edition books. They also may be assigned digital or print practice outside of class. Below, you’ll find some suggestions and resources for how you can support their learning at home.

Learn more about Amplify Desmos Math.

Para la versión en español, haga clic aquí.

Person wearing a construction hat and safety vest in a wheelchair, discussing with a phone and controlling the placement of a large triangular piece in a construction setting, with math symbols around.

Caregiver Unit Resources

For every unit of the program, we’ve created a Caregiver Resource that provides a summary of each lesson, plus a problem to try with your student (and an answer key). These resources are available in both English and Spanish, as well as a glossary of key terms in both languages.

Unit 1: Area and Surface Area

Unit 2: Introducing Ratios

Unit 3: Rates and Percentages

Unit 4: Dividing Fractions

Unit 5: Decimal Arithmetic

Unit 6: Expressions and Equations

Unit 7: Positive and Negative Numbers

Unit 8: Describing Data

Unit 1: Scale Drawings

Unit 2: Introducing Proportional Relationships

Unit 3: Measuring Circles

Unit 4: Proportional Relationships and Percentages

Unit 5: Operations With Positive and Negative Numbers

Unit 6: Expressions, Equations, and Inequalities

Unit 7: Angles, Triangles, and Prisms

Unit 8: Probability and Sampling

Unit 1: Rigid Transformations and Congruence

Unit 2: Dilations, Similarity, and Slope

Unit 3: Proportional and Linear Relationships

Unit 4: Linear Equations and Linear Systems

Unit 5: Functions and Volume

Unit 6: Associations in Data

Unit 7: Exponents and Scientific Notation

Unit 8: The Pythagorean Theorem and Irrational Numbers

Unit 1: Area and Surface Area

Unit 2: Introducing Ratios and Rates

Unit 3: Fractions and Decimals

Unit 4: Expressions and Equations

Unit 5: Proportional Relationships

Unit 6: Percentages

Unit 7: Positive and Negative Numbers

Unit 8: Data Sets and Distributions

Course Glossary

Unit 1: Rigid Transformations and Congruence

Unit 2: Scale Drawings, Dilations, and Similarity

Unit 3: Equations and Inequalities

Unit 4: Linear Relationships and Systems of Linear Equations

Unit 5: Functions

Unit 6: Associations in Data

Unit 7: Volume and Surface Area

Unit 8: Exponents and Scientific Notation

Unit 9: Pythagorean Theorem and Irrational Numbers

Course Glossary

Unit 1: Patterns and Sequences

Unit 2: Linear Equations and Inequalities

Unit 3: Describing Data

Unit 4: Describing Functions

Unit 5: Systems of Linear Equations and Inequalities

Unit 6: Exponential Functions

Unit 7: Quadratic Functions

Unit 8: Quadratic Equations

Unit refresh videos

Unit 1

  • Sub-Unit 1a – Calculating the Area of Parallelograms
  • Sub-Unit 1b – Calculating the Area of Triangles
  • Sub-Unit 2 – Determining the Surface Area of Rectangular Prisms

Unit 2

Unit 3

Unit 4

  • Sub-Unit 1 – Dividing Fractions Using Tape Diagrams
  • Sub-Unit 2 – Dividing Fractions Using Common Denominators
  • Sub-Unit 3 – Determining the Volume of Prisms With Fractional Dimensions

Unit 5

  • Sub-Unit 1 – Adding and Subtracting Decimals
  • Sub-Unit 2 – Multiplying Decimals Using Area Models
  • Sub-Unit 3 – Dividing Decimals Using Fractions
  • Sub-Unit 4 – Converting Between Fractions, Percents, and Decimals

Unit 6

  • Sub-Unit 1 – Writing and Solving Equations
  • Sub-Unit 2 – Writing Equivalent Expressions Using the Area Model
  • Sub-Unit 3 – Evaluating Expressions With Exponents
  • Sub-Unit 4 – Interpreting Graphs

Unit 7

  • Sub-Unit 1 – Ordering and Comparing Positive and Negative Numbers
  • Sub-Unit 2 – Identifying Solutions to Inequalities
  • Sub-Unit 3 – Plotting Points on the Coordinate Plane

Unit 8

  • Sub-Unit 1 – Creating Dot Plots
  • Sub-Unit 2 – Calculating Mean Absolute Deviation
  • Sub-Unit 3 – Interpreting Box Plots
  • Sub-Unit 4 – Predicting Population Using Sample Data (For use with Amplify Desmos Math New York)
  • Sub-Unit 5 – Predicting Sample Spaces Using Proportional Relationship (For use with Amplify Desmos Math New York)

Unit 1

  • Sub-Unit 1 – Using Ratios to Determine the Scale Factor Between Scaled Copies
  • Sub-Unit 2 – Using Ratios to Determine Unknown Scales in Scale Drawings

Unit 2

  • Sub-Unit 1 – Determining the Constant of Proportionality
  • Sub-Unit 2 – Writing Equations for Proportional Relationships
  • Sub-Unit 3 – Comparing Proportional Relationships
  • Sub-Unit 4 – Representing Proportional Relationships with Multiple Representations

Unit 3

  • Sub-Unit 1 – Determining the Circumference of a Circle
  • Sub-Unit 2 – Calculating Areas of Complex Shapes

Unit 4

Unit 5

  • Sub-Unit 1 – Adding and Subtracting Positive and Negative Number
  • Sub-Unit 2 – Dividing Integers
  • Sub-Unit 3 – Solving Real-World Problems Involving Positive and Negative Numbers

Unit 6

  • Sub-Unit 1 – Writing Equations from Descriptions and Tape Diagrams
  • Sub-Unit 2 – Solving Equations With Positive and Negative Numbers
  • Sub-Unit 3 – Solving Inequalities

Unit 7

  • Sub-Unit 1 – Determining Unknown Angle Measures
  • Sub-Unit 2 – Determining If Three Segments Form a Triangle
  • Sub-Unit 3 – Calculating the Surface Area of Prisms

Unit 8

  • Sub-Unit 1 – Predicting Sample Spaces Using Proportional Relationships
  • Sub-Unit 2 – Predicting Population Using Sample Data

Unit 1

  • Sub-Unit 1 – Determining Coordinates After a Rotation
  • Sub-Unit 2 – Using Rigid Transformations to Determine if Two Figures on the Grid are Congruent
  • Sub-Unit 3 – Determining Unknown Interior and Exterior Angles

Unit 2

  • Sub-Unit 1 – Performing Dilations on a Square Grid
  • Sub-Unit 2 – Determining Missing Side Lengths in Similar Triangles
  • Sub-Unit 3 – Calculating Slope By Drawing Similar Triangles on a Coordinate Plane

Unit 3

  • Sub-Unit 1 – Writing Equations to Represent Proportional Relationships
  • Sub-Unit 2 – Interpreting Slope and Intercepts of Linear Relationships
  • Sub-Unit 3 – Calculating Slope Given Two Points

Unit 4

  • Sub-Unit 1 – Solve Single-Variable Equations with Parentheses
  • Sub-Unit 2 – Solving Systems of Linear Equations by Graphing

Unit 5

  • Sub-Unit 1 – Justifying Whether a Graph Represents a Function
  • Sub-Unit 2 – Comparing Properties of Linear Functions
  • Sub-Unit 3 – Calculating Volumes of Cylinders

Unit 6

  • Sub-Unit 1 – Interpreting Points on a Scatter Plot
  • Sub-Unit 2 – Using Lines of Fit to Make Predictions
  • Sub-Unit 3 – Calculating Missing Values in Two-Way Tables

Unit 7

Unit 8

  • Sub-Unit 1 – Approximating Square Roots
  • Sub-Unit 2 – Calculating Unknown Side Lengths
  • Sub-Unit 3 – Identifying Rational and Irrational Numbers

Unit 1

  • Sub-Unit 1 – Determining If a Sequence is Arithmetic, Geometric or Neither
  • Sub-Unit 2 – Using Visual Patterns or Terms in the Sequence to Write Explicit Expressions for Arithmetic and Geometric Sequences

Unit 2

  • Sub-Unit 1 – Solving Linear Equations
  • Sub-Unit 2 – Solving Multi-Variable Linear Equations
  • Sub-Unit 3 – Graphing Solutions of Two-Variable Linear Inequalities

Unit 3

  • Sub-Unit 1 – Calculating Values in Two-Way and Relative Frequency Tables
  • Sub-Unit 2 – Comparing Data Using Mean and Standard Deviation
  • Sub-Unit 3 – Interpreting Slope and y-intercept in Context

Unit 4

  • Sub-Unit 1 – Evaluating Function Notation
  • Sub-Unit 2 – Writing Domain and Range with Inequalities
  • Sub-Unit 3 – Graphing Piecewise-Defined Functions
  • Sub-Unit 4 – Writing Recursive Definitions in Function Notation

Unit 5

  • Sub-Unit 1 – Solving Systems of Linear Equations by Substitution
  • Sub-Unit 2 – Graphing Solutions to Systems of Inequalities

Unit 6

  • Sub-Unit 1 – Writing Exponential Functions from Graphs
  • Sub-Unit 2 – Calculating Percent Change in Exponential Functions
  • Sub-Unit 3 – Writing Equivalent Expressions Using Radicals and Rational Exponents
  • Sub-Unit 4 – Writing Exponential Functions Involving Compound Interest

Unit 7

  • Sub-Unit 1 – Describing Key Features of Parabolas
  • Sub-Unit 2 – Graphing Quadratic Functions in Factored Form
  • Sub-Unit 3 – Writing Quadratic Functions in Vertex Form

Unit 8

  • Sub-Unit 1 – Rewriting Factored-Form Expressions in Standard Form
  • Sub-Unit 2 – Solving Quadratic Equations by Graphing
  • Sub-Unit 3 – Solving Quadratic Equations by Completing the Square
  • Sub-Unit 4 – Solving Quadratic Equations Using the Quadratic Formula

Access Amplify Desmos Math at home.

Your student will have access to all learning, practice, and assessment materials through the Amplify platform. Students can access the digital curriculum in school and at home by following these simple instructions.

  • Click the Amplify Desmos Math button.
  • Select Log in with Amplify.
  • Enter the username and password provided by your student’s teacher.
  • Select the desired grade level.

Once logged in, you and your student can view work by opening previous assignments.

Learn how to navigate the student home page.

Support math learning at home.

You can support your student’s math learning outside of school in many ways:

Relate math to daily activities at home, whether you’re baking, grocery shopping, or planning a trip. Your student can help you calculate the prices when you use a coupon, figure out how to cut a recipe in half, or determine the amount of gas you’ll need to make it to your destination.

Invite your student to walk you through how they solved each problem or talk about any parts that were challenging for them. To encourage the use of math language, consider asking, “How do you know?,” “How can you show your thinking?,” or “How would you describe that?” If students get stuck, consider asking questions like, “What information do you know here?” or “How could you represent this problem?”

Remind your student that getting stuck is part of the process and a necessary—beneficial, even!—part of learning. Many students (and adults) fear making mistakes. But research shows that making mistakes helps our brains grow. When your student gets stuck on a problem, encourage them to keep trying different strategies, even if they’re not sure they’re right.

We hope your student enjoys exploring math, working with friends to solve problems, and learning new and interesting concepts. And we hope you enjoy this exciting math journey with them!

Get more information.

Have a question about Amplify Desmos Math? Visit our help library to search for articles with answers to your program questions. For additional support, please contact your student’s teacher.

Reveal Math

To view this protected page, enter the password below:


The early reading gender gap may be smaller than it seems.

Bar chart with three groups showing two bars each; values for young learners increase from beginning to end of year, reaching the highest literacy benchmarks at the end.

Amplify’s 2024–25 research brief on the latest end-of-year literacy data showed improvement in early literacy across grades K–2, with more young learners on track to learn to read and fewer far behind than at any time since the pandemic.

Compared to 2020–21, 8% more second graders, 14% more first graders, and 21% more kindergarteners were at or above benchmark.

We also found that while boys in grades K–2 score the same or better than girls of the same age in reading readiness at the beginning of the year, girls improved more during the school year, narrowing gaps and sometimes outperforming boys by end of year.

A complex picture of early readers

The data present a nuanced picture of gender disparities in early literacy.

Among K–2 students who were on track to learn to read at the end of the 2024–25 school year, boys began the year with the same or better early reading scores than girls.

Bar chart showing percent of male and female young learners in Grades K–2 on track for reading readiness in 2024–25, with scores increasing from beginning to end of year across all groups.

But in spite of this slim advantage, girls were ahead of boys by the end of kindergarten and first grade. Girls again narrowed the gap in second grade, but boys were still slightly ahead at the end of the year.

Similarities below the literacy benchmark

The story was similar for K–2 students at risk of not learning to read.

Across K–2, girls scored the same or better than boys, and the same trend emerged with students who were on track: During the year, girls showed more improvement than boys.

As a result, by the end of the year, fewer girls were at risk of not learning to read than boys.

Bar chart showing the percent of young learners in grades K–2 at risk of not learning to read at three points in the 2024–25 year, grouped by grade and gender, based on reading assessments.

Toward reading readiness

The latest end-of-year data show that student performance in early reading is at the highest levels since the lows of the pandemic five years ago. More students are on track for learning to read and fewer are far behind in grades K–2. But despite these successes, broad literacy trends across the United States remain a concern, as year-over-year progress across all early grades has slowed. As schools and districts align on priorities ahead of the new school year, they must take into account students who are learning to read. It’s important that schools and districts invest in a reliable universal screener, high-quality core curriculum, evidence-based interventions, and professional development.

“Grades K–2 remain critical years for literacy development,” said Susan Lambert, Chief Academic Officer of elementary humanities at Amplify and the host of Science of Reading: The Podcast. “To support young readers, educators need data-driven insights into student reading development and instructional practices that are based in the Science of Reading.”

Teachers and administrators can best support all students with data-driven strategies and tools for reaching literary benchmarks, including:

  • Administering elementary reading assessments three times a year to monitor student risk level for reading challenges.
  • Supporting students at risk for not learning to read by analyzing data from reading assessments and making informed decisions.
  • Allocating extra classroom time and resources to help students who aren’t on track.
  • Monitoring progress and making adjustments as needed.
  • Ensuring that evidence-based reading instruction is offered at every grade level.
  • Instilling a love of reading in and out of school, in partnership with caregivers and community.

How we gather data

Amplify mCLASS, our teacher-administered literary assessment and intervention suite for grades K–6, is powered by Dynamic Indicators of Basic Early Literacy Skills (DIBELS) 8th Edition—an observational assessment collected by teachers interacting with students one on one, either live or over video, typically administered three times a year (beginning, middle, and end of year).

At the end of the school year, our report highlights reading scores by comparing Amplify mCLASS with DIBELS benchmark data from the preceding six school years (2019–20 through 2024–25).

Our data represent approximately 250,000 students in a matched set of 1,400 schools in 43 states. The schools in the source data are slightly more likely to be in large urban metropolitan areas than the nation overall, but perform comparably to the much larger mCLASS national population.

Additional resources

Let’s keep the conversation going! Join the discussion in our Amplify learning communities.

Dive into the findings in our End-of-Year Report.

More to explore

Science of Reading: The Podcast

Beyond My Years podcast

Science of Reading

Science of Reading: A New Teacher’s Guide ebook

Welcome, Central Kitsap, to Amplify Desmos Math!

Amplify Desmos Math K-5 thoughtfully combines conceptual understanding, procedural fluency, and application. Each lesson is designed to tell a story by posing problems that invite a variety of approaches before guiding students to synthesize their understanding of the learning goals.

Scroll to learn more about the program and explore sample materials.

About the program

We believe in math that motivates. Our structured approach to problem-based learning builds on students’ curiosity to develop lasting grade-level understandings for all students. 

The program motivates students with interesting problems they are eager to solve. Teachers can spend more time where it’s most impactful: creating a collaborative classroom of learners.

A powerful suite of math resources

Amplify Desmos Math combines the best of problem-based lessons, intervention, personalized practice, and assessments into a coherent and engaging experience for both students and teachers.  Feel free to explore our grade-level ancillary samplers to learn more about assessment and reporting, intervention, and differentiation:

Grade K Ancillary Sampler

Grade 1 Ancillary Sampler

Grade 2 Ancillary Sampler

Grade 3 Ancillary Sampler

Grade 4 Ancillary Sampler

Grade 5 Ancillary Sampler

A digital interface displays a math screener report on the left and a math problem involving division, alongside a visual representation of students lined up on the right, integrating rich math resources from Amplify Desmos Math.

Assessment

mCLASS® Assessments, along with daily formative checks, measure not only what students know, but how they think. The asset-based assessment system provides teachers with targeted, actionable insights, linked to core and intervention resources. Visit our mClass Math site to learn more.

Two side-by-side math activities for children: on the left, a caterpillar-themed block challenge, and on the right, a worksheet for finding pairs that sum to 10. These exercises are fantastic ways to amplify children's engagement with math concepts.

Core instruction

Amplify Desmos Math lessons pair problems students are eager to solve with clear instructional moves for teachers. With low-floor, high-ceiling tasks every student can actively participate and be a part of the math community. Unit- and lesson-level core assessments give teachers data at their fingertips to guide and differentiate instruction.

A math lesson screen shows a toy sinking 5 meters into a pool. A textbox asks how many centimeters that is, with space for an answer and a "Try again" button. An avatar explains the question, using Desmos math tools to amplify understanding.

Differentiation

Boost Personalized Learning activities help students access grade-level math through engaging, independent digital practice. Responsive Feedback adjusts to students’ work, providing item-level adaptivity to further support their learning and offer personalized differentiation. Visit our Boost Math site to learn more. 

Two pages from a New York math textbook on determining coordinates after a rotation. Includes sections on modeled review, guided practice, and teacher's notes, with diagrams and examples that amplify the learning experience.

Embedded intervention

Integrated resources like Mini-Lessons, Fluency Practice, and Math Adventures provide targeted intervention on a specific concept or skill connected to the daily lesson. Extensions are also available to stretch students’ understanding.

Multilingual Learners

To support multilingual/English learners, Amplify Desmos Math incorporates research-based Math Language Routines (MLRs) by providing language modality strategies like sentence frames where appropriate, both in the teacher language provided for each task and in the differentiation support section found throughout the program. For further information on math language development, please see pg. 82 of the Amplify Desmos Math Program Guide.

A male teacher in a red shirt explaining a lesson to a focused young female student in a classroom. other students are in the background.

Review Resources

To support your review of Amplify Desmos Math here are links to important K-5 review resources:

Two women in an office setting are smiling while looking at a tablet. Various educational icons surround the image.

K-5 sample materials

Click the links in the drop-down sections below to explore sample materials from each grade.  To see sample student responses, please click on the Teacher Edition pages and scroll to “Sample Student Work” (first one is about 30 pages in) or click on Intervention and Extension resources.   

For helpful navigation tips and more program information, download the Amplify Desmos Math Program Guide.

You can also watch a product expert walk through a lesson and the available program components.

Digital educational material showing an activity named "Hamster Homes" involving tube length and platform heights for a hamster cage. Includes a diagram with platforms measuring 9 inches.
Screenshot of a kindergarten curriculum outline featuring units like Math in Our World, Numbers 1-10, Positions and Shapes, Understanding Addition, Making 10, and Shapes All Around Us. This comprehensive program utilizes New York Math standards to build foundational skills.
Program structure

Get to know the content and structure of Kindergarten Amplify Desmos Math.

Cover of Amplify Desmos Math Grade K Teacher Edition featuring three children playing with math-related objects and a group of rabbits sitting nearby, aligning with the engaging curriculum seen in New York math classrooms.
Teacher Edition pages

Planning and instructional guidance is visual, organized, and easy-to-follow. To help you review the program, we have included samples from a complete sub-unit on this site: Unit 2, Sub-Unit 1: Counting and Comparing Objects.

Educational activity screen displaying a blue backpack with icons, dot groups on the left, and a grid background. Prompt reads, "Look inside the backpack. Then choose the group with the same number of dots." A great tool to amplify Desmos math learning in line with New York math standards.
Digital experience

Explore our digital experience! Every lesson in Amplify Desmos Math has student print materials and digital recommendations.

Cover of "Amplify Desmos Math: Student Edition Kindergarten," featuring an illustration of three children playing with math-related toys. A group of small white animals, possibly hamsters, play nearby. The scene brilliantly captures the joy of New York math exploration for young learners.
Student Edition pages

Motivate students with mathematics that is both rigorous and delightful.

Cover of "Amplify Desmos Math Grade K Centers Resources" featuring a large, stylized red and pink "C" on a light pink background with simple geometric designs. This distinctive cover complements New York math curriculums with its engaging visual elements.
Centers Resources

Engaging, hands-on games for students to play collaboratively to strengthen their understanding of key skills and concepts.

Cover of "Amplify Desmos Math: Grade K." The title is displayed with a geometric "I" illustration in the center. Subtitle reads "Intervention and Extension Resources" on a pink and white background, ideal for New York math standards.
Intervention and Extension Resources

Additional resources to reinforce and extend key concepts, including Mini-Lessons and Extensions.

A digital activity screen, crafted in the style of Amplify Desmos Math, shows two paths with different quantities of mushrooms. The user is prompted to choose the path with more mushrooms. A bear is on the left side of the screen.

In this lesson, students apply their understanding of how to compare groups of images as they determine which group has more or fewer and then compare their strategies by guiding a bear through a path that has more mushrooms than the other.

Grade 1 math curriculum overview displaying six units with instructional and assessment days: counting, addition, subtraction, numbers to 10, comparing numbers, measuring length, and geometry—aligned with the New York Math standards.
Program structure

Get to know the content and structure of Grade 1 Amplify Desmos Math.

Children interact with math activities on a large tablet while observing fish illustrations. The text reads "Amplify Desmos Math Grade 1 Teacher Edition, aligned with New York Math standards.
Teacher Edition pages

Planning and instructional guidance is visual, organized, and easy-to-follow. To help you review the program, we have included samples from a complete sub-unit on this site: Unit 2, Sub-Unit 1: Story Problems in Maui.

A digital math exercise, amplified by Desmos Math, showcases a story problem about adding kalo plants with three illustrations and a filled-out number sentence 3 + 4 = 7. A "Check" button is present. This tool aligns perfectly with New York math standards.
Digital experience

Explore our digital experience! Every lesson in Amplify Desmos Math has student print materials and digital recommendations.

Illustration of three children engaged in math activities from the "Amplify Desmos Math: Student Edition 1" textbook. One child holds a number card, while the others manipulate counters and images, experiencing an exciting approach inspired by New York math techniques.
Student Edition pages

Motivate students with mathematics that is both rigorous and delightful.

Cover of "Amplify Desmos Math Centers Resources" for Grade 1, featuring a yellow and white 3D letter "C" on a light background.
Centers Resources

Engaging, hands-on games for students to play collaboratively to strengthen their understanding of key skills and concepts.

Cover of "Amplify Desmos Math, Grade 1: Intervention and Extension Resources" depicting a large, blocky number one and a yellow-themed design. Ideal for enhancing New York math curriculum.
Intervention and Extension Resources

Additional resources to reinforce and extend key concepts, including Mini-Lessons and Extensions.

An educational game screen, inspired by New York math standards, shows a subtraction problem, "4 - 1," with a frog moving along numbered lily pads to reveal the answer "3.

In this lesson, students find differences when subtracting 1 and 2 from the same number by helping a frog reach a lily pad where it can eat a bug.

A curriculum overview for Grade 2 in New York Math displaying 8 units, including topics like comparisons, addition, subtraction, and geometric shapes, with details on the number of instructional and assessment days. This plan integrates resources from Amplify Desmos Math to enrich learning experiences.
Program structure

Get to know the content and structure of Grade 2 Amplify Desmos Math.

Cover of the "Amplify Desmos Math" Grade 2 Teacher Edition, showcasing children measuring with rulers and a poster displaying a mathematical equation, set against whimsical scenery with a colorful dragon. Perfect for New York math classrooms.
Teacher Edition pages

Planning and instructional guidance is visual, organized, and easy-to-follow. To help you review the program, we have included samples from a complete sub-unit on this site: Unit 2, Sub-Unit 1: Adding and Subtracting.

Activity screen displaying a task to estimate the number of animals in an aquarium, featuring a bar chart for goldfish, frogs, and shrimp. Utilizing Desmos math tools, an illustration of an aquarium with various animals is also included to amplify learning.
Digital experience

Explore our digital experience! Every lesson in Amplify Desmos Math has student print materials and digital recommendations.

Cover of "Amplify Desmos Math Student Edition 2" showing three children performing a New York math activity with blocks and measurements.
Student Edition pages

Motivate students with mathematics that is both rigorous and delightful.

Cover of an educational book titled "Amplify Desmos Math Grade 2 Centers Resources" featuring a green "C" on a light green background, perfect for enhancing New York math education.
Centers Resources

Engaging, hands-on games for students to play collaboratively to strengthen their understanding of key skills and concepts.

Cover of "Amplify Desmos Math Grade 2: Intervention and Extension Resources" featuring a green numeral 1 on a light green background, aligning with the New York math standards.
Intervention and Extension Resources

Additional resources to reinforce and extend key concepts, including Mini-Lessons and Extensions.

An educational activity where users must select the block with the correct number to make a total of 10 using the given block numbers. The UI, inspired by New York math standards, features a caterpillar and two tree stumps to amplify engagement with Desmos Math tools.

Students continue to develop fluency by finding the number that makes 10 by helping a millipede reach its favorite food – a clump of leaves!

An educational curriculum outline for Grade 3 with seven units covering various mathematics topics, including multiplication, shapes, fractions, and measurement. Suggested instructional days are provided. The New York Math approach ensures a thorough understanding of each concept.
Program structure

Get to know the content and structure of Grade 3 Amplify Desmos Math.

Cover of a "Grade 3 Amplify Desmos Math Teacher Edition" book, featuring a cutaway building with diverse students and a teacher working on New York math problems and organizing materials.
Teacher Edition pages

Planning and instructional guidance is visual, organized, and easy-to-follow. To help you review the program, we have included samples from a complete sub-unit on this site: Unit 2, Sub-Unit 1: Concepts of Area Measurement.

Educational software displays a challenge to determine the area of an unpainted wall. The wall features a door and window with given dimensions, and a mouse pointer hovers near the question, amplifying the student's engagement.
Digital experience

Explore our digital experience! Every lesson in Amplify Desmos Math has student print materials and digital recommendations.

Cover of "Amplify Desmos Math Student Edition 3" showcasing illustrated children engaged in various mathematical activities inside a glass house structure, reflecting the dynamic energy of New York math.
Student Edition pages

Motivate students with mathematics that is both rigorous and delightful.

Cover of the Amplify Desmos Math Grade 3 Centers Resources book, featuring a 3D letter "C" in blue and white on a minimalistic background, perfect for aligning with New York math standards.
Centers Resources

Engaging, hands-on games for students to play collaboratively to strengthen their understanding of key skills and concepts.

Cover of an "Amplify Cover of the "Amplify Desmos Math" Grade 3 book featuring intervention and extension resources, with a blue geometric "I" on a light blue background, aligning with New York Math standards.
Intervention and Extension Resources

Additional resources to reinforce and extend key concepts, including Mini-Lessons and Extensions.

A page titled "Activity 2" features a table showing counts of rabbits, raccoons, and foxes, an image of animal stickers, and a bar graph representing the number of each animal, designed to amplify your New York math lesson with engaging visual data.

Students compare data represented on bar graphs with different scales by using animal stickers to create scaled bar graphs.

A course outline for Algebra 1 with 8 units, each detailing the number of instructional and optional days. The total suggested instructional days are 144 and 28 optional days, aligning with New York Math standards.
Program structure

Get to know the content and structure of Grade 4 Amplify Desmos Math.

Cover of "Amplify Desmos Math: Teacher Edition Grade 4" showing children learning New York Math outdoors, using large mathematical tools and numbers, with one child in a wheelchair.
Teacher Edition pages

Planning and instructional guidance is visual, organized, and easy-to-follow. To help you review the program, we have included samples from a complete sub-unit on this site: Unit 2, Sub-Unit 1: Size and Location of Fractions.

Educational screen showing an interactive activity from Amplify Desmos Math where a user drags a point to cut a log into quarters. The progress is 2 out of 10.
Digital experience

Explore our digital experience! Every lesson in Amplify Desmos Math has student print materials and digital recommendations.

Cover of "Amplify Desmos Math, Student Edition, Grade 4," showcasing students collaborating on math problems involving shapes and numbers against a vibrant backdrop that blends cityscapes and natural scenery, capturing the essence of New York math learning.
Student Edition pages

Motivate students with mathematics that is both rigorous and delightful.

Cover of the "Amplify Desmos Math" Grade 4 Centers Resources book, featuring a large, stylized blue letter "C" on a light blue background. This essential resource for New York math educators ensures engaging and effective instruction.
Centers Resources

Engaging, hands-on games for students to play collaboratively to strengthen their understanding of key skills and concepts.

Cover of "Amplify Desmos Math, Grade 4: Intervention and Extension Resources," featuring a geometric illustration and a blue and orange color scheme inspired by New York math standards.
Intervention and Extension Resources

Additional resources to reinforce and extend key concepts, including Mini-Lessons and Extensions.

Interactive educational activity asking users to determine platform heights using a 3-inch tube. The interface, inspired by Desmos math tools, features a dragging function and feedback system with a checkbox and "Try another" option, amplifying the learning experience.

Students choose tube lengths to connect to platform heights for hamster homes, identifying possible heights using what they know about multiples.

A Grade 5 curriculum scope and sequence chart with units covering volume, fractions, multiplication, shapes, place value, and measurement. Each unit lists instructional and assessment days to amplify Desmos Math activities.
Program structure

Get to know the content and structure of Grade 5 Amplify Desmos Math.

Illustration of three students engaging with various math activities outdoors and around large blocks. Text at the top reads "Amplify Desmos Math, Grade 5, Teacher Edition" - a perfect resource for New York math educators.
Teacher Edition pages

Planning and instructional guidance is visual, organized, and easy-to-follow. To help you review the program, we have included samples from a complete sub-unit on this site: Unit 2, Sub-Unit 1: Fractions as Quotients.

A digital activity prompt showing a scenic landscape with bamboo shoots and a panda. Using Desmos math tools, the task is to estimate the length where the third bamboo shoot should be placed for the panda to reach a leaf. This exercise is designed to amplify your understanding of spatial reasoning.
Digital experience

Explore our digital experience! Every lesson in Amplify Desmos Math has student print materials and digital recommendations.

Cover of "Amplify Desmos Math: Student Edition, Grade 5" featuring students engaged in various mathematical activities outside, such as block building, measuring, and gardening—a perfect resource aligning with New York math standards.
Student Edition pages

Motivate students with mathematics that is both rigorous and delightful.

Cover image of "Amplify Desmos Math Grade 5 Centers Resources" featuring a large purple letter C on a light purple background, showcasing the innovative approach of Amplify Desmos Math that's making waves in New York math education.
Centers Resources

Engaging, hands-on games for students to play collaboratively to strengthen their understanding of key skills and concepts.

Cover of "Amplify Desmos Math Grade 5: Intervention and Extension Resources," featuring a large, stylized number five in purple against a light purple background with minimal geometric patterns, ideal for New York math curriculum support.
Intervention and Extension Resources

Additional resources to reinforce and extend key concepts, including Mini-Lessons and Extensions.

An interactive screen showing an activity about decomposing a figure into prisms, with a touch of Desmos Math integration. The user is asked to drag points to demonstrate the decomposition. Two prism illustrations are displayed, offering a glimpse of New York Math's approach.

Students decompose a figure into rectangular prisms and determine the volume of the figure by adding the volumes of the individual prisms.

Contact Us

If you have any questions throughout your review process or need additional samples, please don’t hesitate to contact:

Alicia O’Neil

Account Executive

425-890-6103

aoneil@amplify.com

Request additional samples

Ready to learn more? Connect with an Amplify Desmos Math expert to request additional program samples.

enVision-NEW

To view this protected page, enter the password below:


Grade 6

Chapter 1: Use Positive Rational Numbers

enVision MathDesmos Classroom
Lesson 1: Fluently Add, Subtract, and Multiply DecimalsUnit 5
Lesson 1: Dishing Out Decimals
Lesson 2: Decimal Diagrams and Algorithms
Lesson 2: Fluently Divide Whole Numbers and DecimalsUnit 5
Lesson 13: Movie Time
Lesson 4: Understand Division with FractionsUnit 4
Lesson 13: Movie Time
Lesson 6: Divide Mixed NumbersUnit 4
Lesson 6 Fill the Gap
Lesson 7: Solve Problems with Rational NumbersUnit 4
Lesson 3: Flour Planner

Chapter 2: Integers and Rational Numbers

Lesson 1: Understand IntegersUnit 7
Lesson 1: Can You Dig It?
Lesson 2: Represent Rational Numbers on the Number LineUnit 7
Lesson 4: Order in the Class

Chapter 3: Numeric and Algebraic Expressions

Lesson 4: Write Algebraic ExpressionsUnit 6
Lesson 8: Products and SumsTake Away (coming soon!)
Lesson 6: Generate Equivalent Expressions Unit 6
Lesson 8: Products and SumsTake Away (coming soon!)

Chapter 4: Represent and Solve Equations and Inequalities

Lesson 1: Understand Equations and SolutionsUnit 6
Lesson 1: Weight for It
Lesson 6: Understand and Write InequalitiesUnit 7
Lesson 7: Tunnel Travels
Lesson 9: Use Patterns to Write and Solve Equations
Lesson 10: Relate Tables, Graphs, and Equations
Unit 6
Lesson 16: Subway FaresTake Away (coming soon!)

Chapter 5: Understand and Use Ratio and Rate

Lesson 1: Understand RatiosUnit 2
Lesson 1: Pizza Maker
Lesson 2: Generate Equivalent RatiosUnit 2
Lesson 4: Fruit Lab
Lesson 4: Represent and Graph RatiosUnit 2
Lesson 10: Disaster Preparation
Lesson 5: Understand Rates and Unit RatesUnit 3
Lesson 6: Soft Serve
Lesson 6: Compare Unit RatesUnit 3
Lesson 6: Soft Serve

Chapter 6: Understand and Use Percent

Lesson 1: Understand PercentUnit 3
Lesson 9: Lucky Duckies

Chapter 7: Solve Area, Surface Area, and Volume Problems

Lesson 1: Find Areas of Parallelograms and RhombusesUnit 1
Lesson 3: Exploring Parallelograms, Part 1
Exploring Parallelograms, Part 2
Lesson 5: Represent Solid Figures Using NetsUnit 1
Lesson 10: Renata’s Stickers

Chapter 8: Display, Describe, and Summarize data

Lesson 2: Summarize data Using Mean, Median, and ModeUnit 8 
Lesson 11: Toy Cars
Lesson 4: Display Data in Frequency Tables and HistogramsUnit 8 
Lesson 5: The Plot Thickens
Lesson 7: Summarize Data DistributionsUnit 8 
Lesson 3: Minimum Wage

Grade 7

Chapter 1: Rational Number Operations

enVision MathDesmos Classroom
Lesson 1: Relate Integers and Their OppositesUnit 5
Lesson 1: Floats and Anchors
Lesson 3: Add Integers
Lesson 4: Subtract Integers
Unit 5
Lesson 4: Draw Your Own
Lesson 10: Integer Puzzles
Lesson 5: Add and Subtract Rational NumbersUnit 5
Lesson 4: Draw Your Own
Lesson 10: Integer Puzzles
Lesson 6: Multiply IntegersUnit 5
Lesson 10: Integer Puzzles
Lesson 7: Multiply Rational NumbersUnit 5
Lesson 10: Integer Puzzles
Lesson 9: Divide Rational NumbersUnit 5
Lesson 10: Integer Puzzles

Chapter 2: Analyze and Use Proportional Relationships

Lesson 3: Understand Proportional Relationships: Equivalent RatiosUnit 2
Lesson 1: Paint
Lesson 4: Describe Proportional Relationships: Constant of ProportionalityUnit 2
Lesson 6: Two and Two
Lesson 5: Graph Proportional RelationshipsUnit 2
Lesson 8: Dino Pops

Chapter 3: Analyze and Solve Percent Problems

Lesson 1: Analyze Percents of Numbers
Lesson 2: Connect Percent and Proportion
Unit 4
Lesson 1: Mosaics
Lesson 4: Solve Percent Change and Percent Error ProblemsUnit 4
Lesson 5: Percent Machines
Lesson 12: Posing Percent Problems (coming soon!)
Lesson 5: Solve Markup and Markdown ProblemsUnit 4
Lesson 5: Percent Machines
Lesson 12: Posing Percent Problems (coming soon!)

Chapter 4: Generate Equivalent Expressions

Lesson 3: Simplify ExpressionsUnit 6
Lesson 10: Collect the Squares
Lesson 4: Expand ExpressionsUnit 6
Lesson 10: Collect the Squares
Lesson 6: Add Expressions
Lesson 7: Subtract Expressions
Unit 6
Lesson 10: Collect the Squares

Chapter 5: Solve Problems Using Equations and Inequalities

Lesson 4: Solve Inequalities Using Addition or Subtraction
Lesson 5: Solve Inequalities Using Multiplication or Division
Unit 6
Lesson 16: Shira the Sheep
Lesson 6: Solve Two-Step Inequalities
Lesson 7: Solve Multi-Step Problems
Unit 6
Lesson 16: Shira the Sheep

Chapter 6: Use Sampling to Draw Inferences About Populations

Lesson 1: Populations and SamplesUnit 8
Lesson 10: Crab Island
Lesson 2: Draw Inferences from DataUnit 8 
Lesson 10: Crab Island
Lesson 3: Make Comparative Inferences About Populations
Lesson 4: Make More Comparative Inferences About Populations
Unit 8
Lesson 10: Crab Island

Chapter 7: Probability

Lesson 1: Understand Likelihood and ProbabilityUnit 8
Lesson 1: How Likely?
Lesson 2: Prob-bear-bilities

Chapter 8: Solve Problems Involving Geometry

Lesson 1: Solve Problems Involving Scale DrawingsUnit 1 Lesson 1: Scaling Machines Lesson 7: Will It Fit?
Lesson 3: Draw Triangles with Given ConditionsUnit 7
Lesson 5: Can You Build It?
Lesson 4: Solve Problems Using Angle RelationshipsUnit 7
Lesson 2: Friendly Angles
Lesson 4: Missing Measures
Lesson 5: Solve Problems Involving Circumference of a CircleUnit 7
Lesson 3: Measuring Around
Lesson 6: Solve Problems Involving Area of a CircleUnit 3
Lesson 9: Area Challenges

Grade 8

Chapter 1: Real Numbers

enVision MathDesmos Classroom
Lesson 4: Evaluate Square Roots and Cube RootsUnit 8
Lesson 4: Root Down
Lesson 6: Use Properties of Integer ExponentsUnit 7  
Lesson 3: Power Pairs
Lesson 9: Understand Scientific NotationUnit 7  
Lesson 9: Specific and Scientific
Lesson 11: Balance the Scale

Chapter 2: Analyze and Solve Linear Equations

Lesson 3: Solve Multi-Step EquationsUnit 4
Lesson 5: Equation Roundtable
Lesson 5: Compare Proportional RelationshipsUnit 3
Lesson 1: Turtle Time Trials
Lesson 6: Connect proportional Relationships and SlopeUnit 3
Lesson 4: Flags
Lesson 8: Understand the y-intercept of a LineUnit 3
Lesson 4: Flags

Chapter 3: Use Functions to Model Relationships

Lesson 1: Understand Relations and FunctionsUnit 5
Lesson 1: Turtle Crossing
Lesson 2: Guess My Rule
Lesson 2: Connect Representations of FunctionsUnit 5
Lesson 5: The Tortoise and the Hare
Lesson 5: Intervals of Increase and DecreaseUnit 5
Lesson 1: Turtle Crossing

Chapter 4: Investigate Bivariate Data

Lesson 1: Construct and Interpret Scatter PlotsUnit 6  
Lesson 3: Robots
Lesson 2: Analyze Linear AssociationUnit 6  
Lesson 4: Dapper Cats
Lesson 6: Find the Fit
Lesson 5: Interpret Two-Way Relative Frequency TablesUnit 6  
Lesson 11: Finding Associations

Chapter 5: Analyze and Solve Systems of Linear Equations

Lesson 2: Solve Systems by GraphingUnit 4  
Lesson 11: Make Them Balance
Lesson 12: Line Zapper

Chapter 6: Congruence and Similarity

Lesson 1: Analyze TranslationsUnit 1
Lesson 1: Transformers
Lesson 2: Spinning, Flipping, Sliding
Lesson 4: Moving Day
Lesson 2: Analyze Reflections
Lesson 3: Analyze Rotations
Unit 1
Lesson 1: Transformers
Lesson 2: Spinning, Flipping, Sliding
Lesson 4: Moving Day
Lesson 6: Describe DilationsUnit 2
Lesson 1: Sketchy Dilations
Lesson 2: Dilation Mini Golf
Lesson 7: Understand Similar FiguresUnit 2
Lesson 6: Social Scavenger Hunt
Lesson 9: Interior and Exterior Angles of TrianglesUnit 1
Lesson 12: Puzzling It Out

Chapter 7: Understand and Apply the Pythagorean Theorem

Lesson 1: Understand the Pythagorean TheoremUnit 8
Lesson 8: Triangle-Tracing Turtle
Lesson 3: Apply the Pythagorean Theorem to Solve ProblemsUnit 8
Lesson 10: Taco Truck

Chapter 8: Solve Problems Involving Surface Area and Volume

Lesson 2: Find Volume of CylindersUnit 5
Lesson 11: Cylinders
Lesson 3: Find Volume of ConesUnit 5
Lesson 13: Cones

Algebra 1

Topic 1: Solving Equations and Inequalities

Lesson 1-2: Solving Linear EquationsWorking Backwards
Lesson 1-3: Solving Equations with Variables on Both SidesSolving Strategies
Same Position
Lesson 1-4: Literal Equations and FormulasSubway Seats
Various Variables
Lesson 1-5: Solving Inequalities in One VariablePizza Delivery

Topic 2: Linear Functions

Lessons 2-1 to 2-3 Forms of Linear EquationsSubway Seats
Five Representations

Topic 3: Linear Functions

Topic 4: Systems of Linear Equations and Inequalities

Lesson 4-1: Solving Systems of Equations by GraphingLizard Lines
Lesson 4-2: Solving Systems of Equations by SubstitutionShape It Up
Lesson 4-5: Systems of Linear InequalitiesQuilts
Seeking Solutions

Topic 5: Piecewise Functions

Lesson 5-2: Piecewise-Defined FunctionsPumpkin Prices

Topic 6: Exponents and Exponential Functions

Lesson 6-2: Exponential FunctionsCarlos’s Fish
Revisiting Visual Patterns, Part 1
Lesson 6-4: Geometric SequencesSequence Carnival
More Visual Patterns

Topic 8: Quadratic Functions

Lesson 8-1: Key Features of a Quadratic FunctionQuadratic Visual Patterns
Lesson 8-2: Quadratic Functions in Vertex FormOn the Fence
Plenty of Parabolas
Lesson 8-5: Linear, Exponential and Quadratic ModelsDetroit’s Population, Part 1
Detroit’s Population, Part 2
Sorting Relationships
Lesson 8-3: Quadratic Functions in Standard FormRobot Launch
Lesson 8-4: Modeling with Quadratic FunctionsStomp Rockets

Topic 9: Solving Quadratic Equations

Lesson 9-2: Solving Quadratic Equations by FactoringTwo for One
Parabola Zapper
Shooting Stars
Lesson 9-5: Completing the SquareSquare Tactic
Lesson 9-6: The Quadratic Formula and the DiscriminantStomp Rockets in Space

Topic 10: Working with Functions

Lesson 10-1: The Square Root functionPlane, Train, and Automobile
Lesson 10-3: Analyzing Functions GraphicallyCraft-a-Graph
Lesson 10-7: Inverse FunctionsChip the Robot

Topic 11: Statistics

Lesson 11-4: Standard DeviationFinding Desmo

Disclaimer

This document is for informational purposes only; references to third-party programs do not imply endorsement or affiliation, and all trademarks are the property of their respective owners.

Phonological awareness games

In Cut It Out, students isolate individual phonemes by listening to a beginning, middle, or ending sound and choosing a picture of the word containing the sound in that position.

Skills
Phonological awareness

  • Blending at the compound word, syllable, onset-rime, and phoneme level

Standards covered

  • CCSS.ELA-LITERACY.RF.1.2.C — Isolate and pronounce initial, medial vowel, and final sounds (phonemes) in spoken single-syllable words.
  • CCSS.ELA-LITERACY.RF.K.2.D — Isolate and pronounce the initial, medial vowel, and final sounds (phonemes) in three-phoneme (consonant-vowel-consonant, or CVC) words.1 (This does not include CVCs ending with /l/, /r/, or /x/.)

In Gem & Nye, students blend sounds into words, starting with compound words and syllables and then moving to beginning (onset) and ending (rime) sounds and finally individual phonemes, to identify the picture of the word the Soundbots say when blended together.

Skills
Phonological awareness

  • Blending at the compound word, syllable, onset-rime, and phoneme level

Standards covered

  • CCSS.ELA-LITERACY.RF.1.2.B — Orally produce single-syllable words by blending sounds (phonemes), including consonant blends.
  • CCSS.ELA-LITERACY.RF.K.2.B — Count, pronounce, blend, and segment syllables in spoken words.
  • CCSS.ELA-LITERACY.RF.K.2.C — Blend and segment onsets and rimes of single-syllable spoken words.

In Wordbots, students practice segmenting words into their onsets and rimes to determine which Startbots and Endbots form a stimulus word.

Skills
Phonological awareness

  • Segment at the compound-word and onset-rime level

Standards covered

  • CCSS.ELA-LITERACY.RF.K.2.C — Blend and segment onsets and rimes of single-syllable spoken words.
  • CCSS.ELA-LITERACY.RF.K.2.B — Count, pronounce, blend, and segment syllables in spoken words.

In Zoom Boom, students practice rhyming by listening to a word and identifying the picture of the word that rhymes with it.

Skills
Phonological awareness

  • Rhyming

Standards covered

  • CCSS.ELA-LITERACY.RF.K.2.A — Recognize and produce rhyming words.

Phonics Games in Amplify Reading: K–2

In Curioso Crossing, students practice accurate and automatic word recognition by identifying the correct spoken word to guide their Curioso safely throughout the land.

Skills
Phonics – Early Decoding; Advanced Decoding

  • Read high-frequency irregular words, regular words, words with inflected endings, two-syllable words, words with prefixes and suffixes, and multi-syllable words

Standards Covered

  • CCSS.ELA-LITERACY.RF.K.3.B — Associate the long and short sounds with the common spellings (graphemes) for the five major vowels.
  • CCSS.ELA-LITERACY.RF.1.3.B — Decode regularly spelled one-syllable words.
  • CCSS.ELA-LITERACY.RF.1.3.C — Know final -e and common vowel team conventions for representing long vowel sounds.
  • CCSS.ELA-LITERACY.RF.1.3.E — Decode two-syllable words following basic patterns by breaking the words into syllables.
  • CCSS.ELA-LITERACY.RF.1.3.F — Read words with inflectional endings.
  • CCSS.ELA-LITERACY.RF.2.3.A — Distinguish long and short vowels when reading regularly spelled one-syllable words.
  • CCSS.ELA-LITERACY.RF.2.3.C — Decode regularly spelled two-syllable words with long vowels.
  • CCSS.ELA-LITERACY.RF.2.3.D — Decode words with common prefixes and suffixes.
  • CCSS.ELA-LITERACY.RF.2.3.F — Recognize and read grade-appropriate irregularly spelled words.
  • CCSS.ELA-LITERACY.RF.K.3.C — Read common high-frequency words by sight (e.g., the, of, to, you, she, my, is, are, do, does).
  • CCSS.ELA-LITERACY.RF.1.3.G — Recognize and read grade-appropriate irregularly spelled words.

In Food Truck, students practice “chopping” blends, ending sounds (rimes), and whole words into beginning sounds (onsets), ending sounds, and individual letters to create orders for their hungry goblin customers. The difficulty of words and segmenting tasks increases with each level as customers order more sophisticated “dishes.”

Skills
Phonics – Early Decoding

  • Decode and spell words with common rime families

Standards Covered

  • CCSS.ELA-LITERACY.RF.K.3.A — Demonstrate basic knowledge of one-to-one letter-sound correspondences by producing the primary sound or many of the most frequent sounds for each consonant.
  • CCSS.ELA-LITERACY.RF.K.3.B — Associate the long and short sounds with the common spellings (graphemes) for the five major vowels.
  • CCSS.ELA-LITERACY.RF.K.3.D — Distinguish between similarly spelled words by identifying the sounds of the letters that differ.
  • CCSS.ELA-LITERACY.RF.K.2.E — Add or substitute individual sounds (phonemes) in simple, one-syllable words to make new words.
  • CCSS.ELA-LITERACY.RF.1.3.B — Decode regularly spelled one-syllable words.

In Grumpy Goblins, students learn sound-spelling correspondences for consonant digraphs and vowel teams by listening to a sound from a goblin and feeding it the piece of toast with the corresponding letter or combination.

Skills
Phonics – Letter Combinations

  • Sound-spelling correspondences for consonant digraphs and vowel teams

Standards Covered

  • CCSS.ELA-LITERACY.RF.K.3.B — Associate the long and short sounds with the common spellings (graphemes) for the five major vowels.
  • CCSS.ELA-LITERACY.RF.1.3.A — Know the spelling-sound correspondences for common consonant digraphs.
  • CCSS.ELA-LITERACY.RF.2.3.B — Know spelling-sound correspondences for additional common vowel teams.

In Hangry Goblins, students practice letter-sound combinations by feeding individual letter sounds, consonant digraphs, blends, and vowel teams to goblins that become more and more “hangry” until they are given the letters that match their demands.

Skills
Phonics – Letter Sound Correspondence

  • Sound-spelling correspondences for individual letters and letter combinations

Standards covered

  • CCSS.ELA-LITERACY.RF.K.3.A — Demonstrate basic knowledge of one-to-one letter-sound correspondences by producing the primary sound or many of the most frequent sounds for each consonant.
  • CCSS.ELA-LITERACY.RF.K.3.B — Associate the long and short sounds with the common spellings (graphemes) for the five major vowels.
  • CCSS.ELA-LITERACY.RF.1.3.A — Know the spelling-sound correspondences for common consonant digraphs.
  • CCSS.ELA-LITERACY.RF.2.3.B — Know spelling-sound correspondences for additional common vowel teams.

In Picky Goblins, students practice sound-spelling correspondences for individual letters by listening to a sound from a goblin and feeding it the piece of toast with the corresponding.

Skills
Phonics – Letter-Sound Correspondence

  • Sound-Spelling Correspondences for single letters

Standards Covered

  • CCSS.ELA-LITERACY.RF.K.3.A — Demonstrate basic knowledge of one-to-one letter-sound correspondences by producing the primary sound or many of the most frequent sounds for each consonant.
  • CCSS.ELA-LITERACY.RF.K.3.B — Associate the long and short sounds with the common spellings (graphemes) for the five major vowels.

In Read All About It, students practice reading sentences with words that include the sound-spelling correspondences, word features (e.g., prefixes/suffixes), and phonics rules (e.g., vowel consonant long e, syllable patterns) they learned and practiced in other games.

Skills
Phonics – Early Decoding; Advanced Decoding

  • Read grade level text accurately

Standards Covered

  • CCSS.ELA-LITERACY.RF.K.3 — Know and apply grade-level phonics and word analysis skills in decoding words.
  • CCSS.ELA-LITERACY.RF.K.4 — Read emergent-reader texts with purpose and understanding.
  • CCSS.ELA-LITERACY.RF.1.3 — Know and apply grade-level phonics and word analysis skills in decoding words.
  • CCSS.ELA-LITERACY.RF.1.4 — Read with sufficient accuracy and fluency to support comprehension.
  • CCSS.ELA-LITERACY.RF.2.3 — Know and apply grade-level phonics and word analysis skills in decoding words.
  • CCSS.ELA-LITERACY.RF.2.4 — Read with sufficient accuracy and fluency to support comprehension.

In Rhyme Time, students practice with different rime families (words that end with the same sounds and rhyme) and decode words in these families by swapping the first letter sounds of words while the ending sounds remain constant.

Skills
Phonics – Early Decoding

  • Decode words with common rime families

Standards Covered

  • CCSS.ELA-LITERACY.RF.K.3.A — Demonstrate basic knowledge of one-to-one letter-sound correspondences by producing the primary sound or many of the most frequent sounds for each consonant.
  • CCSS.ELA-LITERACY.RF.K.3.B — Associate the long and short sounds with the common spellings (graphemes) for the five major vowels.
  • CCSS.ELA-LITERACY.RF.K.3.D — Distinguish between similarly spelled words by identifying the sounds of the letters that differ.
  • CCSS.ELA-LITERACY.RF.K.2.E — Add or substitute individual sounds (phonemes) in simple, one-syllable words to make new words.
  • CCSS.ELA-LITERACY.RF.1.3.B — Decode regularly spelled one-syllable words.

In Tongue Twist, students practice with different rime families (words that end with the same sounds and rhyme) and build words by changing the ending sound (rime) while the beginning (onset) sounds, consonant blends, and consonant digraphs remain constant.

Skills
Phonics – Early Decoding

  • Decode words with common rime families

Standards covered

  • CCSS.ELA-LITERACY.RF.K.3.A — Demonstrate basic knowledge of one-to-one letter-sound correspondences by producing the primary sound or many of the most frequent sounds for each consonant.
  • CCSS.ELA-LITERACY.RF.K.3.B — Associate the long and short sounds with the common spellings (graphemes) for the five major vowels.
  • CCSS.ELA-LITERACY.RF.K.3.D — Distinguish between similarly spelled words by identifying the sounds of the letters that differ.
  • CCSS.ELA-LITERACY.RF.K.2.E — Add or substitute individual sounds (phonemes) in simple, one-syllable words to make new words.
  • CCSS.ELA-LITERACY.RF.1.3.B — Decode regularly spelled one-syllable words.

In Word City, students identify and manipulate beginning, middle, and ending letter sounds to assemble word chains that form buildings.

Skills
Phonics – Early Decoding

  • Letter-sound correspondence
  • Decoding and spelling regular words

Standards Covered

  • CCSS.ELA-LITERACYRF.K.3.A — Demonstrate basic knowledge of one-to-one letter-sound correspondences by producing the primary sound or many of the most frequent sounds for each consonant.
  • CCSS.ELA-LITERACYRF.1.3.A — Know the spelling-sound correspondences for common consonant digraphs.
  • CCSS.ELA-LITERACYRF.1.3.B — Decode regularly spelled one-syllable words.
  • CCSS.ELA-LITERACYRF.1.3.C — Know final -e and common vowel team conventions for representing long vowel sounds.
  • CCSS.ELA-LITERACYRF.2.3.B — Know spelling-sound correspondences for additional common vowel teams.

Microcomprehension Games in Amplify Reading: K–2

In Because This, That, students learn how common text structures give clues to meaning by rearranging sentences to identify cause and effect or problem and solution.

Skills
Microcomprehension

  • Text Structure: Organize sentences using sequence/chronological order

Standards covered

  • CCSS.ELA-LITERACY.RI.1.3 — Describe the connection between two individuals, events, ideas, or pieces of information in a text.
  • CCSS.ELA-LITERACY.RI.1.8 — Identify the reasons an author gives to support points in a text.
  • CCSS.ELA-LITERACY.RI.2.3 — Describe the connection between a series of historical events, scientific ideas or concepts, or steps in technical procedures in a text.
  • CCSS.ELA-LITERACY.RI.2.8 — Describe how reasons support specific points the author makes in a text.

In Connect It!, students practice using different types of conjunctions (temporal and causal, for example) to combine two clauses into a coherent sentence.

Skills
Microcomprehension

  • Syntactic awareness – connectives

Standards covered

  • CCSS.ELA-LITERACY.L.2.3 — Use knowledge of language and its conventions when writing, speaking, reading, or listening.

In Message in a Bottle, students build their awareness of syntax and the impact word order has on meaning by unscrambling scraps of lost messages to reconstruct sentences.

Skills
Microcomprehension

  • Syntactic awareness

Standards covered

  • CCSS.ELA-LITERACY.L.1.1 — Demonstrate command of the conventions of standard English grammar and usage when writing or speaking.
  • CCSS.ELA-LITERACY.L.2.1 — Demonstrate command of the conventions of standard English grammar and usage when writing or speaking.

In Mind the Gap, comprehension levels are assessed through a modified cloze exercise in which students make selections to fill in the blanks of a text where approximately every seventh word has been omitted.

Skills
Microcomprehension

  • Reading fluency
  • Syntactic awareness
  • Inference
  • Comprehension monitoring

Standards covered

  • CCSS.ELA-LITERACY.CCRA.R.1 — Read closely to determine what the text says explicitly and to make logical inferences from it; cite specific textual evidence when writing or speaking to support conclusions drawn from the text.
  • CCSS.ELA-LITERACY.CCRA.R.10 — Read and comprehend complex literary and informational texts independently and proficiently.

In Show Off, students learn how common text structures give clues to meaning, using cues from illustrations to rearrange sentences in the correct sequential or chronological order.
Skills
Microcomprehension

  • Text structure: Organize sentences using problem/solution and cause/effect

Standards covered

  • CCSS.ELA-LITERACY.RI.1.3 — Describe the connection between two individuals, events, ideas, or pieces of information in a text.
  • CCSS.ELA-LITERACY.RI.1.8 — Identify the reasons an author gives to support points in a text.
  • CCSS.ELA-LITERACY.RI.2.3 — Describe the connection between a series of historical events, scientific ideas or concepts, or steps in technical procedures in a text.
  • CCSS.ELA-LITERACY.RI.2.8 — Describe how reasons support specific points the author makes in a text.knowledge of one-to-one letter-sound correspondences by producing the primary sound or many of the most frequent sounds for each consonant.

In Sloppy Scrolls, students practice the art of comprehension monitoring, or ensuring that they continually build and check a mental model of what they read. In the game, students are introduced to a world of enchanted scrolls that have lost their magic: they contain inconsistencies, and no longer make sense. The students must attempt to identify the inconsistencies by tapping the sentences that don’t match the rest of the passage. To increase the challenge of the game, some of the passages are presented without errors.

Skills
Microcomprehension

  • Comprehension Monitoring

Standards Covered

  • CCSS.ELA-LITERACY.RL.2.10 — By the end of the year, read and comprehend literature, including stories and poetry, in the grades 2-3 text complexity band proficiently, with scaffolding as needed at the high end of the range.

In Storyboard, students practice making inferences by completing a storyboard that integrates relevant background knowledge missing from a given sentence.

Skills
Microcomprehension

  • Inference

Standards covered

  • CCSS.ELA-LITERACY.RL.K.1 — With prompting and support, ask and answer questions about key details in a text.
  • CCSS.ELA-LITERACY.RI.K.1 — With prompting and support, ask and answer questions about key details in a text.
  • CCSS.ELA-LITERACY.RL.1.1 — Ask and answer questions about key details in a text.
  • CCSS.ELA-LITERACY.RI.1.1 — Ask and answer questions about key details in a text.

In Super Match, students work on developing cognitive flexibility, or the ability to track multiple elements simultaneously, by completing interactive puzzles that associate pictures and words across multiple dimensions (e.g., color and category, or starting sounds and category).

Skills
Microcomprehension

  • Cognitive flexibility

Standards covered

  • CCSS.ELA-LITERACY.L.1.5.A — Sort words into categories (e.g., colors, clothing) to gain a sense of the concepts the categories represent.
  • CCSS.ELA-LITERACY.L.1.5.B — Define words by category and by one or more key attributes (e.g., a duck is a bird that swims; a tiger is a large cat with stripes).
  • CCSS.ELA-LITERACY.RF.1.3 — Know and apply grade-level phonics and word analysis skills in decoding words.

In Unmask That, students build their understanding of anaphora, a tool authors use to avoid repetition, by linking pronouns to their antecedents in text.

Skills
Microcomprehension

  • Syntactic awareness – anaphora

Standards covered

  • CCSS.ELA-LITERACY.L.1.1 — Demonstrate command of the conventions of standard English grammar and usage when writing or speaking.
  • CCSS.ELA-LITERACY.L.2.1 — Demonstrate command of the conventions of standard English grammar and usage when writing or speaking.

Comprehension Games in Amplify Reading: K–2

In Best Buddy, students examine character traits to determine which school club provides the best fit for their fictional friends.

Skills
Comprehension – Key Ideas and Details

  • Character Traits

Standards Covered

  • CCSS.ELA-LITERACY.RL.1.3 — Describe characters, settings, and major events in a story, using key details.
  • CCSS.ELA-LITERACY.RL.2.3 — Describe how characters in a story respond to major events and challenges.

In Book Club, students compare and contrast two books on the same topic or theme to determine which book best meets the needs of a character in the game.

Skills
Comprehension – Integration of Knowledge and Ideas

  • Compare and Contrast Texts

Standards covered

  • CCSS.ELA-LITERACY.RI.1.9 — Identify basic similarities in and differences between two texts on the same topic (e.g., in illustrations, descriptions, or procedures).
  • CCSS.ELA-LITERACY.Rl.2.9 — Compare and contrast the most important points presented by two texts on the same topic.
  • CCSS.ELA-LITERACY.RL.2.9 — Compare and contrast two or more versions of the same story (e.g., Cinderella stories) by different authors or from different cultures.

In Debate-a-Ball, students practice identifying the best evidence to support a claim. Students pick an animal avatar to compete with an automated opponent in debates on familiar topics. To win, students must put forward the best evidence to support each claim more frequently than their opponents. They are taught to identify evidence that is factual and strongly related to the claim.

Skills
Comprehension – Integration of Knowledge and Ideas

  • Evaluate evidence

Standards covered

  • CSS.ELA-LITERACY.RI.2.8 — Describe how reasons support specific points the author makes in a text.

In Picture This, students complete the illustrations for a story by identifying words that describe its setting, characters, problems, and solutions.

Skills
Comprehension – Key Ideas and Details

  • Story Elements/Plot

Standards covered

  • CCSS.ELA-LITERACY.RL.1.1 — Ask and answer questions about key details in a text.
  • CCSS.ELA-LITERACY.RL.1.3 — Describe characters, settings, and major events in a story, using key details.
  • CCSS.ELA-LITERACY.RL.2.1 — Ask and answer such questions as who, what, where, when, why, and how to demonstrate understanding of key details in a text.
  • CCSS.ELA-LITERACY.RL.2.3 — Describe how characters in a story respond to major events and challenges.

In Storybox, students choose settings, situations, and solutions to send characters on different adventures, using details and context to help them resolve problems and complete the story.

Skills
Comprehension – Key Ideas and Details

  • Story Elements/Plot

Standards covered

  • CCSS.ELA-LITERACY.RL.K.3 — With prompting and support, identify characters, settings, and major events in a story.

In Tube Tales, students learn the attributes of different genres and practice identifying them in brief texts.

Skills
Comprehension – Craft and Structure

  • Text schema

Standards covered

  • CCSS.ELA-LITERACY.RL.2.10 — By the end of the year, read and comprehend literature, including stories and poetry, in the grades 2-3 text complexity band proficiently, with scaffolding as needed at the high end of the range.
  • CCSS.ELA-LITERACY.RI.2.5 — Know and use various text features (e.g., captions, bold print, subheadings, glossaries, indexes, electronic menus, icons) to locate key facts or information in a text efficiently.
  • CCSS.ELA-LITERACY.RI.2.10 — By the end of year, read and comprehend informational texts, including history/social studies, science, and technical texts, in the grades 2-3 text complexity band proficiently, with scaffolding as needed at the high end of the range.

In What’s the Big Idea, students examine pictures, picture sequences, and short passages to practice differentiating the main idea from story details.

Skills
Comprehension – Key Ideas and Details

  • Main idea

Standards covered

  • CCSS.ELA-LITERACY.RI.K.2 — With prompting and support, identify the main topic and retell key details of a text.
  • CCSS.ELA-LITERACY.RI.1.2 — Identify the main topic and retell key details of a text.
  • CCSS.ELA-LITERACY.RI.2.2 — Identify the main topic of a multiparagraph text as well as the focus of specific paragraphs within the text.

Vocabulary Games in Amplify Reading: K–2

In Punchline!, students learn how words can have multiple meanings by channeling their inner comedian to crack homonym-based jokes.

Skills
Vocabulary

  • Multiple-meaning words

Standards covered

  • CCSS.ELA-LITERACY.L.2.4.A — Use sentence-level context as a clue to the meaning of a word or phrase.

In Shades of Meaning, students differentiate the nuances in similar words — first by ordering them from weakest to strongest, largest to smallest, or least to greatest; then by putting them into sentences that further clarify their meaning.

Skills
Vocabulary

  • Shades of meaning

Standards covered

  • CCSS.ELA-LITERACY.L.1.5.D — Distinguish shades of meaning among verbs differing in manner (e.g., look, peek, glance, stare, glare, scowl) and adjectives differing in intensity (e.g., large, gigantic) by defining or choosing them or by acting out the meanings.
  • CCSS.ELA-LITERACY.L.2.5.B — Distinguish shades of meaning among closely related verbs (e.g., toss, throw, hurl) and closely related adjectives (e.g., thin, slender, skinny, scrawny).

Amplify Reading: K–2’s Integrated eReader

eReader Overview

Amplify Reading: K–2 has a new library of over 25 fiction and non-fiction ebooks and an adaptive algorithm that unlocks each book at the exact right point in a reader’s development. Moreover, they contain familiar interactions from the games so that students move seamlessly from text-embedded-in-games to games-embedded-in-text, maximizing their sense of growing competency.

The eReader also provides optional supports for its readers. From the settings icon on the title page of each book, students can turn on sentence numbering, read aloud functionality, and reveal words, as well as adjust the text size.

Student Experience
When students are ready for a text, it will appear as one of their quest steps.

When readers first unlock a new book, they read through it without interruption (with read-aloud support if appropriate).

In the second read, students discover embedded activities that repeat the familiar iconography of a game they previously mastered.

At the end of the book, additional activities evaluate students’ comprehension.

Achievements in books are part of the same overall reward system: helping your Curioso grow, just like achievement in skill-building games. Mastery of the content is reflected in the teacher dashboard within the given skill.

How teachers are using Amplify Reading

Independent study/rotation stations
Amplify Reading is a personalized, differentiated program designed to keep students engaged and on task in independent study. The program is most effective when used for a minimum of 45 minutes per week.

Other common uses
We designed the program to be flexible enough to fit any classroom model. Amplify Reading is browser-based, so it works on Chromebooks, iPads, laptops, desktops, and even iPhones. It can also be used at home to extend learning beyond the classroom.

Welcome, Ellensburg, to Amplify Desmos Math!

Amplify Desmos Math K-5 thoughtfully combines conceptual understanding, procedural fluency, and application. Each lesson is designed to tell a story by posing problems that invite a variety of approaches before guiding students to synthesize their understanding of the learning goals.

Scroll to learn more about the program and explore sample materials.

About the program

We believe in math that motivates. Our structured approach to problem-based learning builds on students’ curiosity to develop lasting grade-level understandings for all students. 

The program motivates students with interesting problems they are eager to solve. Teachers can spend more time where it’s most impactful: creating a collaborative classroom of learners.

A powerful suite of math resources

Amplify Desmos Math combines the best of problem-based lessons, intervention, personalized practice, and assessments into a coherent and engaging experience for both students and teachers.  Feel free to explore our grade-level ancillary samplers to learn more about assessment and reporting, intervention, and differentiation:

Grade K Ancillary Sampler

Grade 1 Ancillary Sampler

Grade 2 Ancillary Sampler

Grade 3 Ancillary Sampler

Grade 4 Ancillary Sampler

Grade 5 Ancillary Sampler

A laptop displays a math problem with illustrated students and a virtual keyboard. Behind it, a chart shows percentages for a Math 2 Beginning-of-Year Screener assessment.

Assessment

mCLASS® Assessments, along with daily formative checks, measure not only what students know, but how they think. The asset-based assessment system provides teachers with targeted, actionable insights, linked to core and intervention resources. Visit our mClass Math site to learn more.

Two side-by-side math activities for children: on the left, a caterpillar-themed block challenge, and on the right, a worksheet for finding pairs that sum to 10. These exercises are fantastic ways to amplify children's engagement with math concepts.

Core instruction

Amplify Desmos Math lessons pair problems students are eager to solve with clear instructional moves for teachers. With low-floor, high-ceiling tasks every student can actively participate and be a part of the math community. Unit- and lesson-level core assessments give teachers data at their fingertips to guide and differentiate instruction.

A math lesson screen shows a toy sinking 5 meters into a pool. A textbox asks how many centimeters that is, with space for an answer and a "Try again" button. An avatar explains the question, using Desmos math tools to amplify understanding.

Differentiation

Personalized Learning activities help students access grade-level math through engaging, independent digital practice. Responsive Feedback adjusts to students’ work, providing item-level adaptivity to further support their learning and offer personalized differentiation. Visit our Boost Math site to learn more. 

Two pages from a New York math textbook on determining coordinates after a rotation. Includes sections on modeled review, guided practice, and teacher's notes, with diagrams and examples that amplify the learning experience.

Embedded intervention

Integrated resources like Mini-Lessons, Fluency Practice, and Math Adventures provide targeted intervention on a specific concept or skill connected to the daily lesson. Extensions are also available to stretch students’ understanding.

Multilingual Learners

To support multilingual/English learners, Amplify Desmos Math incorporates research-based Math Language Routines (MLRs) by providing language modality strategies like sentence frames where appropriate, both in the teacher language provided for each task and in the differentiation support section found throughout the program. For further information on math language development, please see pg. 82 of the Amplify Desmos Math Program Guide.

Una profesora con un polo rojo ayuda a una estudiante con cabello largo y rizado que está leyendo un libro en su escritorio en un salón de clases. En la pared detrás de ellos se exhiben carteles con temas educativos.

Review Resources

To support your review of Amplify Desmos Math here are links to important K-5 review resources:

Two women in an office setting are smiling while looking at a tablet. Various educational icons surround the image.

K-5 sample materials

Click the links in the drop-down sections below to explore sample materials from each grade.  To see sample student responses, please click on the Teacher Edition pages and scroll to “Sample Student Work” (first one is about 30 pages in) or click on Intervention and Extension resources.   

For helpful navigation tips and more program information, download the Amplify Desmos Math Program Guide.

You can also watch a product expert walk through a lesson and the available program components.

Digital educational material showing an activity named "Hamster Homes" involving tube length and platform heights for a hamster cage. Includes a diagram with platforms measuring 9 inches.
Screenshot of a kindergarten curriculum outline featuring units like Math in Our World, Numbers 1-10, Positions and Shapes, Understanding Addition, Making 10, and Shapes All Around Us. This comprehensive program utilizes New York Math standards to build foundational skills.
Program structure

Get to know the content and structure of Kindergarten Amplify Desmos Math.

Cover of Amplify Desmos Math Grade K Teacher Edition featuring three children playing with math-related objects and a group of rabbits sitting nearby, aligning with the engaging curriculum seen in New York math classrooms.
Teacher Edition pages

Planning and instructional guidance is visual, organized, and easy-to-follow. To help you review the program, we have included samples from a complete sub-unit on this site: Unit 2, Sub-Unit 1: Counting and Comparing Objects.

Educational activity screen displaying a blue backpack with icons, dot groups on the left, and a grid background. Prompt reads, "Look inside the backpack. Then choose the group with the same number of dots." A great tool to amplify Desmos math learning in line with New York math standards.
Digital experience

Explore our digital experience! Every lesson in Amplify Desmos Math has student print materials and digital recommendations.

Cover of "Amplify Desmos Math: Student Edition Kindergarten," featuring an illustration of three children playing with math-related toys. A group of small white animals, possibly hamsters, play nearby. The scene brilliantly captures the joy of New York math exploration for young learners.
Student Edition pages

Motivate students with mathematics that is both rigorous and delightful.

Cover of "Amplify Desmos Math Grade K Centers Resources" featuring a large, stylized red and pink "C" on a light pink background with simple geometric designs. This distinctive cover complements New York math curriculums with its engaging visual elements.
Centers Resources

Engaging, hands-on games for students to play collaboratively to strengthen their understanding of key skills and concepts.

Cover of "Amplify Desmos Math: Grade K." The title is displayed with a geometric "I" illustration in the center. Subtitle reads "Intervention and Extension Resources" on a pink and white background, ideal for New York math standards.
Intervention and Extension Resources

Additional resources to reinforce and extend key concepts, including Mini-Lessons and Extensions.

A digital activity screen, crafted in the style of Amplify Desmos Math, shows two paths with different quantities of mushrooms. The user is prompted to choose the path with more mushrooms. A bear is on the left side of the screen.

In this lesson, students apply their understanding of how to compare groups of images as they determine which group has more or fewer and then compare their strategies by guiding a bear through a path that has more mushrooms than the other.

Grade 1 math curriculum overview displaying six units with instructional and assessment days: counting, addition, subtraction, numbers to 10, comparing numbers, measuring length, and geometry—aligned with the New York Math standards.
Program structure

Get to know the content and structure of Grade 1 Amplify Desmos Math.

Children interact with math activities on a large tablet while observing fish illustrations. The text reads "Amplify Desmos Math Grade 1 Teacher Edition, aligned with New York Math standards.
Teacher Edition pages

Planning and instructional guidance is visual, organized, and easy-to-follow. To help you review the program, we have included samples from a complete sub-unit on this site: Unit 2, Sub-Unit 1: Story Problems in Maui.

A digital math exercise, amplified by Desmos Math, showcases a story problem about adding kalo plants with three illustrations and a filled-out number sentence 3 + 4 = 7. A "Check" button is present. This tool aligns perfectly with New York math standards.
Digital experience

Explore our digital experience! Every lesson in Amplify Desmos Math has student print materials and digital recommendations.

Illustration of three children engaged in math activities from the "Amplify Desmos Math: Student Edition 1" textbook. One child holds a number card, while the others manipulate counters and images, experiencing an exciting approach inspired by New York math techniques.
Student Edition pages

Motivate students with mathematics that is both rigorous and delightful.

Cover of "Amplify Desmos Math Centers Resources" for Grade 1, featuring a yellow and white 3D letter "C" on a light background.
Centers Resources

Engaging, hands-on games for students to play collaboratively to strengthen their understanding of key skills and concepts.

Cover of "Amplify Desmos Math, Grade 1: Intervention and Extension Resources" depicting a large, blocky number one and a yellow-themed design. Ideal for enhancing New York math curriculum.
Intervention and Extension Resources

Additional resources to reinforce and extend key concepts, including Mini-Lessons and Extensions.

An educational game screen, inspired by New York math standards, shows a subtraction problem, "4 - 1," with a frog moving along numbered lily pads to reveal the answer "3.

In this lesson, students find differences when subtracting 1 and 2 from the same number by helping a frog reach a lily pad where it can eat a bug.

A curriculum overview for Grade 2 in New York Math displaying 8 units, including topics like comparisons, addition, subtraction, and geometric shapes, with details on the number of instructional and assessment days. This plan integrates resources from Amplify Desmos Math to enrich learning experiences.
Program structure

Get to know the content and structure of Grade 2 Amplify Desmos Math.

Cover of the "Amplify Desmos Math" Grade 2 Teacher Edition, showcasing children measuring with rulers and a poster displaying a mathematical equation, set against whimsical scenery with a colorful dragon. Perfect for New York math classrooms.
Teacher Edition pages

Planning and instructional guidance is visual, organized, and easy-to-follow. To help you review the program, we have included samples from a complete sub-unit on this site: Unit 2, Sub-Unit 1: Adding and Subtracting.

Activity screen displaying a task to estimate the number of animals in an aquarium, featuring a bar chart for goldfish, frogs, and shrimp. Utilizing Desmos math tools, an illustration of an aquarium with various animals is also included to amplify learning.
Digital experience

Explore our digital experience! Every lesson in Amplify Desmos Math has student print materials and digital recommendations.

Cover of "Amplify Desmos Math Student Edition 2" showing three children performing a New York math activity with blocks and measurements.
Student Edition pages

Motivate students with mathematics that is both rigorous and delightful.

Cover of an educational book titled "Amplify Desmos Math Grade 2 Centers Resources" featuring a green "C" on a light green background, perfect for enhancing New York math education.
Centers Resources

Engaging, hands-on games for students to play collaboratively to strengthen their understanding of key skills and concepts.

Cover of "Amplify Desmos Math Grade 2: Intervention and Extension Resources" featuring a green numeral 1 on a light green background, aligning with the New York math standards.
Intervention and Extension Resources

Additional resources to reinforce and extend key concepts, including Mini-Lessons and Extensions.

An educational activity where users must select the block with the correct number to make a total of 10 using the given block numbers. The UI, inspired by New York math standards, features a caterpillar and two tree stumps to amplify engagement with Desmos Math tools.

In this lesson, students find differences when subtracting 1 and 2 from the same number by helping a frog reach a lily pad where it can eat a bug.

An educational curriculum outline for Grade 3 with seven units covering various mathematics topics, including multiplication, shapes, fractions, and measurement. Suggested instructional days are provided. The New York Math approach ensures a thorough understanding of each concept.
Program structure

Get to know the content and structure of Grade 3 Amplify Desmos Math.

Cover of a "Grade 3 Amplify Desmos Math Teacher Edition" book, featuring a cutaway building with diverse students and a teacher working on New York math problems and organizing materials.
Teacher Edition pages

Planning and instructional guidance is visual, organized, and easy-to-follow. To help you review the program, we have included samples from a complete sub-unit on this site: Unit 2, Sub-Unit 1: Concepts of Area Measurement.

Educational software displays a challenge to determine the area of an unpainted wall. The wall features a door and window with given dimensions, and a mouse pointer hovers near the question, amplifying the student's engagement.
Digital experience

Explore our digital experience! Every lesson in Amplify Desmos Math has student print materials and digital recommendations.

Cover of "Amplify Desmos Math Student Edition 3" showcasing illustrated children engaged in various mathematical activities inside a glass house structure, reflecting the dynamic energy of New York math.
Student Edition pages

Motivate students with mathematics that is both rigorous and delightful.

Cover of the Amplify Desmos Math Grade 3 Centers Resources book, featuring a 3D letter "C" in blue and white on a minimalistic background, perfect for aligning with New York math standards.
Centers Resources

Engaging, hands-on games for students to play collaboratively to strengthen their understanding of key skills and concepts.

Cover of an "Amplify Cover of the "Amplify Desmos Math" Grade 3 book featuring intervention and extension resources, with a blue geometric "I" on a light blue background, aligning with New York Math standards.
Intervention and Extension Resources

Additional resources to reinforce and extend key concepts, including Mini-Lessons and Extensions.

A page titled "Activity 2" features a table showing counts of rabbits, raccoons, and foxes, an image of animal stickers, and a bar graph representing the number of each animal, designed to amplify your New York math lesson with engaging visual data.

Students compare data represented on bar graphs with different scales by using animal stickers to create scaled bar graphs.

A course outline for Algebra 1 with 8 units, each detailing the number of instructional and optional days. The total suggested instructional days are 144 and 28 optional days, aligning with New York Math standards.
Program structure

Get to know the content and structure of Grade 4 Amplify Desmos Math.

Cover of "Amplify Desmos Math: Teacher Edition Grade 4" showing children learning New York Math outdoors, using large mathematical tools and numbers, with one child in a wheelchair.
Teacher Edition pages

Planning and instructional guidance is visual, organized, and easy-to-follow. To help you review the program, we have included samples from a complete sub-unit on this site: Unit 2, Sub-Unit 1: Size and Location of Fractions.

Educational screen showing an interactive activity from Amplify Desmos Math where a user drags a point to cut a log into quarters. The progress is 2 out of 10.
Digital experience

Explore our digital experience! Every lesson in Amplify Desmos Math has student print materials and digital recommendations.

Cover of "Amplify Desmos Math, Student Edition, Grade 4," showcasing students collaborating on math problems involving shapes and numbers against a vibrant backdrop that blends cityscapes and natural scenery, capturing the essence of New York math learning.
Student Edition pages

Motivate students with mathematics that is both rigorous and delightful.

Cover of the "Amplify Desmos Math" Grade 4 Centers Resources book, featuring a large, stylized blue letter "C" on a light blue background. This essential resource for New York math educators ensures engaging and effective instruction.
Centers Resources

Engaging, hands-on games for students to play collaboratively to strengthen their understanding of key skills and concepts.

Cover of "Amplify Desmos Math, Grade 4: Intervention and Extension Resources," featuring a geometric illustration and a blue and orange color scheme inspired by New York math standards.
Intervention and Extension Resources

Additional resources to reinforce and extend key concepts, including Mini-Lessons and Extensions.

Interactive educational activity asking users to determine platform heights using a 3-inch tube. The interface, inspired by Desmos math tools, features a dragging function and feedback system with a checkbox and "Try another" option, amplifying the learning experience.

Students choose tube lengths to connect to platform heights for hamster homes, identifying possible heights using what they know about multiples.

A Grade 5 curriculum scope and sequence chart with units covering volume, fractions, multiplication, shapes, place value, and measurement. Each unit lists instructional and assessment days to amplify Desmos Math activities.
Program structure

Get to know the content and structure of Grade 5 Amplify Desmos Math.

Illustration of three students engaging with various math activities outdoors and around large blocks. Text at the top reads "Amplify Desmos Math, Grade 5, Teacher Edition" - a perfect resource for New York math educators.
Teacher Edition pages

Planning and instructional guidance is visual, organized, and easy-to-follow. To help you review the program, we have included samples from a complete sub-unit on this site: Unit 2, Sub-Unit 1: Fractions as Quotients.

A digital activity prompt showing a scenic landscape with bamboo shoots and a panda. Using Desmos math tools, the task is to estimate the length where the third bamboo shoot should be placed for the panda to reach a leaf. This exercise is designed to amplify your understanding of spatial reasoning.
Digital experience

Explore our digital experience! Every lesson in Amplify Desmos Math has student print materials and digital recommendations.

Cover of "Amplify Desmos Math: Student Edition, Grade 5" featuring students engaged in various mathematical activities outside, such as block building, measuring, and gardening—a perfect resource aligning with New York math standards.
Student Edition pages

Motivate students with mathematics that is both rigorous and delightful.

Cover image of "Amplify Desmos Math Grade 5 Centers Resources" featuring a large purple letter C on a light purple background, showcasing the innovative approach of Amplify Desmos Math that's making waves in New York math education.
Centers Resources

Engaging, hands-on games for students to play collaboratively to strengthen their understanding of key skills and concepts.

Cover of "Amplify Desmos Math Grade 5: Intervention and Extension Resources," featuring a large, stylized number five in purple against a light purple background with minimal geometric patterns, ideal for New York math curriculum support.
Intervention and Extension Resources

Additional resources to reinforce and extend key concepts, including Mini-Lessons and Extensions.

An interactive screen showing an activity about decomposing a figure into prisms, with a touch of Desmos Math integration. The user is asked to drag points to demonstrate the decomposition. Two prism illustrations are displayed, offering a glimpse of New York Math's approach.

Students decompose a figure into rectangular prisms and determine the volume of the figure by adding the volumes of the individual prisms.

Contact Us

If you have any questions throughout your review process or need additional samples, please don’t hesitate to contact:

Alicia O’Neil

Account Executive

425-890-6103

aoneil@amplify.com

Request additional samples

Ready to learn more? Connect with an Amplify Desmos Math expert to request additional program samples.

Supporting multilingual & English language learners

Multilingual/English learners (ML/ELs) bring unique strengths to classrooms, enriching the learning experiences for all.

At Amplify, we empower educators with tools that honor the strengths and capabilities of ML/ELs. Our curriculum and assessments meet students where they are and help them develop their skills, propelling them on their learning journeys.

Amplify supports ML/ELs across all subjects, from English language arts to math and science. For students who speak Spanish, we also provide a comprehensive biliteracy suite.

Four vibrant illustrations feature a goat, greeting phrases in Spanish and English, a map with an animal icon, and a fox with rabbits in a forest—perfect for engaging multilanguage & English language learners.
Illustration of a robot character, nine book covers above, and a tablet displaying an e-book page. A pink character stands on a stool holding a book, promoting a reading program for English language learners. Stars decorate the background.

Amplify CKLA core literacy curriculum for grades K–5

Amplify Core Knowledge Language Arts (CKLA) is a K–5 core curriculum built on the science of how students learn to read and write. Amplify CKLA supports ML/ELs in a variety of ways.

Image of a lesson page titled "Introducing the Read-Aloud," focused on speaking and listening skills. The highlighted section emphasizes "Speaking and Listening," seamlessly integrating into the literacy curriculum to support multilanguage & English language learners.

Scaffolding at five levels of proficiency

In addition to core instruction, Amplify CKLA provides lesson supports for Entering/Emerging, Transitioning/ Expanding, and Bridging levels.

An open workbook on writing skills, featuring instructions on creating paragraphs and checking understanding for literacy curriculum, with icons and a

Lesson differentiation

Lessons include Support and Challenge suggestions that provide assistance or opportunities for more advanced work toward the goal of the lesson. These resources are suitable for all learners, including ML/ELs.

A computer screen displays a multilanguage phonics learning app, ideal for English language learners, featuring an astronaut illustration and a play button for the sound "/a/".

Phonological awareness and phonics supports

The digital Sound Library easily facilitates sound development through videos showing mouth movements and songs that help students practice articulating new sounds with catchy lyrics.

A group of young children, including multilanguage and English language learners, sit cross-legged on a classroom floor, some with hands raised, appearing engaged and attentive.

Frequent oral language development opportunities

Amplify CKLA boosts language development with complex read-alouds, interactive discussion, writing activities, and explicit teaching of academic and domain vocabulary.

Amplify CKLA pairs with Amplify Caminos, its companion K–5 Spanish literacy program that supports biliteracy instruction.

Language Studio, an English Language Development companion program for Amplify CKLA

Language Studio, Amplify CKLA’s dedicated K–5 English language development companion program, offers daily 30-minute lessons to help ML/ELs practice reading, writing, speaking, and listening skills. Aligned to the World-Class Instructional Design and Assessment (WIDA) framework, Language Studio previews and reinforces language and content from core instruction, so that ML/ELs of all proficiency levels are able to access grade-level content as they develop academic English.

Four illustrated educational book covers are shown, each with different cultural and historical themes, titled "Language Studio Volumes 1-4" from Amplify Core Knowledge Language Arts—perfect for multilanguage and English language learners.
A young girl sits at a desk reading a book, while two other children are in the background—one using a laptop. The scene supports multilanguage and English language learners as they engage with different resources.

Interactive language development

Language Studio provides opportunities for classroom discussions, oral presentations, and writing tasks, promoting comprehension and learning by connecting with students’ cultural and linguistic backgrounds.

A worksheet labeled "Features of Academic Language," ideal for multilanguage and English language learners, with highlighted text: "Draw and Write," "Offer and Support Opinion," and "Tier 3 Domain-specific words.

Explicit vocabulary instruction

Interactive vocabulary and academic language support is provided before each lesson to deepen students’ understanding of text.

Two schoolgirls in green uniforms, English language learners, look at a notebook together in a multilanguage classroom—one holding a pencil box and pointing at the book.

Multimodal comprehension support

Students can preview content, interact with physical materials, compare text types, receive explicit grammar instruction, and have access to extensive vocabulary exercises.

A language proficiency assessment chart for multilanguage and English language learners, listing evaluation criteria and descriptors across five proficiency levels from entering to bridging.

Skill proficiency monitoring

Language Studio facilitates evaluation with an understanding of what students should produce at each level.

A person holds a tablet displaying educational progress, featuring profile images of two students labeled

mCLASS DIBELS 8th Edition literacy assessment for grades K–8

mCLASS® is an all-in-one system for Science of Reading-based universal screening, dyslexia screening, and progress monitoring for grades K–8. Powered by DIBELS 8th Edition, mCLASS provides valuable data on your ML/ELs’ literacy in English, helping you build a robust system of tiered supports. With a single tool, you can access the data and instructional support you need for each student’s literacy development, from phonics to comprehension, catering to all readers, from beginner to advanced.

A laptop screen displays a table showing the beginning-of-year assessment scores for four Grade 1 multilanguage and English language learners across three goal areas: Composite, LNF, and PSF.

Screening and reporting

mCLASS’s one-minute measures and dyslexia screening identify risk as early as possible, providing you with the right data to make informed decisions.

A laptop screen displays an educational platform with a lesson plan on decoding complex word patterns for Grade 3 English language learners under the "Instruction" tab, supporting multilanguage development.

Language considerations

mCLASS provides specific language guidance, offers ML/EL instructional strategies, and considers each student’s unique language background, never penalizing for language variety, accent, or articulation, and extending this understanding into small-group practices.

A computer screen displays a dashboard with student assessment data, including charts and tables comparing performance across different benchmarks for multilanguage and English language learners.

Performance and reporting transparency

Understand student performance through direct observation and detailed reports which offer growth insights, including district-wide student achievement data that can be filtered by EL status, Home Language, or English Proficiency status.

mCLASS pairs with mCLASS Lectura, an authentic Spanish literacy assessment for K–8 that measures key foundational skills and supports Spanish-speaking bilingual students.

mCLASS Intervention for grades K–6

mCLASS Intervention is our K–6 reading intervention program, designed to support you in providing effective Tier 2 and 3 instruction and getting readers on track. mCLASS Intervention does the heavy lifting of data analysis and lesson planning for you. This lets you focus on what you do best: teaching the skills each student needs to become a confident reader.

Infographic showing a 10-day cycle: measure skills, group multilanguage and English language learners, generate lessons, teach students, and provide practice, all arranged in a circular flow.
A worksheet page titled "Introduce a" with instructional text, a letter grid activity, support tips, and a section labeled “Challenge,” overlaid by the text “Multimodal learner resources” for multilanguage and English language learners.

Effective lessons with built-in support

Lessons are equipped with best practices and guidance targeting language and literacy development for ML/ELs. The program also includes materials and resources that make content accessible to Spanish-speaking students.

A lesson plan shows students, skills, and Day 1 activities for a 10-day Blending and Regular Words set—ideal for multilanguage and English language learners—involving sounding out, blends, and a word race game.

Structured small groups

Once groups are formed, mCLASS Intervention determines the ideal focus for each group and automatically prepares two weeks of targeted lessons.

A line graph showing Emma Ashley's letter sounds scores: 20 in August, 74 in December (benchmark), and projected to reach 90 in May—demonstrating strong progress for multilanguage and English language learners.

Keeps you updated on student progress

Track student growth with reliable progress-monitoring tools and reporting that provides a clear view of each student’s progress.

A young girl with headphones uses a laptop, sitting in front of a colorful, illustrated background with trees, clouds, a bird, and Science of Reading and ESSA Evidence badges—perfect for multilanguage and English language learners.

Boost Reading personalized reading program for grades K–5

A key component of Amplify’s early literacy suite, Boost Reading is a personalized learning program for K–5 that offers comprehensive targeted practice, built-in benchmark assessments, and powerful reporting. Boost Reading provides practice in the full progression of key phonics and comprehension skills critical to literacy development.

Boost Reading works. Results of a year-long study show that students in grades K–5—including ML/ELs—who used Boost Reading for 30 minutes a week significantly outperformed their peers.

A computer screen displays a sentence highlighting the words "Mateo" and "he," with arrows connecting them—helpful for multilanguage and English language learners. A "Done" button and an illustrated face are also visible.

Systematic instruction in foundational skills and comprehension

Reinforce core instruction with explicit practice in phonics and phonological awareness. Boost Reading is the only program that focuses on comprehension processes—what readers do while reading that allows them to make sense of text—which is especially beneficial for ML/EL students.

A laptop screen displays a cartoon mouth, a person’s face above it, and four toast-shaped buttons below—ideal for multilanguage practice and engaging English language learners.

Mouth formation modeling for articulation support

Boost Reading includes specific scaffolds and supports—such as a modeling of mouth formations for articulation—that are proven to be beneficial for ML/ELs.

A colorful educational game screen supports English language learners and multilanguage skills, showing a creature on a log labeled "stamp" with four word choices: sand, stand, stamp, and champ. A waterfall and plants are in the background.

Vocabulary practice

Targeted morphology practice for independent vocabulary building and explicit instruction with Tier 2 vocabulary words are proven to be supportive for ML/ELs.

Boost Reading pairs with Boost Lectura, a Spanish literacy program for K–2 that provides students with personalized practice to develop Spanish literacy skills.

Want to learn more about Amplify’s elementary biliteracy suite?

Fill out this form, and we’ll be in touch with you shortly.

Amplify ELA core literacy curriculum for grades 6–8

With Amplify ELA, students learn to tackle any complex text and make observations, grapple with interesting ideas, and find relevance for themselves. Amplify ELA is a grade 6–8 English language arts program designed to bridge language gaps and enhance learning for ML/ELs. With integrated supports in every lesson, Amplify ELA empowers educators to deliver grade-level content while maintaining rigorous standards, thus reducing barriers to language acquisition and boosting student success.

A tablet showcases an educational lesson interface about butterflies, alongside a book titled "Amplify ELA: Summer of the Mariposas," surrounded by illustrated butterflies, enriching the literacy curriculum and engaging multilanguage & English language learners.
A tablet screen displays a digital reading and writing assignment with text excerpts on the left and character trait questions on the right, designed to support multilanguage and English language learners.

Built-in scaffolds

Background documents (in English and Spanish) establish context and support comprehension before students begin to read. Features such as audio assessments, read-aloud, and Reveal words ensure that all students have the opportunity to engage with and understand grade-level materials.

A worksheet with a writing prompt about "Summer of the Mariposas," designed to support multilanguage and English language learners as they describe a character and explain her traits using evidence from the story.

Differentiated writing prompts

Simplified language, sentence starters, word banks, and visual cues offer the necessary levels of support to help students meet their writing goals.

A book titled "Mysteries & Investigation Multi-Language Glossary" with glossary cards for English-French and English-Vietnamese translations of the phrase "a wealth of," ideal for multilanguage study and English language learners.

Multi-language glossaries

Available in 11 languages—English, Arabic, Chinese, French, Haitian Creole, Portuguese, Russian, Spanish, Tagalog, Urdu, and Vietnamese—these glossaries support vocabulary development and comprehension.

Amplify Desmos Math core curriculum for grades K–12

Amplify Desmos Math is a curiosity-driven K–12 program that builds students’ lifelong math proficiency. Every lesson in Amplify Desmos Math includes opportunities for all students to develop mathematical language as they experience the content, while providing intentional support for ML/ELs. We purposefully progress language development from lesson to lesson and across units by supporting students in making their arguments and explanations stronger, clearer, and more precise.

A text box suggests encouraging multilanguage and English language learners to paraphrase peers’ ideas, building connections and using unit vocabulary, with an emphasis on speaking and listening skills.

Multilingual/English learner support

Supports for ML/ELs are called out at intentional points within each lesson. These specific, targeted suggestions support ML/ELs with modifications that increase access to a task, or through development of contextual or mathematical language (both of which can be supportive of all learners). ML/EL supports may also be attached to Math Language Routines.

A text box explaining MLR7: Compare and Connect, with prompts for students—including multilanguage and English language learners—to analyze, compare, and connect different problem-solving strategies.

Math Language Routines (MLRs)

Math Language Routines are used within lessons to highlight student-developed language and ideas, cultivate conversation, support mathematical sense-making, and promote metacognition. Tips for facilitating MLRs are included when they would be helpful within lessons.

A white box lists today’s goals for a lesson on parallelograms, including area calculation and encouraging multilanguage & English language learners to use mathematical language in writing, speaking, and listening.

Language goals and vocabulary

Language goals attend to the mathematics students are learning, and are written through the lens of one (or more) of four language modalities: reading, writing, speaking, and listening. Units and lessons start by surfacing students’ language for new concepts, then building connections between their language and the new vocabulary for that unit. This honors the language assets that students bring into their learning.

Amplify Science core curriculum for grades
K–8

Amplify Science is a curiosity-driven science curriculum that empowers students to Do, Talk, Read, Write, and Visualize like scientists. Through phenomena-based, literacy-rich, and interactive learning experiences, it develops students into critical thinkers who will gain the skills they need to solve real problems in their communities and the world. For students who need additional support, Amplify Science provides specialized instructional approaches, activities, and resources that take into account English learners’ level of language proficiency.

A teacher and three children, all English language learners, interact enthusiastically around a table with a colorful project in a classroom setting. The lively discussion enhances their literacy curriculum experience, fostering both creativity and understanding.
A document page titled "Patterns of Earth and Sky" is shown, with a highlighted overlay listing printable resources for multilanguage and English language learners, such as objectives, compilations, and glossaries.

Instructional design built on five key principles

Amplify Science leverages background knowledge, capitalizes on student knowledge of language, provides explicit instruction about the language of science, gives students opportunities with scaffolded practice, and enables students to access science content and express science knowledge through a multimodal approach.

A blue square with two arrows forming a loop, next to the words: Do, Talk, Read, Write, Visualize—ideal for multilanguage and English language learners.

Do, Talk, Read, Write, Visualize instructional model

Our multimodal instructional approach caters to diverse learning needs and promotes active engagement for all learners.

A webpage section titled "Differentiation" discusses teaching strategies for diverse learners, including multilanguage and English language learners, with a sidebar listing various digital resources and lesson materials.

Honoring multilingualism

Amplify Science honors multilingualism as students are invited to share in their native language at strategic points in instruction. Teacher-led instruction on cognates and a multilingual glossary in 10 languages offer additional support.

Cover of a Spanish-language science booklet titled "Patrones de la Tierra y del cielo," ideal for multilanguage and English language learners, featuring a space illustration and an orange "Cuaderno de investigación" button at the bottom.

Spanish instructional materials

Carefully translated materials use academic Spanish, with attention to consistency and grade-level appropriate language, to support language development.

A biliteracy suite grounded in the Science of Reading

Discover a suite of Spanish literacy curriculum and assessment programs designed to build confident readers with Amplify CaminosmCLASS Lectura, and Boost Lectura. Amplify’s biliteracy suite includes assessment, core instruction, and personalized learning built on the Science of Reading.

Explore more programs in Amplify’s literacy and biliteracy suites.

All of the programs in our literacy suite and our biliteracy suite are designed to support and complement each other. Learn more about our related programs:

A digital reading intervention that delivers growth across every tier of instruction

Boost Reading is a student-led K–5 digital intervention, built on the Science of Reading, that delivers systematic instruction. Students receive targeted, adaptive practice that meets them where they are, while teachers get simple and meaningful insights into student progress without extra work. Fully aligned to Amplify CKLA and mCLASS®, Boost Reading brings powerful support to every tier of instruction. Para la versión en español, haga clic aquí.

A young girl wearing headphones smiles while using a laptop, with colorful graphics and badges indicating "Moderate ESSA Evidence" and "Built on the Science of Reading," highlighting a K–5 personalized reading curriculum.

Proven impact for students who need it most

Boost Reading meets ESSA’s Moderate (Tier 2) Evidence criteria and consistently moves students who score below and well-below benchmark toward benchmark with just 30 minutes of use per week. Boost Reading provides extra support to students (including multilingual/English learners and students with dyslexia) struggling with reading, with practice that builds a strong foundation for future reading success from the ground up. Learn more about the program’s impact on the Boost Reading research page.

Nearly 65% of kindergarten students who started the year at risk and used Boost Reading reached benchmark by the end of the year, compared to 48% of the comparison group.

Learn more

English language learners who started the year below benchmark were 43% more likely to finish the year on track compared to those who did not use Boost Reading.
“My students love the program, and they don’t even realize they are learning some tough concepts. Their reading scores are improving even since the beginning of the year.”

Amber

Junior High ELA teacher, California

Critical to MTSS with differentiated support for every learner

Boost Reading adapts automatically, so students practice the right skills at the right moment. Tier 2 students get meaningful independent intervention support, while Tier 3 students receive additional skill reinforcement between their staff-led sessions with mCLASS Intervention. Boost Reading follows the same foundational skills sequence as Amplify CKLA, which means that students practice skills unique to them, making Boost Reading an effective part of a Multi-Tiered System of Support (MTSS).

Split image: On the left, a girl uses a laptop with the label “Tier 2 Student-led intervention” featuring a K–5 personalized reading curriculum. On the right, a teacher assists two boys with laptops, labeled “Tier 3 staff-led intervention.”.

Data you can actually use in your classroom

Boost Reading shows you exactly what you need to know about student progress, through simple growth reporting on the Teacher Dashboard. See who’s improving, who needs support, and which skills to target next without having to spend time digging through complicated data.

Aligned to Amplify CKLA and mCLASS DIBELS 8th Edition

Boost Reading follows Amplify CKLA’s scope and sequence, making it easy to integrate into your daily routines by reinforcing the same skills you’re already teaching. It uses mCLASS DIBELS® 8th Edition data to provide targeted support and placement, giving teachers a clear view of how students progress across all instructional tiers.

Three text boxes display the names of K–5 literacy resources: "Boost Reading," "Amplify CKLA," and "mCLASS," with the words "Boost," "Amplify," and "mCLASS" in orange font.
Oso de dibujos animados jugando al fútbol, pateando una pelota con la etiqueta "ma", con burbujas de discurso que dicen "¡hola!" en español e inglés, al lado de una portería con un letrero "Currículo de lectura personalizado para jardín de infantes a 5.º grado".

Closing the gap for
K–2 multilingual/English learners

Boost Reading’s Spanish literacy partner, Boost Lectura, strengthens early literacy for Spanish-speaking multilingual/English learners. When used together, the two programs give teachers side-by-side insight into skill progression in Spanish and English, helping accelerate learning across both languages.

Boost Reading efficacy study

Closing the literacy gap for K–5 students

Download now

What’s included

A dashboard section titled "Trouble Spots" lists students under "Early Decoding" by skill, showing names and resource links for decoding and spelling word skills from a K–5 personalized reading curriculum.

Pinpoint the skills that need your attention

The Trouble Spots section makes it easy to see which students are struggling and what skills they need to work on. Printable, ready-to-teach lessons allow you to pull together small groups in minutes.

Watch your students grow

Never miss a moment of your students’ literacy development, with monthly growth reporting! You’ll be able to track how students are developing skills month over month, and see their reading trajectory unfold.

Line graph titled "Monthly Growth" shows three risk categories—At Risk, Some Risk, Minimal Risk—from September to January. Visualize student progress using this K–5 personalized reading curriculum as your supplemental reading curriculum.
A chart compares Student 1, who demonstrates mastery in decoding blends, with Student 2, who needs targeted practice and reinforcement to decode words with blends using a K–5 personalized reading curriculum.

A program that grows with your students

Boost Reading continuously tailors instruction based on individual student performance. That means scaffolding foundational skills while building proficiency, one engaging activity at a time. There’s no stalled practice, and you’ll see steady progress across key reading skills.

Benchmark and growth assessments

Boost Reading combines built-in benchmark assessments with monthly skill scans to give teachers a holistic view of progress from the beginning of the year to the end of the year. The monthly skill scans act as check-ins between benchmark windows, so you’ll always know where students stand with a complete picture of their learning.

A chart titled "Benchmark Performance" shows equal 25% scores for four categories at the beginning and middle of the year when using a K–5 personalized reading curriculum; no data is available for end of year.
A flow chart shows language comprehension and word recognition strands merging into skilled reading, highlighting progression from basic to advanced skills—a clear visual for any K–5 literacy resource.

Science of Reading scope and sequence

Boost Reading introduces skills in the order research shows students learn best. Phonological awareness builds into phonics, vocabulary, and comprehension for a solid foundation and confident readers.

Administrator and caregiver reports

Administrators and caregivers are welcomed into the student reading journey with data on program usage, reading progress, and skill mastery.

Pie chart titled "Grades 2–5 Growth" shows 45% below, 31% typical, and 24% above. Legend explains growth percentiles for a K–5 personalized reading curriculum: above, typical, below.
Insignia de premio con el texto "Premios de excelencia en tecnología y aprendizaje 2023, regreso a clases, ganador del plan de estudios de lectura personalizado K-5".

Award-winning technology that drives student growth

Learn more

Explore more programs based on the Science of Reading.

All of the programs in our literacy suite are designed to support and complement each other. Learn more about our related programs:

What’s included in our literacy curriculum for 6–8

Amplify ELA is a blended literacy curriculum designed specifically for grades 6–8. The heart of every lesson is the text. Our core English Language Arts curriculum enables teachers to teach skills through texts and develop their students’ muscles for building meaning through reading. With Amplify ELA, students learn to attack any complex text and make observations, grapple with interesting ideas, and find relevance for themselves.

Year at a glance

Each grade includes six core units centered on literary or informational texts, delivered in several forms of media. In addition to these main units, students will engage with targeted Grammar lessons and a dedicated Story Writing unit, plus two to three immersive learning experiences called Quests.

Dahl & Narrative

1 assessment lesson
4 sub-units | 28 lessons | 4-6 weeks

A man with a mustache looks through a microscope at a slide, with abstract yellow lines in the background.

Mysteries & Investigations

1 assessment lesson
5 sub-units | 32 lessons | 4-6 weeks

A man with a mustache looks through a microscope at a slide, with abstract yellow lines in the background.

The Chocolate Collection

1 assessment lesson
5 sub-units | 25 lessons | 4-6 weeks

The Greeks

Myth World Quest

1 assessment lesson
4 sub-units | 25 lessons | 4-6 weeks

A man with a mustache looks through a microscope at a slide, with abstract yellow lines in the background.

Summer of the Mariposas

1 assessment lesson
2 sub-units | 27 lessons | 4-6 weeks

A man with a mustache looks through a microscope at a slide, with abstract yellow lines in the background.

The Titanic Collection

1 assessment lesson
5 sub-units | 25 lessons | 4-6 weeks

A man with a mustache looks through a microscope at a slide, with abstract yellow lines in the background.

Red Scarf Girl

1 assessment lesson
4 sub-units | 31 lessons | 4-6 weeks

A man with a mustache looks through a microscope at a slide, with abstract yellow lines in the background.

Character & Conflict

1 assessment lesson
4 sub-units | 29 lessons | 4-6 weeks

A man with a mustache looks through a microscope at a slide, with abstract yellow lines in the background.

Brain Science

Perception Academy Quest

1 assessment lesson
4 sub-units | 25 lessons | 4-6 weeks

A man with a mustache looks through a microscope at a slide, with abstract yellow lines in the background.

Poetry & Poe

The “Who Killed Edgar Allen Poe” Quest

1 assessment lesson
5 sub-units | 29 lessons | 4-6 weeks

A man with a mustache looks through a microscope at a slide, with abstract yellow lines in the background.

The Frida & Diego Collection

1 assessment lesson
5 sub-units | 25 lessons | 4-6 weeks

A man with a mustache looks through a microscope at a slide, with abstract yellow lines in the background.

The Gold Rush Collection

1 assessment lesson
5 sub-units | 25 lessons | 4-6 weeks

A man with a mustache looks through a microscope at a slide, with abstract yellow lines in the background.

Perspectives & Narrative

1 assessment lesson
4 sub-units | 27 lessons | 4-6 weeks

A man with a mustache looks through a microscope at a slide, with abstract yellow lines in the background.

Liberty & Equality

1 assessment lesson
6 sub-units | 38 lessons | 4-6 weeks

A man with a mustache looks through a microscope at a slide, with abstract yellow lines in the background.

Science & Science Fiction

1 assessment lesson
3 sub-units | 29 lessons | 4-6 weeks

A man with a mustache looks through a microscope at a slide, with abstract yellow lines in the background.

Shakespeare’s Romeo & Juliet

1 assessment lesson
2 sub-units | 22 lessons | 4-6 weeks

A man with a mustache looks through a microscope at a slide, with abstract yellow lines in the background.

The Holocaust: Memory & Meeting

1 assessment lesson
6 sub-units | 21 lessons | 4-6 weeks

A man with a mustache looks through a microscope at a slide, with abstract yellow lines in the background.

The Space Race Collection

1 assessment lesson
5 sub-units | 25 lessons | 4-6 weeks

Units at a glance

Amplify ELA lessons follow a structure both grounded in regular routines and flexible enough to allow for a variety of learning experiences. Lesson structures vary from day to day, ensuring that students are always engaged.

Learn more in the Amplify ELA Grade Overview.

Unit 6A

Dahl & Narrative

Students begin with narrative writing to develop foundational Focus skills and establish key classroom routines. Teachers use this work to create targeted feedback cycles and build a vibrant community centered on diverse experiences. Students then apply observational skills to Roald Dahl’s Boy: Tales of Childhood, learning to work closely with textual evidence.

Unit 6B

Mysteries & Investigations

Students read like an investigator to embark on a multi-genre study into the mesmerizing world of scientific and investigative sleuthing. The Secret of the Yellow Death: A True Story of Medical Sleuthing by Suzanne Jurmain, and Sir Arthur Conan Doyle’s Sherlock Holmes stories take place in the late 19th century, when medical diagnostics and criminal investigations were still evolving into scientific fields.

Unit 6C

The Chocolate Collection

Students explore primary documents and research the diverse cultural roles chocolate has played over 3,700 years, from its various uses in ancient Mexico to issues with modern production. Along the way, they build information literacy skills, craft research questions, and collaborate in Socratic seminars. Students also learn how to construct an evidence-based argument and use those skills to write pieces aimed at convincing readers about chocolate preferences, school lunch policies, and recommendations for local candy stores.

Unit 6D

The Greeks

Students closely explore and analyze three stories from Greek mythology: “Prometheus,” “Odysseus,” and “Arachne.” Drawing on the routines and skills established in previous units, these lessons ask students to move from considering the state of a single person to contemplating broader questions concerning the role people play in the world and the various communities they inhabit.

Unit 6E

Summer of the Mariposas

Students read Summer of the Mariposas by Guadalupe García McCall, a contemporary Latino retelling of The Odyssey. Following five sisters on their journey into Mexico and back, students explore this reimagining of the hero’s journey as they encounter Mexican folklore and Aztec legends along the way. Students analyze character development, compare the novel to Homer’s original, research Aztec mythology, explore symbolism, and engage in collaborative discussions before writing an essay about what makes the heroes successful.

Unit 6F

The Titanic Collection

Students explore primary documents and conduct research to understand the 1912 Titanic disaster, building information literacy skills by examining artifacts such as dining menus, ship photos, telegraph transcripts, and newspaper accounts. Each student is assigned a passenger from the manifest and writes a narrative account from that person’s perspective, considering different views. Students also participate in Socratic seminars to examine the complicated issues within the Titanic story.

Unit 7A

Red Scarf Girl & Narrative

Students begin with narrative writing to develop foundational Focus skills while teachers establish targeted feedback cycles and build a classroom community centered on diverse experiences. After exploring how they describe their own experiences and emotions, students apply the same close attention to analyzing details in Ji-li Jiang’s Red Scarf Girl: A Memoir of the Cultural Revolution.

Unit 7B

Character & Conflict

Students analyze characters’ responses to conflict and examine how authors use character interactions to develop theme and perspective. They read Carson McCullers’ “Sucker” and Lorraine Hansberry’s A Raisin in the Sun, both texts that explore how families facing hardships can support and harm one another. Students observe complex character growth and discuss issues of identity, family obligations, and differing notions of success.

Unit 7C

Brain Science

Students explore narrative nonfiction and informational texts about brain science to understand what it means to be human and how their developing brains impact daily experiences. They also build awareness of their cognitive strengths and analyze the structures of informational texts and scientific arguments. Key texts include Phineas Gage, Inventing Ourselves: The Secret Life of the Teenage Brain, and Oliver Sacks’ The Man Who Mistook His Wife for a Hat.

Unit 7D

Poetry & Poe

Students learn visualization techniques to read like a movie director, beginning with poems by D.H. Lawrence, Federico García Lorca, and Emily Dickinson to form mental images. They then read three Edgar Allan Poe texts, creating storyboards and analyzing narrative elements to learn about unreliable narrators. Students also participate in the murder-mystery Quest “Who Killed Edgar Allan Poe?” and write an essay arguing whether they can trust a narrator in the unit’s texts.

Unit 7E

The Frida & Diego Collection

Students explore primary source documents and research on Mexican artists Diego Rivera and Frida Kahlo, learning how they drew inspiration from Latin American folklore, politics, and customs. Along the way, students build information literacy by generating research questions and visual analysis skills through close reading of key paintings. They also compare the artists’ descriptive writing to Shakespeare’s and analyze figurative language. The unit culminates in a research project showcasing their interpretation of Frida and Diego’s work and legacy.

Unit 7F

The Gold Rush Collection

Students explore primary documents and conduct research on the California Gold Rush, building information literacy skills and constructing research questions. They also learn about the diverse people who participated, compare fictional and historical accounts, and participate in Socratic seminars. Students write narrative accounts from specific perspectives and complete a culminating research assignment combining essay and media project elements.

Unit 8A

Perspectives & Narrative

Students learn to read like writers, paying attention to craft and writing moves that shape reader experience and developing Focus and Showing skills as they build collaborative classroom routines. Students study three narrative texts, exploring themes of belonging and identity through close reading. They also practice alternating between analytic and narrative writing, and conclude with an essay arguing whether the mothers in Amy Tan’s “Fish Cheeks” are role models. 

Unit 8B

Liberty & Equality

Students study Civil War-era writings that debate the meaning of “all men are created equal,” exploring various perspectives on American ideals. Key texts include Walt Whitman’s Leaves of Grass, Frederick Douglass’ Narrative, and Harriet Ann Jacobs’s Incidents in the Life of a Slave Girl. The unit culminates with an essay examining Douglass’s arguments and Lincoln’s Gettysburg Address to consider what America means by “all men are created equal.”

Unit 8C

Science & Science Fiction

Students read Gris Grimly’s Frankenstein, a graphic novel adaptation of Mary Shelley’s novel, exploring themes of creator responsibility, societal influence, and the risks of scientific inquiry. They trace Victor’s sympathy for his creation, rewrite scenes from the creature’s perspective, and debate whether Victor owes the creature a companion. The unit concludes with an essay determining whether the creature should be considered human.

Unit 8D

Shakespeare’s Romeo & Juliet

Students read five excerpts from Shakespeare’s Romeo and Juliet to learn key elements of Shakespearean English through close reading. They practice memorizing and reciting the famous “Prologue,” put on stage performances, translate Shakespeare’s language into contemporary terms, and study the Shakespearean sonnet form. The unit concludes with an essay arguing whether love or hate is responsible for Romeo’s death.

Unit 8E

Holocaust: Memory & Meaning

Students use close reading to explore memoirs and primary sources that address two key Holocaust questions: How do societies become participants in atrocity, and what are our responsibilities as witnesses? Students analyze multiple perspectives through texts, including Alexander Kimel’s “I Cannot Forget,” Irene Butter’s Shores Beyond Shores, 1936 Olympics propaganda, and excerpts from Maus and Night.

Unit 8F

The Space Race Collection

Students explore primary documents and conduct research on the Space Race. They build information literacy skills, construct research questions, and learn about diverse participants from Soviet cosmonauts to American heroes like Buzz Aldrin and Katherine Johnson. Each student researches an assigned cosmonaut or astronaut and writes space blog entries from their perspective. Students also complete a capstone research essay and media project.

Print & digital components

The program includes instructional guidance and student materials for a year of instruction, with lessons and activities that keep students engaged every day.

A diagram shows the Amplify ELA curriculum with examples of the digital teacher edition on a tablet, print teacher edition pages, and a teacher projection of an artwork on a screen.

Teacher materials

Teacher Edition

Available digitally and in print, the Teacher’s Edition contains all the information teachers need to facilitate classroom instruction, including detailed lesson plans, video teacher tips, presentation slides, standards alignment, Exit Tickets, real-time differentiation strategies, and robust reporting.

Student materials

Student Edition

Available digitally and in print, student materials guide middle schoolers through complex texts and writing by engaging them with high-quality narrative and informational texts—providing videos, audio supports, and a digital experience that captures their attention. They also keep all of their writing in one place with a personal Writing Journal.

A collection of Amplify ELA materials including a print student edition, a digital student edition on a laptop, a writing journal, and an Arachne literature module.

Explore more programs

Our programs are designed to support and complement one another. Learn more about our related programs.

Reveal Math

Grade 6

Module 1: Ratios and Rates

Reveal MathDesmos Classroom
Lesson 1: Understand ratiosUnit 2
Lesson 1: Pizza Maker
Lesson 2: Tables of Equivalent RatiosUnit 2
Lesson 10: Disaster Preparation
Lesson 4: Compare Ratio RelationshipsUnit 2
Lesson 4: Fruit Lab
Lesson 6: Convert Customary Measurement UnitsUnit 3
Lesson 1: Many Measurements
Lesson 7: Understand Rates and Unit RatesUnit 3
Lesson 6: Soft Serve

Module 2: Fractions, Decimals, and Percents

Lesson 1: Understand PercentsUnit 3
Lesson 9: Lucky Duckies
Lesson 3: Relate Fractions, Decimals, and PercentsUnit 5
Lesson 2: Decimal Diagrams and Algorithms

Module 3: Compute with Multi-Digit Numbers and Fractions

Lesson 1: Divide Multi-Digit Whole NumbersUnit 5
Lesson 13: Movie Time
Lesson 3: Divide Whole Numbers by FractionsUnit 4
Lesson 3: Flour Planner
Lesson 4: Divide Fractions by FractionsUnit 4
Lesson 6: Fill the Gap
Lesson 5: Divide with Whole and Mixed NumbersUnit 4
Lesson 6: Fill the Gap

Module 4: Integers, Rational Numbers, and the Coordinate Plane

Lesson 1: Represent IntegersUnit 7
Lesson 1: Can You Dig It?
Lesson 3: Compare and Order IntegersUnit 7
Lesson 4: Order in the Class

Module 5: Numerical and Algebraic Expressions

Lesson 3: Write Algebraic Expressions
Lesson 4: Evaluate Algebraic Expressions
Unit 6
Lesson 8: Products and Sums
Take Away (coming soon!)
Lesson 6: Use the Distributive PropertyUnit 6
Lesson 8: Products and Sums
Take Away (coming soon!)
Lesson 7: Equivalent Algebraic ExpressionsUnit 6
Lesson 1: Weight for It

Module 6: Relationships in Geometry

Lesson 2: One-Step Addition Equations
Lesson 3: One-Step Subtraction Equations
Unit 6
Lesson 1: Weight for It
Lesson 6: InequalitiesUnit 7
Lesson 7: Tunnel Travels

Module 7: Relationships Between Two Variables

Lesson 4: Multiple RepresentationsUnit 6
Lesson 16: Subway Fares
Take Away (coming soon!)

Module 8: Area

Module 9: Volume and Surface Area

Lesson 2: Surface Area of Rectangular PrismsUnit 1
Lesson 10: Renata’s Stickers

Module 10: Statistical Measures and Displays

Lesson 1: Statistical QuestionsUnit 8
Lesson 3: Minimum Wage
Lesson 2: Dot Plots and HistogramsUnit 8
Lesson 5: The Plot Thickens
Lesson 3: Measures of CenterUnit 8
Lesson 11: Toy Cars
Lesson 7: Interpret Graphical DisplaysUnit 8
Lesson 3: Minimum Wage

Grade 7

Module 1: Proportional Relationships

Reveal MathDesmos Classroom
Lesson 1: Unit Rates Involving Ratios of FractionsUnit 2
Lesson 1: Paint
Lesson 3: Tables of Proportional ReasoningUnit 2
Lesson 1: Paint
Lesson 4: Graphs of Proportional ReasoningUnit 2
Lesson 8: Dino Pops
Lesson 5: Equations of Proportional ReasoningUnit 2
Lesson 6: Two and Two

Module 2: Solve Percent Problems

Lesson 1: Percent of ChangeUnit 4
Lesson 5: Percent Machines
Lesson 12: Posing Percent Problems (coming soon!)
Lesson 3: Tips and MarkupsUnit 4
Lesson 5: Percent Machines
Lesson 4: DiscountsUnit 4
Lesson 5: Percent Machines

Module 3: Operations with Integers

Lesson 1: Add Integers
Lesson 2: Subtract Integers
Unit 5
Lesson 4: Draw Your Own
Lesson 10: Integer Puzzles
Lesson 3: Multiply IntegersUnit 5
Lesson 10: Integer Puzzles
Lesson 5: Apply Integers OperationsUnit 5
Lesson 10: Integer Puzzles

Module 4: Operations with Rational Numbers

Lesson 1: Add Integers
Lesson 2: Subtract Integers
Unit 5
Lesson 4: Draw Your Own
Lesson 10: Integer Puzzles
Lesson 3: Multiply IntegersUnit 5
Lesson 10: Integer Puzzles
Lesson 5: Apply Integers OperationsUnit 5
Lesson 10: Integer Puzzles

Module 5: Simplify Algebraic Expressions

Lesson 2: Add Linear Expressions
Lesson 3: Subtract Linear Expressions
Unit 6
Lesson 10: Collect the Squares
Lesson 4: Solve Inequalities Using Addition or SubtractionUnit 6
Lesson 16: Shira the Sheep

Module 6: Write and Solve Equations

Lesson 1: Write and Solve One-Step EquationsUnit 6
Lesson 16: Shira the Sheep

Module 7: Write and Solve Inequalities

Lesson 6: Wirte and Solve Two-Step InequalitiesUnit 6
Lesson 16: Shira the Sheep

Module 8: Geometric Figures

Lesson 1: Vertical and Adjacent AnglesUnit 7
Lesson 4: Missing Measures
Lesson 2: Complementary and Supplementary AnglesUnit 7
Lesson 2: Friendly Angles
Lesson 3: TrianglesUnit 7
Lesson 5: Can You Build It?
Lesson 4: Scale DrawingsUnit 1
Lesson 1: Scaling Machines
Lesson 7: Will It Fit?

Module 9: Measure Figures

Lesson 1: Circumference of CirclesUnit 3
Lesson 3: Measuring Around
Lesson 2: Area of CirclesUnit 3
Lesson 9: Area Challenges

Module 10: Probability

Lesson 1: Find Likelihoods
Lesson 2: Relative Frequency of Simple Events
Lesson 3: Theoretical Probability of Events
Unit 8
Lesson 1: How Likely?
Lesson 2: Prob-bear-bilities

Module 11: Sampling and Statistics

Lesson 1: Biased and Unbiased SamplesUnit 8
Lesson 10: Crab Island
Lesson 2: Make Predictions
Lesson 3: Generate Multiple Samples
Unit 8 
Lesson 10: Crab Island
Lesson 4: Compare Two PopulationsUnit 8
Lesson 10: Crab Island

Grade 8

Module 1: Exponents and Scientific Notation

Reveal MathDesmos Classroom
Lesson 1: Powers and ExponentsUnit 7 
Lesson 1: Circles
Lesson 2: Multiply and Divide MonomialsUnit 7 
Lesson 3: Power Pairs
Lesson 3: Power of MonomialsUnit 7 
Lesson 3: Power Pairs
Lesson 5: Scientific NotationUnit 7 
Lesson 9: Specific and Scientific
Lesson 11: Balance the Scale
Lesson 6: Compute with Scientific NotationUnit 7 
Lesson 9: Specific and Scientific
Lesson 11: Balance the Scale

Module 2: Real Numbers

Lesson 2: RootsUnit 8
Lesson 4: Root Down

Module 3: Solve Equations with Variables on Each Side

Lesson 1: Solve Equations with Variables on Each SideUnit 4
Lesson 5: Equation Roundtable
Lesson 2: Write and Solve Equations with Variables on Each SideUnit 4
Lesson 5: Equation Roundtable
Lesson 5: Determine the Number of Solutions

Module 4: Linear Relationships and Slope

Lesson 1: Proportional Relationships and SlopeUnit 3
Lesson 1: Turtle Time Trials
Lesson 2: Slope of a LineUnit 3
Lesson 4: Flags
Lesson 5: Slope-Intercept FormUnit 4
Lesson 5: Equation Roundtable
Lesson 6: Graph Linear EquationsUnit 3
Lesson 4: Flags
Unit 5
Lesson 5: The Tortoise and the Hare

Module 5: Functions

Lesson 1: Identify FunctionsUnit 5
Lesson 1: Turtle Crossing
Lesson 2: Guess My Rule
Lesson 6: Qualitative GraphsUnit 5
Lesson 5: The Tortoise and the Hare

Module 6: Systems of Linear Equations

Lesson 1: Solve Systems of Equations by GraphingUnit 4 
Lesson 11: Make Them Balance

Module 7: Triangles and the Pythagorean Theorem

Lesson 2: Angle Relationships and TrianglesUnit 1 
Lesson 12: Puzzling It Out

Module 8: Transformations

Lesson 1: Translations
Lesson 2: Reflections
Lesson 3: Rotations
Unit 1
Lesson 1: Transformers
Lesson 2: Spinning, Flipping, Sliding
Lesson 4: Moving Day
Lesson 4: DilationsUnit 2
Lesson 1: Sketchy Dilations
Lesson 2: Dilation Mini Golf

Module 9: Congruence and Similarity

Lesson 3: Similarity and TransformationsUnit 2
Lesson 6: Social Scavenger Hunt

Module 10: Volume

Lesson 1: Volume of CylindersUnit 5
Lesson 11: Cylinders
Lesson 2: Volume of ConesUnit 5
Lesson 13: Cones

Module 11: Scatter Plots and Two-Way Tables

Lesson 1: Scatter PlotsUnit 6 
Lesson 3: Robots
Lesson 2: Draw Lines of FitUnit 6 
Lesson 4: Dapper Cats
Lesson 6: Find the Fit
Lesson 4: Two-Way TablesUnit 6
Lesson 11: Finding Associations
Lesson 5: Associations in Two-Way TablesUnit 6
Lesson 11: Finding Associations

GO Math!-NEW

To view this protected page, enter the password below:


Big Ideas

Grade 6

Chapter 2: Fractions and Decimals

Big IdeasDesmos Classroom
Lesson 2: Dividing FractionsUnit 4
Lesson 3: Flour Planner
Lesson 4: Adding and Subtracting DecimalsUnit 5
Lesson 1: Dishing Out Decimals
Lesson 2: Decimal Diagrams and Algorithms
Lesson 5: Multiplying DecimalsUnit 5
Lesson 1: Dishing Out Decimals
Lesson 6: Dividing Whole NumbersUnit 5
Lesson 13: Movie Time
Lesson 7: Dividing DecimalsUnit 5
Lesson 13: Movie Time

Chapter 3: Ratios and Rates

Lesson 1: RatiosUnit 2
Lesson 1: Pizza Maker
Lesson 4: Fruit Lab
Lesson 8: Products and Sums
Take Away (coming soon!)
Lesson 3: Using Ratio TablesUnit 2
Lesson 10: Disaster Preparation
Lesson 4: Graphing Ratio RelationshipsUnit 2
Lesson 10: Disaster Preparation
Lesson 5: Rates and Unit RatesUnit 3
Lesson 6: Soft Serve
Lesson 6: Converting MeasuresUnit 3
Lesson 1: Many Measurements

Chapter 4: Percents

Lesson 1: Percent and FractionsUnit 3
Lesson 9: Lucky Duckies
Lesson 2: Percent and DecimalsUnit 5
Lesson 2: Decimal Diagrams and Algorithms

Chapter 5: Algebraic Expressions and Properties

Lesson 2: Writing ExpressionsUnit 6
Lesson 8: Products and Sums
Take Away (coming soon!)
Lesson 3: Properties of Addition and MultiplicationUnit 6
Lesson 8: Products and Sums
Take Away (coming soon!)
Lesson 4: The Distributive PropertyUnit 6
Lesson 8: Products and Sums
Take Away (coming soon!)

Chapter 6: Equations

Lesson 1: Writing Equations in One VariableUnit 6
Lesson 1: Weight for It

Chapter 7: Area, Surface Area, and Volume

Lesson 1: Areas of ParallelogramsUnit 1
Lesson 3: Exploring Parallelograms
Exploring Parallelograms, Part 2
Lesson 5: Surface Area of prismsUnit 1
Lesson 10: Renata’s Stickers

Chapter 8: Integers, Number Lines, and the Coordinate Plane

Lesson 1: IntegersUnit 7
Lesson 1: Can You Dig It?
Lesson 2: Comparing and Ordering IntegersUnit 7
Lesson 4: Order in the Class
Lesson 3: Rational NumbersUnit 7
Lesson 4: Order in the Class
Lesson 7: Writing and Graphing InequalitiesUnit 7
Lesson 7: Tunnel Travels

Chapter 9: Statistical Measures

Lesson 1: Introduction to StatisticsUnit 8
Lesson 3: Minimum Wage
Lesson 2: MeanUnit 8
Lesson 11: Toy Cars
Lesson 3: Measures of CenterUnit 8
Lesson 11: Toy Cars
Lesson 4: Measures of VariationUnit 8
Lesson 11: Toy Cars

Chapter 10: Data Displays

Lesson 2: HistogramsUnit 8
Lesson 5: The Plot Thickens
Lesson 4: Choosing Appropriate MeasuresUnit 8
Lesson 3: Minimum Wage
Lesson 11: Toy Cars

Grade 7

Chapter 1: Adding and Subtracting Rational Numbers

Big IdeasDesmos Classroom
Lesson 1: Rational NumbersUnit 5
Lesson 1: Floats and Anchors
Lesson 2: Adding Integers
Lesson 4: Subtracting Integers
Unit 5
Lesson 4: Draw Your Own
Lesson 10: Integer Puzzles
Lesson 3: Adding Rational Numbers
Lesson 5: Subtracting Rational Numbers
Unit 5
Lesson 4: Draw Your Own
Lesson 10: Integer Puzzles

Chapter 2: Multiplying and Dividing Rational Numbers

Lesson 1: Multiplying IntegersUnit 5
Lesson 10: Integer Puzzles

Chapter 3: Expressions

Lesson 1: Algebraic ExpressionsUnit 6
Lesson 10: Collect the Squares
Lesson 2: Adding and Subtracting Linear ExpressionsUnit 6
Lesson 10: Collect the Squares
Lesson 3: The Distributive PropertyUnit 6
Lesson 10: Collect the Squares

Chapter 4: Equations and Inequalities

Lesson 1: Solving Equations Using Addition or Subtraction
Lesson 2: Solving Equations Using Multiplication or Division
Unit 6
Lesson 16: Shira the Sheep
Lesson 4: Writing and Graphing InequalitiesUnit 6
Lesson 16: Shira the Sheep
Lesson 5: Solving Inequalities Using Addition or Subtraction
Lesson 6: Solving Inequalities Using Multiplication or Division
Unit 6
Lesson 16: Shira the Sheep
Lesson 7: Solving Two-Step InequalitiesUnit 6
Lesson 16: Shira the Sheep

Chapter 5: Ratios and Proportions

Lesson 1: Ratio and Ratio TablesUnit 2
Lesson 1: Paint
Lesson 3: Identifying Proportional RelationshipsUnit 2
Lesson 6: Two and Two
Lesson 3: Measuring Around
Lesson 5: Graphs of Proportional RelationshipsUnit 2
Lesson 8: Dino Pops

Chapter 6: Percents

Lesson 1: Fraction, Decimals, and PercentsUnit 4
Lesson 1: Mosaics
 
Lesson 4: Percents of Increase and DecreaseUnit 4
Lesson 5: Percent Machines
Lesson 12: Posing Percent Problems (coming soon!)
Lesson 5: Discounts and MarkupsUnit 4
Lesson 5: Percent Machines
Lesson 12: Posing Percent Problems (coming soon!)

Chapter 7: Probability

Chapter 8: Statistics

Lesson 1: Samples and PopulationsUnit 8
Lesson 10: Crab Island
Lesson 2: Using Random Samples to Describe populationsUnit 8 
Lesson 10: Crab Island
Lesson 3: Comparing Populations
Lesson 4: Using Random Samples to Compare Populations
Unit 8
Lesson 10: Crab Island

Chapter 9: Geometric Shapes and Angles

Lesson 1: Circle and CircumferenceUnit 3
Lesson 3: Measuring Around
Lesson 2: Areas of CirclesUnit 3
Lesson 9: Area Challenges
Lesson 5: Finding Unknown Angle MeasuresUnit 7
Lesson 4: Missing Measures

Grade 8

Chapter 1: Equations

Big ideasDesmos Classroom
Lesson 2: Solving Multi-Step EquationsUnit 4
Lesson 5: Equation Roundtable
Lesson 3: Solving Equations with Variables on Both SidesUnit 4
Lesson 5: Equation Roundtable

Chapter 2: Transformations

Chapter 3: Angles and Triangles

Lesson 2: Angles and TrianglesUnit 1
Lesson 12: Puzzling It Out
Lesson 4: Using Similar TrianglesUnit 2
Lesson 1: Sketchy Dilations
Lesson 2: Dilation Mini Golf

Chapter 4: Graphing and Writing Linear Equations

Lesson 1: Graphing Linear EquationsUnit 3 Lesson 4: Flags
Lesson 2: Slope of a LineUnit 3 Lesson 4: Flags
Lesson 3: Graphing Proportional RelationshipsUnit 3
Lesson 1: Turtle Time Trials
Lesson 4: Graphing Linear Equations in Slope-Intercept FormUnit 3
Lesson 4: Flags

Chapter 5: Systems of Linear Equations

Lesson 1: Solving Systems of Linear Equations by GraphingUnit 4
Lesson 11: Make Them Balance
Lesson 12: Line Zapper

Chapter 6: Data Analysis and Displays

Lesson 1: Scatter PlotsUnit 6
Lesson 3: Robots
Lesson 2: Lines of FitUnit 6
Lesson 4: Dapper Cats
Lesson 3: Two-Way TablesUnit 6
Lesson 11: Finding Associations

Chapter 7: Functions

Lesson 1: Relations and FunctionsUnit 5
Lesson 1: Turtle Crossing
Lesson 2: Guess My Rule
Lesson 2: Representations of FunctionsUnit 5
Lesson 5: The Tortoise and the Hare

Chapter 8: Exponents and Scientific Notation

Lesson 1: ExponentsUnit 7
Lesson 3: Power Pairs
Lesson 2: Products of Powers PropertyUnit 7
Lesson 3: Power Pairs
Lesson 6: Scientific Notation
Lesson 7: Operations in Scientific Notation
Unit 7
Lesson 9: Specific and Scientific
Lesson 11: Balance the Scale

Chapter 9: Real Numbers and the Pythagorean Theorem

Lesson 1: Finding Square RootsUnit 8
Lesson 4: Root Down
Lesson 3: Finding Cube RootsUnit 8
Lesson 4: Root Down

Chapter 10: Volume and Similar Solids

Lesson 1: Volumes of CylindersUnit 5
Lesson 11: Cylinders
Lesson 2: Volumes of ConesUnit 5
Lesson 13: Cones

Grade 6

Unit 1: Expressions and Equations: Area, Algebraic Expressions, and Exponents

iReady ClassroomDesmos Math 6–A1
Lesson 1: Find the Area of a ParallelogramUnit 1
Lesson 3: Exploring Parallelograms (Print available) [Free lesson]
Lesson 4: Off the Grid
Lesson 2: Find the Area of Triangles and Other PolygonsUnit 1
Lesson 7: Off the Grid, Part 2
Practice Day 1 (Print available)
Lesson 3: Use Nets to Find Surface AreaUnit 1
Lesson 11: Nothing But Nets (Print available)
Practice Day 2 (Print available)
Lesson 4: Work with Algebraic ExpressionsUnit 6
Lesson 6: Vari-apples
Lesson 5: Write and Evaluate Expressions with ExponentsUnit 6
Lesson 4: Hanging it Up
Lesson 5: Swap and Solve (Print available)
Practice Day 2 (Print available)
Lesson 6: Find Greatest Common Factor and Least Common MultipleUnit 5
Lesson 14: Common Multiples
Lesson 15: Common Factors
Practice Day 2 (Print available)

Unit 2: Decimals and Fractions: Base-Ten Operations, Division with Fractions, and Volume

Unit 3: Ratio Reasoning: Ratio Concepts and Equivalent Ratios

Unit 4: Ratio Reasoning: Unit Rates and Percent

Unit 5: Algebraic Thinking: Equivalent Expressions and Equations with Variables

Unit 6: Positive and Negative Numbers: Absolute Value, Inequalities, and the Coordinate Plane

Lesson 23: Understand Positive and Negative NumbersUnit 7
Lesson 1: Can You Dig It [Free lesson]
Lesson 4: Sub-Zero
Lesson 24: Order Positive and Negative NumbersUnit 7
Lesson 2: Digging Deeper
Lesson 3: Order in the Class (Print available) [Free lesson]
Lesson 25: Understand Absolute ValueUnit 7
Lesson 5: Distance on the Number Line
Practice Day 1 (Print available)
Lesson 26: Write and Graph One-Variable InequalitiesUnit 7
Lesson 6: Tunnel Travels [Free lesson]
Lesson 7: Comparing Weights
Lesson 8: Shira’s Solutions
Lesson 27: Understand the Four-Quadrant Coordinate PlaneUnit 7
Lesson 9: Sand Dollar Search
Lesson 10: The A-maze-ing Coordinate Plane
Lesson 11: Polygon Maker
Practice Day 2 (Print available)
Lesson 28: Solve Problems in the Coordinate PlaneUnit 7
Lesson 12: Graph Telephone
Practice Day 2 (Print available)

Unit 7: Statistical Thinking: Data Distributions and Measures of Center and Variability

Grade 7

Unit 1: Proportional Relationships: Ratios, Rates, and Circles

Unit 2: Numbers and Operations: Add and Subtract Rational Numbers

Unit 3: Numbers and Operations: Multiply and Divide Rational Numbers

Lesson 11: Understand Multiplication with Negative IntegersUnit 5
Lesson 6: Floating in Groups
Lesson 7: Back in Time
Lesson 12: Multiply and Divide with Negative NumbersUnit 5
Lesson 8: Speeding Turtles
Lesson 13: Express Rational Numbers as Terminating or Repeating DecimalsUnit 4
Lesson 13: Decimal Deep Dive (Print available)
Lesson 14: Use the Four Operations with Negative NumbersUnit 5
Lesson 10: Integer Puzzles [Free lesson]
Lesson 13: Solar Panels and More (Print available)
Practice Day 2  (Print available)

Unit 4: Algebraic Thinking: Expressions, Equations, and Inequalities

Unit 5: Proportional Reasoning: Percents and Statistical Samples

Unit 6: Geometry: Solids, Triangles, and Angles

Lesson 25: Solve Problems Involving Area and Surface AreaUnit 7
Lesson 12: Surface Area Strategies (Print available)
Lesson 26: Solve Problems Involving VolumeUnit 7
Lesson 10: Simple Prisms
Lesson 11: More Complicated Prisms
Practice Day 2 (Print available)
Lesson 27: Describe Plane Sections of Three-Dimensional FiguresUnit 7
Lesson 9: Slicing Solids
Lesson 28: Find Unknown Angle MeasuresUnit 7
Lesson 1: Pinwheels
Lesson 2: Friendly Angles [Free lesson]
Lesson 4: Missing Measures (Print available) [Free lesson]
Lesson 29: Draw Plane Figures with Given ConditionsUnit 7
Lesson 6: Is It Enough
Lesson 7: More Than One?
Lesson 8: Can You Draw It? (Print available)
Practice Day 1 (Print available)

Unit 7: Probability: Theoretical Probability, Experimental Probability, and Compound Events

Lesson 30: Understand ProbabilityUnit 8
Lesson 1: How Likely? (Print available) [Free lesson]
Lesson 2: Prob-bear-bilities [Free lesson]
Lesson 31: Solve Problems Involving Experimental ProbabilityUnit 8
Lesson 4: Spin Class
Lesson 5: Is It Fair?
Lesson 32: Solve Problems Involving Probability ModelsUnit 8
Lesson 6: Fair Games
Lesson 33: Solve Problems Involving Compound EventsUnit 8
Lesson 7: Weather or Not
Lesson 8: Simulate It! (Print available)
Practice Day 1 (Print available)

Grade 8

Unit 1: Geometric Figures: Rigid Transformations and Congruence

iReady ClassroomDesmos Math 6–A1
Lesson 1: Understand Rigid Transformations and Their PropertiesUnit 1
Lesson 1: Transformers [Free lesson]
Lesson 2: Spinning, Flipping, Sliding [Free lesson]
Lesson 3: Transformation Golf
Lesson 2: Work with Single Rigid Transformations in the Coordinate PlaneUnit 1
Lesson 4: Moving Day (Print available) [Free lesson]
Lesson 8: No Bending, No Stretching
Lesson 9: Are They Congruent?
Practice Day (Print available)
Lesson 3: Work with Sequences of Transformations and CongruenceUnit 1
Lesson 3: Transformation Golf

Unit 2: Geometric Figures: Transformations, Similarity, and Angle Relationships

Unit 3: Linear Relationships: Slope, Linear Equations, and Systems

Lesson 8: Graph Proportional Relationships and Define SlopeUnit 2
Lesson 9: Water Slide

Unit 3
Lesson 1: Turtle Time Trials [Free lesson]
Lesson 2: Water Tank
Lesson 3: Posters
Lesson 7: Water Cooler
Lesson 8: Landing Planes
Lesson 9: Derive and Graph Linear Equations of the Form y = mx + bUnit 3
Lesson 6: Translations
Lesson 9: Coin Capture
Lesson 10: Solve Linear Equations in One VariableUnit 4
Lesson 1: Number Machines
Lesson 2: Keep It Balanced
Lesson 11: Determine the Number of Solutions to One-Variable EquationsUnit 4
Lesson 7: All, Some, or None
Lesson 8: When Are They the Same?
Lesson 12: Understand Systems of Linear Equations in Two VariablesUnit 4
Lesson 9: On or Off the Line?
Lesson 10: On Both Lines
Lesson 13: Solve Systems of Linear Equations AlgebraicallyUnit 4
Lesson 11: Make Them Balance [Free lesson]
Lesson 12: Line Zapper [Free lesson]
Lesson 14: Represent and Solve Problems with Systems of Linear EquationsUnit 4
Lesson 13: All, Some, or None? Part 2
Lesson 14: Strategic Solving, Part 2 (Print available)
Practice Day 2 (Print available)

Unit 4: Functions: Linear and Nonlinear Relationships

Lesson 15: Understand FunctionsUnit 5
Lesson 1: Turtle Crossing [Free lesson]
Lesson 2: Guess My Rule [Free lesson]
Lesson 3: Function or Not?
Lesson 16: Use Functions to Model Linear RelationshipsUnit 5
Lesson 4: Window Frames
Lesson 5: The Tortoise and the Hare [Free lesson]
Lesson 6: Graphing Stories
Lesson 17: Compare Different Representations of Functions
Lesson 18: Analyze Functional Relationships Qualitatively
Unit 5
Lesson 7: Feel the Burn (Print available) [Free lesson]

Unit 5: Integer Exponents: Properties and Scientific Notation

Unit 6: Real Numbers: Rational Numbers, Irrational Numbers, and the Pythagorean Theorem

Lesson 23: Find Square Roots and Cube Roots to Solve ProblemsUnit 8
Lesson 2: From Squares to Roots
Lesson 3: Between Squares
Lesson 4: Root Down [Free lesson]
Lesson 5: Filling Cubes
Lesson 24: Express Rational Numbers as Fractions and DecimalsUnit 8
Lesson 12: Fractions to Decimals
Lesson 13: Decimals to Fractions
Lesson 25: Find Rational Approximations of Irrational NumbersUnit 8
Lesson 10: Taco Truck [Free lesson]
Lesson 26: Understand the Pythagorean Theorem and its ConverseUnit 8
Lesson 6: The Pythagorean Theorem
Lesson 27: Apply the Pythagorean TheoremUnit 8
Lesson 7: Pictures to Prove It
Lesson 8: Triangle-Tracing Turtle [Free lesson]
Lesson 9: Make It Right
Lesson 11: Pond Hopper
Practice Day 2 (Print available)
Lesson 28: Solve Problems with Volumes of Cylinders, Cones, and SpheresLesson 10: Volume Lab
Lesson 11: Cylinders [Free lesson]
Lesson 12: Scaling Cylinders
Lesson 13: Cones [Free lesson]
Lesson 14: Missing Dimensions (Print available)
Lesson 15: Spheres

Unit 7: Statistics: Two-Variable Data and Fitting a Linear Model

Lesson 29: Analyze Scatter Plots and Fit a Linear Model to DataUnit 6
Lesson 3: Robots [Free lesson]
Lesson 4: Dapper Cats [Free lesson]
Practice Day 1 (Print available) [Free lesson]
Lesson 5: Fit Fight [Free lesson]
Lesson 30: Write and Analyze an Equation for Fitting a Linear Model to DataUnit 6
Lesson 6: Interpreting Slopes
Lesson 7: Scatter Plot CityLesson 8: Animal Brains
Practice Day 2 (Print available)
Lesson 31: Understand Two-Way TablesUnit 6
Lesson 9: Tasty Fruit
Lesson 10: Finding Associations [Free lesson]
Lesson 32: Construct and Interpret Two-Way TablesUnit 6
Lesson 11: Federal Budgets
Practice Day 3

At Amplify, we believe Pennsylvania students and teachers deserve high quality instructional materials.

That’s why we partner with schools across the Keystone State to meet their core curriculum, assessment, and intervention goals. With solutions grounded in research and evidence-based practices, Amplify is leading the way with rigorous and relevant learning experiences.

Select a program below to learn more.

Illustration of Pennsylvania featuring cows, a barn, city skyline, groundhog, pretzel, chocolate bar, Liberty Bell, and a train on a green landscape.
Group of diverse middle school students working on laptops and discussing in classroom.

Amplify Desmos Math (K–12)

Amplify Desmos Math is a comprehensive K–12 math suite that has everything in one place: benchmark and progress monitoring, core instruction, integrated personal learning, embedded intervention, and more. This structured, problem-based approach builds on students’ curiosity while strategically developing math fluency and lasting grade-level understanding. The program delivers:

  • Engaging, discourse-rich math lessons that fuel classroom conversations and drive the learning process.
  • Comprehensive integrated resources, including print and digital, along with manipulatives and Centers Kits in K–5.
  • Real-time insights, data, and reporting that inform instruction and celebrate student thinking.

Flexible, social problem-solving experiences

Digital lessons should be able to bring student thinking to the surface and spark productive discussions. We bring this vision to life with interactive social, collaborative lessons powered by Desmos technology.

A teacher using a tablet interacts with a young student in a classroom, with educational posters in the background.

mCLASS early literacy assessment and intervention (K–8)

Effective universal screening and progress monitoring means that every student is an individual and targeted instruction should become a reality, not a dream. 

mCLASS® is the gold-standard K–8 assessment and intervention suite for early literacy that helps every child learn to read confidently.

  • Universal screening presented in one-minute measures shows where your students are, who is at risk, and where to target instruction.
  • Dyslexia screening identifies students who are at risk for reading difficulties without needing an additional assessment system
  • Elimination of manual assessment process gives you instant results and clear next steps for each student.
  • Progress monitoring allows you to quickly adjust to student needs, based on how they are responding to instruction.

The power of mCLASS

Based on decades of leading literacy research, mCLASS lets you know exactly which part of a skill a student is struggling with, then gives you effective next steps and lesson plans.

Watch how mCLASS can help teachers:

  • Save hours of time.
  • Catch at-risk students earlier.
  • Connect data to personalized learning.
Several students listening attentively

Amplify Core Knowledge Language Arts (PreK–5)

High-quality, content-rich instruction should combine multisensory phonics instruction with knowledge-rich texts and interactive multimedia resources.

Built on the Science of Reading, Amplify Core Knowledge Language Arts® (CKLA) sequences deep content knowledge with research-based foundational skills.

  • Explicit, systematic foundational skills lessons are easy to teach and exciting to learn.
  • Deep knowledge-building across units and grades helps access complex text, so real comprehension can happen.
  • Rich, authentic texts with engaging topics and immersive learning support students wherever they are.

Students love CKLA. But don’t just take our word for it.

Amplify CKLA is impactful for teachers, administrators, families, and most of all—students! Hear what students think about Amplify CKLA.

A young girl focuses on a laptop with a stack of books, a colorful creature, and autumn leaves in a stylized graphic.

Boost Reading (K–5)

Authentic personalized learning should be developmentally appropriate, grounded in research, and truly adaptive.

Boost Reading is a personalized, digital supplemental reading tool for grades K–5 featuring:

  • Research-based approach to critical literacy skill development that is proven to accelerate reading growth in just 30 minutes per week.
  • Captivating storylines and games with powerful individualized reading instruction and practice to bridge learning gaps while learning independently.
  • Actionable data that offers deeper insights into student performance and needs.

Boost Reading keeps all students playing and motivated to learn.

Boost Reading includes age-appropriate storylines that excite students’ curiosity. Regardless of their reading ability, students are placed in a year-long storyline that is developmentally appropriate for them. As students grow, so do the immersive worlds around them.

A student reading "Summer of the Mariposas"

Amplify ELA (6–8)

Amplify ELA is the only program truly designed to support middle school students at this critical developmental moment. We ensure that skills are taught, standards are covered, and the test is prepped – all while bringing texts to life and differentiating instruction.

  • Rich, complex text and research-based instruction at the center of every lesson to build the vocabulary, knowledge, and skills needed in middle school, high school, and beyond.
  • Multiple points of entry and differentiated support allow every student, regardless of fluency or ability, to engage deeply in the same curriculum.
  • Immersive digital apps that offer engaging interactive experiences where students work with key skills in brand new ways.

We are the program for middle schoolers.

Let’s face it– middle school students are different from high school students. That’s why they deserve a program of their own.

A futuristic cityscape with a figure in a red hood looking at a large digital billboard displaying a "wanted for unlawful reading" alert.

Boost Close Reading (6–8)

Middle school students need to exercise their close reading skills in order to deeply comprehend across the curriculum. Based on a riveting storyline designed especially for middle schoolers, Boost Close Reading helps students find deeper meaning in a digital journey like no other.

  • Inspire engagement via high-interest storytelling, choose-your-own adventure experiences, and skill-building features.
  • Explore topics like claim, evidence, reasoning, word choice, and tone in both literary and informational texts.
  • Detailed teacher dashboards display student progress, performance, and usage information, offering easy-to-access insights on areas of strength and weakness.

Fight the machines and save the world.

Before the machines took over, humans could fend for themselves. Now humanity is trapped. And their only hope? You.

A badge for EdReports Review Year 2023, two students at a computer, two students discussing with a tablet, and an educational diagram of a spider on a screen.

Amplify Science Pennsylvania (K–8)

Amplify Science Pennsylvania is a proven K–8 curriculum that develops critical thinkers who are prepared to solve problems in their communities and beyond. It features:

  • Phenomena-based exploration and three-dimensional learning where students take on the roles of scientists and engineers to solve real-world problems.
  • Immersive hands-on activities that teach students how to gather evidence, ask questions, and develop and defend claims.
  • Literacy-rich science instruction that enables young scientists to become excellent readers, writers, and speakers.
  • Custom lessons specifically designed to meet Pennsylvania’s STEELS standards.
Bar chart comparing science content knowledge: Do-Talk-Read-Write approach at 51.5% and Business-as-usual approach at 36.6%.

Do, Talk, Read, Write students outperform their peers.

Bar graph comparing middle school science vocabulary, showing 48.6% for the Do-Talk-Read-Write approach with Amplify Science and 22.5% for the Business-as-usual approach.

English language learners who use Do, Talk, Read, Write outperform their ELL peers.

Bar chart compares middle school science learning progression outcomes before and after a unit, showing similar distributions with the highest value at category 3 in both cases, illustrating the impact of Amplify Science instruction.

Do, Talk, Read, Write increases learning outcomes.

Get Support

Get support

Do you use already use an Amplify program in Pennsylvania? Our support team is here to provide technical and instructional support by phone, live chat, or email.

Get help now

Contact us

A woman with long brown hair and glasses wearing a light blue sweater, smiling at the camera against a gray background.

Julie Couch

District Enrollment <1800 students

A woman with long blonde hair and blue eyes is smiling at the camera, wearing a black top, in a well-lit indoor setting.

Jen Mee

Western PA

A smiling person with shoulder-length gray hair, wearing a peach-colored scarf and a gray sweater, stands against a plain white background. This image captures the essence of Pennsylvania teachers who are dedicated to enriching Science programs for elementary students.

Monica Vincent

Southeast PA

A man with curly brown hair and a beard, smiling broadly, wearing a suit, dress shirt, and floral tie, standing outdoors with trees and grass in the background.

Keenan Zambelli

Northeast & Central PA

End-of-year research brief: Literacy gains among K–3 students show some, but not enough, progress

BROOKLYN, NY (July 20, 2023) — Today, Amplify, a publisher of next-generation curriculum and assessment programs, shared a research brief on national end-of-school-year (EOY) reading data for K–3 students. The data reveal that while schools across the country have made progress in reading scores among earlier elementary grades (K–2), gains among third graders remains comparatively slow.

According to newly released EOY data from the 2022–23 school year, students in grades K–2 demonstrated progress compared to the 2021–22 school years, with the greatest gains among Black and Hispanic students. At the same time, third graders exhibited the least improvement from two years ago and no improvement from the prior year’s third grade cohort. The slower improvements in grade 3 suggest a persistent impact on the cohort of students most affected by lost instructional time during the pandemic.

Learning to read by the end of third grade is an important indicator of future academic success. Susan Lambert, chief academic officer of elementary humanities at Amplify, says the data demonstrates how literacy rates in the United States remain a crisis today, with too many students urgently needing support. “We need to help this generation of young students get on track in reading,” Lambert says. “The struggles of students who fall behind will not go away on their own. The older these students become, the longer it will take them to catch up.”

Despite some progress, America still faces an early literacy crisis. To best support educators, Amplify recommends that schools and districts invest in reliable universal screeners, high-quality core curriculum aligned with the Science of Reading, evidence-based interventions, and ongoing professional development.

The report compares mCLASS® with DIBELS® 8th Edition benchmark data from the 2019–20, 2020–21, 2021–22, and 2022–23 school years. Approximately 300,000 students from a matched set of 1,400 schools across 43 states are represented from the 2 million students nationwide assessed with mCLASS. The schools in the source data are slightly more likely to be in large urban metropolitan areas than the nation overall.

The data was collected using the mCLASS platform, which automates the data collection of Dynamic Indicators of Basic Early Literacy Skills (DIBELS). DIBELS is a widely-used series of short tests developed by the University of Oregon that assess K–8 literacy. It is an observational assessment collected by teachers interacting with students one-on-one, either live or over video. DIBELS is typically administered three times a year (beginning, middle, and end of year) and is used to identify reading difficulty, monitor progress, and inform instruction, especially for struggling readers.

About Amplify
A pioneer in K–12 education since 2000, Amplify is leading the way in next-generation curriculum and assessment. Our captivating core and supplemental programs in literacy, math, and science engage all students in rigorous learning and inspire them to think deeply, creatively, and for themselves. Our formative assessment products turn data into practical instructional support to help all students build a strong foundation in early reading and math. All of our programs provide teachers with powerful tools that help them understand and respond to the needs of every student. Today, Amplify reaches more than 10 million students in all 50 states. To learn more, visit amplify.com.


Media Contact

Kristine Frech
media@amplify.com

Welcome, Florida middle school educators!

Amplify ELA Florida is the program built for Florida middle school teachers and students. We designed the program to help ensure the B.E.S.T standards are covered; the skills are taught; the test is prepped for; and your students are scaffolded and encouraged. We want you to spend your time bringing the text to life, making the classroom hum, and letting every student know you are paying attention to their growth.

Amplify ELA Florida Program Guide

Illustration of a ship with diverse elements including human figures, nature motifs, and space elements on a black background.
A teacher assists two students with a laptop in a classroom, one wearing a hijab, conveying a supportive educational environment.

Instruction matters

Florida’s new standards have been crafted to give your students the B.E.S.T. Amplify ELA Florida’s lessons explore the most compelling aspect of a text and target the standards that best support that analysis through reading, writing, and communication. These key standards are identified as the lesson’s Spotlight benchmark.  Strategic connections are attained in the program through:

  • Florida model texts including rich literature and compelling non-fiction, taught in engaging new ways for today’s learners.
  • Benchmark stacks that build connections within lessons and across units.
  • Foundational instruction that targets key standards and multiple learning modes.
  • Writing that builds directly from reading complex text and is evaluated by Amplify’s Automated Writing Evaluation (AWE).
  • Reading with the B.E.S.T. Modules have been built to guide teachers and students as they begin to work with Florida’s new reading standards, providing an introduction to each grade-level B.E.S.T. Reading Benchmark. (Example module: Grade 6, Understanding Rhetoric)

Knowledge matters

Texts in the Amplify ELA Florida Edition curriculum cover a wide range of topics, themes, and genres with differentiated supports that ensure that all students can work through each reading and lesson. Taken as a whole, the texts show students a diverse picture of the world and help foster a lifelong love of reading. Comprehension develops as students engage with literary and informational text selections that are complex, rich, and meaningful. 

Texts were selected for Amplify ELA Florida Edition using the following criteria: 

  • Text complexity as defined by qualitative, quantitative, and reader and task measurements as required by the B.E.S.T. Standards and the Amplify Text Complexity Index
  • Balance of literary and informational texts
  • Varied representation of genres: novels, plays, poetry, biographies, and other full-length texts
  • Diverse cultures, perspectives, and authors
  • Engaging texts that extend learning and support students as they build knowledge
  • Grade-appropriate texts, with scaffolding and compelling activities to support student engagement with 100% authentic texts
  • A library with more than 700 complete books, both classic and contemporary, encompassing a wide range of genres, topics, and cultural perspectives
Collage featuring a violinist with glowing eyes, a man with a background of space, a robotic arm, a tiger on a grassy knoll, and a city skyline under a starry sky.

Curriculum matters

Amplify ELA Florida is a blended curriculum designed specifically for grades 6–8. The heart of every lesson is the text. Each grade includes six units centered on literary or informational texts, delivered in several forms of media. Your classroom will also benefit from two or three immersive, project-based experiences and a dedicated Story Writing unit.

  • Full B.E.S.T. coverage: Standards are clearly labeled in each lesson, so teachers can save time planning and get back to what they love: teaching. Also included are Benchmark Modules that support teachers’ and students’ introduction to the new standards for Florida.
  • Five levels of differentiation: Based on each student’s needs and the performance measures within Amplify ELA reports, a teacher can choose the differentiation level that’s the right fit for everyone.
  • Embedded Assessments: Teachers benefit from uninterrupted instructional time and a continuously updated picture of each student’s progress with key skills and standards.
  • Powerful feedback tools: Comprehensive tools help teachers maximize both the quantity and quality of feedback.
  • Robust reporting: Our reporting app offers information on student progress to help inform instructional decisions.

All in one place: Embedded teacher support, differentiation tools, student data, text, and other curriculum features—they’re all right there.

Materials

Amplify ELA Florida Edition is a blended curriculum that seamlessly integrates print and digital resources to be used in any learning environment. The resources are designed to facilitate instruction for planning, teaching, learning, and assessment.

Student materials

Available digitally and in print, the student materials guide middle schoolers through complex texts and writing with the following:

  • Student Edition will engage students with high-quality narrative and informational texts.
  • Digital experience will provide videos, a library of more than 700 texts, audio supports, and other online experiences that capture their attention.
A laptop displays a web page titled "read like a movie director, part 1" from amplify ela, featuring text and an eyeball image under the lesson tab.
A laptop displaying a webpage from "amplify ela" featuring the title "brain science" and various educational topics alongside an illustrated collage of diverse human figures.

Teacher materials

Available digitally and in print, the Teacher Edition contains all of the information teachers need to facilitate classroom instruction, including:

  • From detailed lesson plans.
  • Video teacher tips embedded in the lesson.
  • B.E.S.T. standards alignment and assessments including exit tickets.
  • Real-time differentiation strategies.
  • Clarify and Compare lessons.
  • Robust reporting.

Professional learning

Amplify employs a national cohort of more than 50 ELA facilitators, all of whom have experience as former classroom teachers and many of whom are former school and/or district leaders. Our professional learning team has decades of experience working with large districts across the nation. Amplify has experience supporting district launches over multiple years and has partnered with districts of all sizes nationwide. We partner deeply with districts and tailor professional learning to their unique needs.

Florida ELA Implementation

Two women are seated at a desk, smiling and working together on a project with a laptop and notebook in an office setting.

Slow and steady progress at middle-of-year highlights the urgency of data-driven instruction.

Slow and steady progress at middle-of-year highlights the urgency of data-driven instruction.

To view this protected page, enter the password below:


K–5 personalized reading curriculum to accelerate literacy growth in your classroom

Boost Reading Texas helps K–5 educators meet the needs of every reader with personalized literacy instruction based in the Science of Teaching Reading. Our efficacy data, measured by DIBELS® 8th Edition, shows that Boost Reading helped 26% more students reach benchmark than those not using the program. This Amplify reading curriculum fits into any learning model and provides actionable growth insights along the way.

A young girl wearing headphones uses a laptop. Illustrated trees, clouds, and a bird are in the background. Informational badges about reading science and evidence levels are displayed.

Evidence-based personalized instruction

Boost Reading Texas is a student-led supplemental reading curriculum that provides additional time to support other students. It reinforces instruction across all tiers through true differentiation of skill development. It’s your digital assistant in literacy instruction—extending core instruction, addressing remediation needs, and constantly adapting activities to help every reader flourish.

“Your team has taken a weight off my shoulders and I am so grateful and can’t thank you enough! My biggest concern during this time was how can I keep pushing my readers at their level—and giving them what they need—and Boost Reading solved that.”

Jeanine

2nd-grade teacher, Chicago, IL

“My students love the program, and they don’t even realize they are learning some tough concepts. Their reading scores are improving even since the beginning of the year.”

Amber

Junior High ELA teacher, California

“This program is extremely engaging and interactive for each student. They begged to get on Boost Reading and they cried when it was time to log off! This program is a great addition to our curriculum.”

Brittany

2nd grade teacher, Utah

Our approach

Proven efficacy

Did you know that you can supercharge reading growth with Boost Reading Texas? Texas students using Boost Reading Texas are showing phenomenal growth…and we have the data to prove it!

Bar chart compares percentage growth above or well above average from BOY to MOY across grades K–5 between students who used and did not use Amplify Reading.
Three labeled graphics with Texas icons read: "Amplify ELAR TEXAS," "Boost Reading TEXAS," and "mCLASS TEXAS," each in black and orange text.

Instructional cohesion across all tiers

Amplify’s comprehensive early literacy suite—comprising Amplify ELAR Texas core instructionmCLASS Texas assessment and intervention, and Boost Reading Texas personalized practice—provides seamless alignment and a strong Science of Teaching Reading foundation for a Multi-Tiered System of Supports within your classroom. For Amplify ELAR Texas students who start the year below benchmark reading levels, Boost Reading Texas increases the likelihood of meeting benchmark by 34% by end of year, compared to non-Boost Reading users.

Targeted, systematic reading practice for all

The highly adaptive technology creates individual skill maps for each student—whether they’re reading below, at, or above grade level—providing simultaneous remediation and advancement in different skill domains. The program is an effective component of your classroom’s remediation and intervention solutions, with explicit instruction for all students, including those with dyslexia or in special education classes.

A graphic showing the adaptivity of Boost Reading.
Cartoon dog in a soccer outfit kicks a soccer ball labeled "ma" toward a goal, with speech bubbles saying "¡Hola!" and "Hello!" and a note about the Science of Teaching Reading.

Closing the gap for K–5 multilingual/English learners

Boost Reading Texas’ Spanish literacy partner, Boost Lectura Texas, supports multilingual/English learners (ML/ELs) learning to read in their native language. When used together, the two programs drive literacy growth in English and Spanish and provide teachers with side-by-side reporting on skills progression in both languages.

guide icon

Boost Reading efficacy study

Accelerating literacy growth

Download now

What’s included

A diagram showing strategies for teaching phonemic awareness, with photos of two children and labeled methods such as "Blend onset rime," "Isolate sounds," and "Segment phonemes.

Next-generation technology

Boost Reading Texas is constantly adapting to tailor instruction and scaffold foundational skills for students, building proficiency one engaging activity at a time. Students will never get stuck in static practice activities.

Comprehensive skill coverage

The scope and sequence is based on the Science of Teaching Reading and includes explicit instruction in phonics, phonological awareness, comprehension, vocabulary, and all skills critical to fluent and confident reading.

Diagram illustrating the interplay between language comprehension and word recognition in reading, as seen in early literacy stages. It highlights pathways through knowledge, vocabulary, and sentence understanding, reflecting principles from the CKLA reading program.
Screenshot of a student performance dashboard featuring benchmark data, reading proficiency, assessment status, and a graph of decoding skills progress over time—ideal for tracking growth with a K–5 personalized reading curriculum.

Benchmark and growth assessments

Built-in benchmark assessments measure student proficiency at beginning-, middle-, and end-of-year, and Curioso Skill Scans measure monthly growth in students using the program without interrupting engagement.

Easy-to-use growth and proficiency reports

Embedded assessments give teachers actionable insights into students’ reading journeys. Visibility into performance gives teachers peace of mind that students are making meaningful progress in their literacy development.

Boost Reading Teacher Dashboard image shows reporting on student performance from many angles.
A dashboard displays usage data for Reading K–5 Reports, showing a line graph of active users per month under the "Admin Reports Demo District" header.

Administrator and caregiver reports

Administrators and caregivers are welcomed into the student reading journey with data on program usage, reading progress, and skill mastery.

Research-based activities to reinforce skills

Boost Reading Texas alerts educators to trouble spots students encounter in their skill development and offers additional K–5 literacy resources and lessons for teachers to address and fortify reading skills.

Digital interface of a supplemental reading curriculum displaying a student's "trouble spots" in learning, highlighting areas needing focus on "key ideas & details" with activities suggested.
Tech & Learning Awards of Excellence 2023 Back to School badge for Primary Education Winner.

Boost Reading is a proud winner of the Tech & Learning Awards of Excellence: Best for Back to School 2023.

Learn more

Explore more programs based on the Science of Teaching Reading.

Learn more about our related Texas programs at texas.amplify.com.

Inspiring the next generation of Massachusetts scientists, engineers, and curious citizens

Amplify Science is an engaging new core curriculum designed for three-dimensional, phenomena-based learning.

Collage of four images: a jungle illustration with a giraffe, students using computers, a boy studying with classmates, and an animated hillside with kites flying.

A powerful partnership

Amplify Science was developed by the science education experts at UC Berkeley’s Lawrence Hall of Science and the digital learning team at Amplify. This partnership extends to 2032, allowing us to continuously improve our program and provide our customers with the most up-to-date enhancements, free of charge. Get a glimpse at our latest back-to-school updates here.

Instructional model

The Amplify Science program is rooted in the proven, research-based pedagogy of Do, Talk, Read, Write, Visualize. Here’s how each element works:

Three blue panels describing educational activities: "hands-on science" with lab experiments, "discuss" with collaborative learning, and "read" with literacy in science articles.

Phenomena-based approach

In each Amplify Science unit, students take on the roles of scientists or engineers in order to investigate a real-world problem. Students work to define the problem and collect and make sense of evidence. Once the context is clear, students collect evidence from multiple sources and through a variety of modalities. At the end of the unit, students are presented with a brand new problem, giving them an opportunity to apply what they’ve learned over the course of the unit to a new context. This represents a shift from asking students to learn about science to supporting students in figuring out the science.

Flowchart of a learning unit divided into four chapters, showing stages of student engagement from introduction to application, with assessments indicated at various points.

Resources to support your review

Scope and Sequence

GRADE

Kindergarten

UNITS

  • Needs of Plants and Animals
  • Pushes and Pulls
  • Sunlight and Water

Grade 1

  • Needs of Plants and Animals
  • Pushes and Pulls
  • Sunlight and Water

Grade 2

  • Plant and Animal Relationships
  • Properties of Materials
  • Changing Landforms

Grade 3

  • Balancing Forces
  • Inheritance and Traits
  • Environments and Survival
  • Weather and Climate

Grade 4

  • Energy Conversions
  • Vision and Light
  • Earth’s Features
  • Waves, Energy, and Information

Grade 5

  • Patterns of Earth and Sky
  • Modeling Matter
  • The Earth System
  • Ecosystem Restoration

Flexible implementation

One of the key features of Amplify Science is the flexibility that it offers. We give students authentic opportunities to experience the full breadth of what it means to be a scientist or engineer. Just as scientists gather evidence from many types of sources, so do students in our program. Like scientists, students gather evidence not just from physical models, but also from digital models, texts, videos, photographs, maps, data sets, and even their peers!
Simply put, real scientists don’t just get messy—they read, write, analyze, hypothesize, model, test, and communicate with purpose, too.

Illustration of the indirect effects of overfishing on northern benguela jelly populations displayed on a laptop screen.

Student Books
Beginning and young readers have unique developmental needs, and science instruction should support these students in reading more independently as they progress through sections of content, the school year, and each grade. One way Amplify Science meets these needs is by strategically deploying different modes of reading throughout each unit: Read-Aloud, Shared Reading, and Partner Reading.

A collage of various educational book covers related to science and math, featuring illustrated themes like sports, nature, and energy.

Student Investigation Notebooks

Available for every unit, the Student Investigation Notebooks provide space for students to:

  • record data.
  • reflect on ideas from texts and investigations.
  • construct explanations and arguments.
Collection of educational books from 'amplify science' on topics including ocean atmosphere, matter and energy ecosystems, and insect interactions, displayed in various angles.

Digital student experience

Students access the digital simulations and Modeling Tools, as well as lesson activities and assessments, through the digital student experience. Students can interact with the digital student experience as they:

  • conduct hands-on investigations.
  • engage in Active Reading and writing activities.
  • participate in discussions.
  • record observations.
  • craft end-of-unit scientific arguments.

Dive into a quick example of our powerful simulations

Grades K–5 simulation

A digital illustration showcasing a laptop and a tablet displaying complex data analysis software interfaces with graphs and heatmaps.

Hands-on materials kits

Hands-on learning is at the heart of Amplify Science and is integrated
into every unit. Students actively take on the roles of scientists and engineers as they gather evidence, think critically, solve problems, and develop and defend claims about the world around them.

Check out this 2-minute video to see an Amplify Science hands-on investigation in action.

Each unit kit contains:

  • consumable and non-consumable hands-on materials.
  • print classroom display materials.
  • premium print materials for student use (sorting cards, maps, etc.).
A perforated rectangular board, three small containers with different powders, a black battery holder with red wires, and three colored alligator clips are arranged on a white background.

Teaching support

Available digitally and in print, the Teacher’s Guides contain all of the information teachers need to facilitate classroom instruction, including:

  • detailed lesson plans.
  • unit and chapter overview documentation.
  • differentiation strategies.
  • standards alignments.
  • in-context professional development.
A laptop displaying the Geology on Mars webpage sits beside a book titled "Geology on Mars," both featuring the same cover image of Mars and a spacecraft, perfect for enhancing three-dimensional learning in any science classroom.

Massachusetts Academic Standards in Science coverage

Amplify Science was designed from the ground up to meet the NGSS, a set of standards that closely align with the Massachusetts Learning Standards for Science coverage. Most grade levels’ respective set of Amplify Science units therefore address the necessary MASS (see correlation). 

For grades K, 1, 2, 3, and 5, teachers should plan to also use the resources provided in the sections below to achieve full coverage of the appropriate standards before their students move on to the next grade band. Organized by grade level, each section outlines:

  • companion lesson materials that were written to support 100% alignment to the Massachusetts Learning Standards for Science coverage when used with the core Amplify Science units for the grade level
  • the standard being addressed with each companion lesson; and
  • the recommended placement of each companion lesson within a specific Amplify Science unit

Standard: K-PS1-1(MA). Investigate and communicate the idea that different kinds of materials can be solid or liquid depending on temperature.

Recommended placement: Following Lesson 5.6 of Sunlight and Weather

Resources: After students finish reflecting on their unit-long exploration of energy and temperature, play and discuss this read-aloud video of the student book Can you Change it Back?, which is featured in the grade 2 unit Properties of Materials. You might also consider borrowing the physical books from a grade 2 colleague’s Properties of Materials kit and reading it as a class instead of or in addition to playing the video.

Using the book, you will introduce students to the idea that heating and cooling can cause changes to materials. In the book, students are presented with a variety of materials and asked to predict whether a certain change caused by heating or cooling is reversible or irreversible.

Companion lesson: “Seasonal Changes”

Standard: 1-ESS1-2– Analyze provided data to identify relationships among seasonal patterns of change, including relative sunrise and sunset time changes, seasonal temperature and rainfall or snowfall patterns, and seasonal changes to the environment.

Recommended placement: Following Lesson 5.1 of Spinning Earth

Resources: Season Changes Classroom Slides and Student Sheet

Companion lesson: “Properties and Weight”

Standard: 2-PS1-3– Analyze a variety of evidence to conclude that when a chunk of material is cut or broken into pieces, each piece is still the same material and, however small each piece is, has weight. Show that the material properties of a small set of pieces do not change when the pieces are used to build larger objects.

Recommended placement: Following Lesson 4.4 of Properties of Materials.

Resources: Weight and Properties Classroom SlidesResources, and Student Sheet

Companion lesson 1: Extinct Insects

Standard: 3-LS4-1: Use fossils to describe types of organisms and their environments that existed long ago and compare those to living organisms and their environments. Recognize that most kinds of plants and animals that once lived on Earth are no longer found anywhere.

Recommended placement: Following Lesson 2.3 of Environments and Survival

Resources: Extinct Insects Classroom Slides and Student Sheet

Companion lesson 2: Friction

Standard: 3-PS2-1: Provide evidence to explain the effect of multiple forces, including friction, on an object. Include balanced forces that do not change the motion of the object and unbalanced forces that do change the motion of the object.

Recommended placement: Following Lesson 1.1 of Balancing Forces

Resources: Friction Classroom SlidesResources, and Student Sheet

Companion lesson 1: Composters

Standard: 5-LS2-2(MA)– Compare at least two designs for a composter to determine which is most likely to encourage decomposition of materials.

Recommended placement: Following Lesson 3.7 of Ecosystem Restoration

Resources: Composters Classroom Slides and Student Sheet

Companion lesson 2: Properties of Materials

Standard: 5-PS1-3 (MA) – Make observations and measurements of substances to describe characteristic properties of each, including color, hardness, reflectivity, electrical conductivity, thermal conductivity, response to magnetic forces, and solubility.

Recommended placement: Following Lesson 1.3 of Modeling Matter

Resources: Properties of Materials Classroom SlidesResourcesArticlesCopymaster, and Student Sheet

Companion lesson 3: Water Filters

Standard: 5-ESS3-2(MA)– Test a simple system designed to filter particulates out of water and propose one change to the design to improve it.

Recommended placement: Following Lesson 5.6 of The Earth System

Resources: Water Filters Classroom Slides and Student Sheet

Benchmark Assessments

Amplify’s Benchmark Assessments are designed to help teachers measure student progress toward the three dimensions—Disciplinary Core Ideas (DCIs), Science and Engineering Practices (SEPs), and Crosscutting Concepts(CCCs)—and performance expectations (PEs) of the NGSS. The assessments provide important insight into how students are progressing toward mastery of different standards ahead of high-stakes, end-of-year assessments.

The Benchmark Assessments are built to be delivered after specific units in the recommended Amplify Science scope and sequence.* They are given three or four times per year, depending on the grade level. The benchmarks are intended to show progress at various points in time across a school year, and are therefore not summative in nature. Digital items and item clusters are also tagged to specific NGSS standards, allowing customization to align with other course sequences. The assessments are available via the following platforms:

Print
PDF files: For administering Benchmark Assessments on paper

Digital platforms

  • Illuminate
  • SchoolCity
  • Otus
  • QTI (“Question and Test Interoperability”) files
    Not sure whether QTI files are compatible with your assessment platform? Contact your school IT or assessment platform representative for more information.
    Please note that Amplify is able to provide access to the QTI files themselves, but is not able to support the integration process. Your assessment platform provider should be able to assist with QTI file integration.

Remote and hybrid learning support

A child sits at a desk using a laptop. Next to the desk is a bookshelf with books, a fishbowl, and a soccer ball.

See an example of our remote and hybrid learning support below:

Intended to make extended remote and hybrid learning easier, Amplify Science @Home includes two useful options for continuing instruction: @Home Videos and @Home Units.
Amplify Science @Home Videos are recordings of real Amplify Science teachers teaching the lessons. For those teachers who are unable to meet synchronously with their students, the recorded lessons are a great way to keep their students on track and engaged with Amplify Science while at home.

Amplify Science @Home Units are modified versions of Amplify Science units, strategically designed to highlight key activities from the program. The @Home Units take significantly less instructional time than the complete Amplify Science program and allow students to engage with science at home. Each @Home unit includes:

  • Teacher overviews explaining how to use the materials, including suggestions for enhancing the @Home Units if synchronous learning or in-class time with students is available
  • Overviews to send home to families

Student materials will be available in two formats:

  • @Home Slides (PDF/PPT) + Student Sheets (PDF) for students with access to technology at home
  • Downloadable @Home Packets (PDF) for students without access to technology at home

Download the remote and hybrid learning guide

Explore the digital Teacher’s Guide

To familiarize yourself with navigation of the digital Teacher’s Guide, watch our navigational guide videos:

Grades K–5:

Looking for help?

Powerful (and free!) pedagogical support

Amplify provides a unique kind of support you won’t find from other publishers. We’ve developed an educational support team of former teachers and administrators who provide pedagogical support for every Amplify curriculum, assessment, and intervention program. This service is completely free for all educators who are using our programs and includes:

  • Guidance for developing lesson plans and intervention plans.
  • Information on where to locate standards and other planning materials.
  • Recommendations and tips for day-to-day teaching with Amplify programs.
  • Support with administering and interpreting assessment data and more.

Timely technical and program support

Our technical and program support is included and available Monday through Friday, from 7 a.m. to 7 p.m. ET, through a variety of channels, including a live chat program that enables teachers to get immediate help in the middle of the school day.

Ready to dive in?

Contact your Massachusetts representative:

Tracy Yefimenko
518-466-3497
tyefimenko@amplify.com

Inspiring the next generation of Florida scientists, engineers, and curious citizens

Amplify Science Florida is a brand-new blended science curriculum for grades 6-8 that meets 100 percent of the Next Generation Sunshine State Standards for Science.

The national edition of Amplify Science for middle school was recently rated all green by EdReports. Read the review on EdReports.

  • Un rover robótico está colocado en un terreno arenoso y lleno de rocas bajo un cielo brumoso, dejando huellas de neumáticos tras él.
  • Dos niños con gafas de seguridad participan en una actividad científica; uno sostiene una taza de líquido y hace gestos mientras el otro toma notas con un lápiz.
  • Dos niños están sentados en una mesa redonda en un salón de clases, mirando juntos la pantalla de una computadora portátil. Ambos parecen comprometidos y están sonriendo.
  • Una ilustración digital de una araña muestra el proceso de producción de veneno dentro de una célula de glándula venenosa. El diagrama del cuerpo de la araña está a la izquierda, con una vista celular detallada a la derecha, resaltando los componentes celulares.

Grounded in research and proven effective

UC Berkeley’s Lawrence Hall of Science, the authors behind Amplify Science Florida, developed the Do, Talk, Read, Write, Visualize approach, and gold standard research shows that it works. Our own efficacy research is pretty exciting, too.

What educators say

“Just looking through the Amplify Science curriculum, I’m wishing I could go back in time and learn these concepts with these resources! I love that Amplify is more focused on diving deeper into fewer concepts over the year, rather than grazing the surface of more topics.”

Lizzie

Middle school teacher, KIPP charter network

What educators say

“In using this program, I have seen that my students are completely engaged and are able to visualize models of concepts using the simulations that they otherwise would not be able to visualize. The program is not about rote memory of facts—rather, it addresses the bigger picture and assesses a deeper understanding of science concepts.”

Julie

Science teacher, Georgia

What educators say

“The engineering units are engaging and really helped me better understand the new standards. I love being able to walk around and talk to students as they explore solutions, make claims, and reason with their peers.”

Karla

Science teacher, California

A powerful partnership

Amplify Science Florida was developed by the science education experts at UC Berkeley’s Lawrence Hall of Science and the digital learning team at Amplify. As the Hall’s first curriculum designed to address the Next Generation Sunshine State Standards for Science, Amplify Science Florida reflects state-of-the-art practices in science teaching and learning.

Our approach

Each unit of Amplify Science Florida engages students in a relevant, real-world problem where they investigate scientific phenomena, engage in collaboration and discussion, and develop models or explanations in order to arrive at solutions.

Rooted in research

Amplify Science Florida is rooted in the Lawrence Hall of Science’s Do, Talk, Read, Write, Visualize model of learning. This research-based approach presents students with multiple modalities through which to explore the curriculum.

Four middle school science students gather around a desk, engaged in an interactive group project, investigating an object together in a colorful classroom setting.
Two middle school girls conduct a science experiment

A flexible, blended program

Amplify Science Florida includes hands-on activities, print materials, and powerful digital tools to support online and offline teaching and learning. Highly adaptable and user-friendly, the program gives schools and individual teachers flexibility based on their technology resources and preferences.

Students take on the roles of scientists and engineers.

In each unit, students take on the role of a scientist or engineer to investigate a real-world problem. These problems provide relevant contexts through which students investigate phenomena.

Two middle school girls use a Student Investigation Notebook to take on the role of scientists and engineers

Phenomena-based teaching and learning

Download the “What’s so phenomenal about phenomena?” e-book

Download a free e-book

What’s included

Flexible resources that work seamlessly together

Science articles

The middle school science articles serve as sources for evidence collection and were authored by science and literacy experts at the Lawrence Hall of Science.

Student Investigation Notebooks

Available for every unit, the Student Investigation Notebooks provide space for students to:

  • record data
  • reflect on ideas from texts and investigations
  • construct explanations and arguments

Available with full-color article compilations for middle school units

Digital student experience

Students access the digital simulations and modeling tools, as well as lesson activities and assessments, through the digital student experience. Students can interact with the digital student experience as they:

  • conduct hands-on investigations
  • engage in active reading and writing activities
  • participate in discussions
  • record observations
  • craft end-of-unit scientific arguments

Teacher’s Guides

Available digitally and in print, the Teacher’s Guides contain all of the information teachers need to facilitate classroom instruction, including:

  • detailed lesson plans
  • unit and chapter overview documentation
  • differentiation strategies
  • standards alignments
  • in-context professional development

Hands-on materials kits

Hands-on learning is at the heart of Amplify Science Florida. Each unit kit contains:

  • consumable and non-consumable hands-on materials
  • print classroom display materials
  • premium print materials for student use (sorting cards, maps, etc.)

Explore more programs.

Our programs are designed to support and complement one another. Learn more about our related programs.

Inspiring the next generation of Louisiana scientists, engineers, and curious citizens

Amplify Science Louisiana blends hands-on investigations, literacy-rich activities, and interactive digital tools to empower students to think, read, write, and argue like real scientists and engineers.

The national edition of Amplify Science for middle school was recently rated all green by EdReports. Read the review on EdReports.

  • Dos niños están sentados en una mesa redonda en un salón de clases, mirando juntos la pantalla de una computadora portátil. Ambos parecen comprometidos y están sonriendo.
  • Dos niños con gafas de seguridad participan en una actividad científica; uno sostiene una taza de líquido y hace gestos mientras el otro toma notas con un lápiz.
  • Insignia verde y blanca que indica "Nivel 1 aprobado para los grados K-5 por el Departamento de Educación de Luisiana".
  • Una ilustración digital de una araña muestra el proceso de producción de veneno dentro de una célula de glándula venenosa. El diagrama del cuerpo de la araña está a la izquierda, con una vista celular detallada a la derecha, resaltando los componentes celulares.

Grounded in research and proven effective

UC Berkeley’s Lawrence Hall of Science, the authors behind Amplify Science Louisiana, developed the Do, Talk, Read, Write, Visualize approach, and gold standard research shows that it works. Our own efficacy research is pretty exciting, too.

What educators say

“Just looking through the Amplify Science curriculum, I’m wishing I could go back in time and learn these concepts with these resources! I love that Amplify is more focused on diving deeper into fewer concepts over the year, rather than grazing the surface of more topics.”

Lizzie

Middle school teacher, KIPP charter network

What educators say

“In using this program, I have seen that my students are completely engaged and are able to visualize models of concepts using the simulations that they otherwise would not be able to visualize. The program is not about rote memory of facts—rather, it addresses the bigger picture and assesses a deeper understanding of science concepts.”

Julie

Science teacher, Georgia

What educators say

“The engineering units are engaging and really helped me better understand the new standards. I love being able to walk around and talk to students as they explore solutions, make claims, and reason with their peers.”

Karla

Science teacher, California

A powerful partnership

Amplify Science Louisiana was developed by the science education experts at UC Berkeley’s Lawrence Hall of Science and the digital learning team at Amplify. As the Hall’s first curriculum designed to address the new science standards, Amplify Science Louisiana reflects state-of-the-art practices in science teaching and learning.

Our approach

Each unit of Amplify Science Louisiana engages students in a relevant, real-world problem where they investigate scientific phenomena, engage in collaboration and discussion, and develop models or explanations in order to arrive at solutions.

Rooted in research

Amplify Science Louisiana is rooted in the Lawrence Hall of Science’s Do, Talk, Read, Write, Visualize model of learning. This research-based approach presents students with multiple modalities through which to explore the curriculum.

A flexible, blended program

Amplify Science Louisiana includes hands-on activities, print materials, and powerful digital tools to support online and offline teaching and learning. Highly adaptable and user-friendly, the program gives schools and individual teachers flexibility based on their technology resources and preferences.

Students take on the roles of scientists and engineers.

In each unit, students take on the role of a scientist or engineer to investigate a real-world problem. These problems provide relevant contexts through which students investigate phenomena.

Two students collaborate at a desk, discussing a science workbook. Other students are visible in the background, engaged in the vibrant atmosphere of the classroom.

Phenomena-based teaching and learning

Download the “What’s so phenomenal about phenomena?” e-book

Download a free e-book

What’s included

Flexible resources that work seamlessly together

ElementaryMiddle School

Student Books

Age-appropriate Student Books allow students to:

  • engage with content-rich texts
  • obtain evidence
  • develop research and close-reading skills
  • construct arguments and explanations

Student Investigation Notebooks

Available for every unit, the Student Investigation Notebooks provide space for students to:

  • record data
  • reflect on ideas from texts and investigations
  • construct explanations and arguments

Simulations and practice tools (grades 2+)

Developed exclusively for the Amplify Science program, these engaging digital tools:

  • serve as venues for exploration
  • enable data collection
  • allow students to explore scientific concepts
  • show what might be impossible to see with the naked eye

Teacher’s Guides

Available digitally and in print, the Teacher’s Guides contain all of the information teachers need to facilitate classroom instruction, including:

  • detailed lesson plans
  • unit and chapter overview documentation
  • differentiation strategies
  • standards alignments
  • in-context professional development

Science articles

The middle school science articles serve as sources for evidence collection and were authored by science and literacy experts at the Lawrence Hall of Science.

Student Investigation Notebooks

Available for every unit, the Student Investigation Notebooks provide space for students to:

  • record data
  • reflect on ideas from texts and investigations
  • construct explanations and arguments

Available with full-color article compilations for middle school units

Digital student experience

Students access the digital simulations and modeling tools, as well as lesson activities and assessments, through the digital student experience. Students can interact with the digital student experience as they:

  • conduct hands-on investigations
  • engage in active reading and writing activities
  • participate in discussions
  • record observations
  • craft end-of-unit scientific arguments

Teacher’s Guides

Available digitally and in print, the Teacher’s Guides contain all of the information teachers need to facilitate classroom instruction, including:

  • detailed lesson plans
  • unit and chapter overview documentation
  • differentiation strategies
  • standards alignments
  • in-context professional development

Hands-on materials kits

Hands-on learning is at the heart of Amplify Science Louisiana. Each unit kit contains:

  • consumable and non-consumable hands-on materials
  • print classroom display materials
  • premium print materials for student use (sorting cards, maps, etc.)

Explore more programs.

Our programs are designed to support and complement one another. Learn more about our related programs.

What is mCLASS?

mCLASS is a best-in-class assessment platform that houses a suite of proven, gold-standard assessment measures and tools that can be flexibly combined to meet the unique literacy needs of both teachers and students across grades K–6, including:

  • Universal screening
  • Diagnostic assessment
  • Dyslexia screening
  • Progress monitoring
  • Dual language reporting
  • Targeted teacher-led instruction

What is the DIBELS 8th Edition assessment?

Developed by the University of Oregon, the DIBELS 8th Edition is the latest version of the DIBELS® (Dynamic Indicators of Basic Early Literacy Skills) assessment.

With this latest version, the University of Oregon Center on Teaching and Learning (UO CTL) made significant efforts to ensure measures would meet state-level screening requirements for universal screening, diagnostic assessment, and dyslexia screening. To support this, measures were updated based on the latest research to meet increased standards of reliability and validity. In addition, adaptive procedures and discontinue rules focus on the assessment of priority skills and prevent over-testing.

Summary of changes:

  • Consistent measures within grades will provide improved growth measurement.
  • All subtests have been revised to be grade-specific and to increase in difficulty, covering a full progression of skills and minimizing floor and ceiling effects. This provides the opportunity for students to demonstrate what they know and further pinpoint what they don’t know.
  • Phoneme Segmentation Fluency replaces First Sound Fluency. The expanded coverage minimizes floor effect and provides information about difficulty in Phonemic Awareness skills without the additional First Sound Fluency measure.
  • A new subtest, Word Reading Fluency, helps identify students with poor sight word reading skills that other subtests miss.
  • For all measures, the basic scoring procedures remain the same. For Nonsense Word Fluency, credit is given for recording words as whole words even if the student misses in the first attempt.
  • Oral Reading Fluency is now only one passage, instead of three. Retell has been removed. Thus, Oral Reading Fluency assessment will take a third of the time.

Assessment measures by grade

DIBELS measures at each grade level 
MeasureGrade KGrade 1Grade 2Grade 3
Letter naming fluency
Phonemic segmentation fluency
Nonsense word fluency
Word reading fluency
Oral reading fluency
Maze (basic comprehension)
Amplify measures at each grade level
Oral language
Vocabulary

Assessment measures sample videos

DIBELS 8th Edition measure: Phonemic Segmentation Fluency (PSF)

DIBELS 8th Edition measure: Nonsense Word Fluency (NWF)

DIBELS 8th Edition measure: Letter Naming Fluency (LNF)

DIBELS 8th Edition measure: Word Reading Fluency (WRF)

DIBELS 8th Edition measure: Oral Reading Fluency (ORF)

How is mCLASS with DIBELS 8th Edition different?

mCLASS with DIBELS 8th Edition combines the power of the mCLASS assessment platform and the effectiveness of the DIBELS 8th Edition assessment measures. As a result – educators across the state are empowered with the latest and greatest assessment tool.

More than a test, mCLASS with DIBELS 8th Edition is an integrated system that closes the knowing-doing gap by helping teachers take immediate instructional action that’s right for each and every student.

Assessment systems must enable and compel educators to answer not just the “What” questions, but also the “So What” and “Now What” questions. These are the questions that are essential in transforming classroom instruction, and the questions that mCLASS with DIBELS 8th Edition helps teachers answer with confidence.

How is mCLASS with DIBELS 8th Edition different?

  1. It gives teachers access to the latest digital version of the DIBELS assessment. Amplify is the only licensed provider of the digital DIBELS 8th Edition assessment. As such, our solution is the only one to enhance the DIBELS 8th Edition assessment with the power, reliability, and quickness of the mCLASS system.
  2. It makes it faster and easier to understand where every student is in their early literacy journey. By combining 1:1 observational diagnostic assessments, dyslexia screening, progress monitoring, instant scoring, rigorous reporting, automatic student grouping, and targeted instruction all in one place, it reduces the instructional delays associated with manual scoring, manual data analysis, and manual lesson planning.
  3. It brings more equity to the classroom. When used in conjunction with mCLASS Lectura, teachers have access to dual language reports that highlight a student’s strengths and weaknesses in both English and Spanish.
  4. It makes every instructional minute count. In addition to one-minute measures that quickly gauge student progress toward reading proficiency, it leverages a teacher’s most powerful instructional tool — their own 1:1 observations.
  5. It drives growth more efficiently. Rather than relying on broad composite scores alone, granular data and in-depth insights for every student help teachers pinpoint exact skill gaps and areas of unfinished learning, making whole-group, small-group, and 1:1 instruction more targeted and effective.
  6. It saves teachers time. Instant reports, automatic student groups, and ready-to-teach lessons mean teachers spend less time cobbling together materials and more time working directly with students and responding to their needs.

How does mCLASS with DIBELS 8th Edition support screening for dyslexia risk?

DIBELS 8th Edition measures have been updated based on the latest research. They now offer stronger measures of processing speed, phonological awareness, and alphabetic principles for dyslexia screening purposes.

To support this, a new subtest in Word Reading Fluency was introduced and revisions were made to Letter Naming Fluency, Phonemic Segmentation Fluency, and Nonsense Fluency subtests to improve their ability to screen for deficits commonly associated with dyslexia risk, such as phonological awareness, rapid naming ability, and alphabetic principle. These measures provide early warning signs for neurological processing difficulties that contribute to risk for dyslexia (Wolf & Bowers, 1999; Denckla & Rudel, 1974).

Moreover, measures in Oral Language and Vocabulary are included to provide additional information to help evaluate additional risk areas associated with dyslexia risk.

How does mCLASS with DIBELS 8th Edition turn data into instant action?

mCLASS with DIBELS 8th Edition gives you instant results and clear next steps for each student.

Quick and actionable reports provide detailed insight into students’ reading development across foundational literacy skills for teachers, specialists, administrators, and caregivers.

Chart comparing student assessment performance across the year in categories: beginning, middle, and end, with a breakout box summarizing results by percentage and student count.

Diagnostic assessment

mCLASS with DIBELS 8th Edition analyzes individual student response data through a scoring algorithm which aligns to the Colorado Department of Education’s stated purpose of a diagnostic assessment.

Our innovative approach to diagnostic assessment leverages an item-level evaluation of individual student responses in order to provide deeper insights into specific student weaknesses and areas of improvement. mCLASS with DIBELS 8th Edition analyzes individual student response data through a scoring algorithm which aligns to the Colorado Department of Education’s stated purpose of a diagnostic: “… to pinpoint a student’s specific area(s) of weakness and provide in-depth information about students’ skills and instructional needs.”

Ready-to-teach instruction

Immediately following the analysis of individual student responses, mCLASS with DIBELS 8th Edition provides an in-depth diagnostic report complete with suggested next steps, also known as “mCLASS Instruction.”

mCLASS Instruction evaluates each student’s responses on each individual subtest and instantly:

  • Provides a list of specific needs by student, such as struggling with medial vowel sounds or difficulty reading words with consonant blends.
  • Groups students automatically based on similar discrete skill needs, not simply composite scores like other assessment tools.
  • Recommends a variety of ready-to-teach lessons that specifically target each individual student’s areas of need or common areas of need for small-group instruction.

Classroom skill and benchmark summary

The Classroom Skill Summary report is a dashboard showing benchmark performance on each skill. Teachers can use it to determine which skill areas need instructional focus at a classroom level.

The Classroom Benchmark Summary report is a classroom-wide view of overall reading performance. Teachers can use this report to determine if composite scores improved, declined, or remained the same each semester.

Detailed benchmark performance

Teachers can see each student’s performance during the current school year, on each subtest as well as the overall composite. The benchmark goal displays below the subtest name when applicable. The ability to sort the columns in this report gives teachers more flexibility to analyze data the way they prefer.

Dyslexia screening

Identify students who are at risk for reading difficulties, including dyslexia, based on their results from foundational skills measures and additional measures as needed by local policies.

Progress monitoring summary

See which subtests have been assessed since the most recent benchmark assessment, how students performed on the three most recent progress monitoring assessments for each measure, and which students have not been progress monitored since the benchmark assessment.

Goal setting tool

The Zones of Growth (ZoG) analysis uses a rich set of national data to determine student goals for the next benchmark period. Teachers can use the Goal Setting Tool to view these recommended goals or modify the default goals for individual students as they see fit, if the default goal is too challenging or not challenging enough.

Growth outcomes

Teachers and interventionists can see each student’s actual growth achieved and how it compares to the goal that was set for the student.

Colorado READ Plans

Amplify recommends that a student who is categorized by the DIBELS 8th Edition composite score as “At High Risk” (denoted in all reports as “red”) be considered as potentially having a “Significant Reading Deficiency,” then further diagnosed using mCLASS’ Instruction diagnostics.

When devising a READ Plan, teachers and instructional staff should first consider students at high risk on DIBELS 8th Edition as potentially having a “Significant Reading Deficiency,” and eligible for a READ Plan. Students are then further diagnosed using mCLASS’ Instruction diagnostics. When devising a READ Plan, teachers can rely on the relevant mCLASS Instruction and Reports to comply with the READ Act.

Caregiver supports

The mCLASS Home Connect website houses literacy resources for parents and caregivers, including at-home lessons organized by skill. Our mCLASS parent/caregiver letters in English and Spanish ensure that families know how to best support their child.

Screenshot of the mclass home awareness webpage displaying educational games and activities for children, categorized by setting and skill level.

Explore our self-guided tour

Our self-guided tour is a great way to orient yourself to the organization of our mCLASS platform. Click the button below to get started.

Contact us

Looking to speak directly with your Colorado representative? Get in touch with a team member by emailing HelloColorado@amplify.com or by calling us directly.

Enrollment over 2,500 studentsEnrollment under 2,500 students
Monty LammersSenior Account Executive(719) 964-4501mlammers@amplify.comVanessa ScottAccount Executive(602) 690-9216vscott@amplify.com

What is mCLASS?

mCLASS is a best-in-class assessment platform that houses a suite of proven, gold-standard assessment measures and tools that can be flexibly combined to meet the unique literacy needs of both teachers and students across grades K–6, including:

  • Universal screening
  • Diagnostic assessment
  • Dyslexia screening
  • Text Reading and Comprehension (a.k.a. running records via mCLASS: Reading 3D)
  • Progress monitoring
  • Dual language reporting
  • Targeted teacher-led instruction

What is the DIBELS 8th Edition assessment?

Developed by the University of Oregon, the DIBELS 8th Edition is the latest version of the DIBELS® (Dynamic Indicators of Basic Early Literacy Skills) assessment.

With this latest version, the University of Oregon Center on Teaching and Learning (UO CTL) made significant efforts to ensure measures would meet state-level screening requirements for universal screening, diagnostic assessment, and dyslexia screening. To support this, measures were updated based on the latest research to meet increased standards of reliability and validity. In addition, adaptive procedures and discontinue rules focus on the assessment of priority skills and prevent over-testing.

Summary of changes:

  • Consistent measures within grades will provide improved growth measurement.
  • All subtests have been revised to be grade-specific and to increase in difficulty, covering a full progression of skills and minimizing floor and ceiling effects. This provides the opportunity for students to demonstrate what they know and further pinpoint what they don’t know.
  • Phoneme Segmentation Fluency replaces First Sound Fluency. The expanded coverage minimizes floor effect and provides information about difficulty in Phonemic Awareness skills without the additional First Sound Fluency measure.
  • A new subtest, Word Reading Fluency, helps identify students with poor sight word reading skills that other subtests miss.
  • For all measures, the basic scoring procedures remain the same. For Nonsense Word Fluency, credit is given for recording words as whole words even if the student misses in the first attempt.
  • Oral Reading Fluency is now only one passage, instead of three. Retell has been removed. Thus, Oral Reading Fluency assessment will take a third of the time.

Assessment measures by grade

DIBELS measures at each grade level 
Measure Grade K Grade 1 Grade 2 Grade 3 Grades 4–6
Letter naming fluency A large, light peach-colored checkmark on a transparent background. A large, light peach-colored checkmark on a transparent background.      
Phonemic segmentation fluency A large, light peach-colored checkmark on a transparent background. A large, light peach-colored checkmark on a transparent background.      
Nonsense word fluency A large, light peach-colored checkmark on a transparent background. A large, light peach-colored checkmark on a transparent background. A large, light peach-colored checkmark on a transparent background. A large, light peach-colored checkmark on a transparent background.  
Word reading fluency A large, light peach-colored checkmark on a transparent background. A large, light peach-colored checkmark on a transparent background. A large, light peach-colored checkmark on a transparent background. A large, light peach-colored checkmark on a transparent background. A large, light peach-colored checkmark on a transparent background.
Oral reading fluency   A large, light peach-colored checkmark on a transparent background. A large, light peach-colored checkmark on a transparent background. A large, light peach-colored checkmark on a transparent background. A large, light peach-colored checkmark on a transparent background.
Maze (basic comprehension)     A large, light peach-colored checkmark on a transparent background. A large, light peach-colored checkmark on a transparent background. A large, light peach-colored checkmark on a transparent background.
Amplify measures at each grade level
Oral language A large, light peach-colored checkmark on a transparent background. A large, light peach-colored checkmark on a transparent background. A large, light peach-colored checkmark on a transparent background. A large, light peach-colored checkmark on a transparent background.  
Vocabulary A large, light peach-colored checkmark on a transparent background. A large, light peach-colored checkmark on a transparent background. A large, light peach-colored checkmark on a transparent background. A large, light peach-colored checkmark on a transparent background. A large, light peach-colored checkmark on a transparent background.

Assessment measures sample videos

DIBELS 8th Edition measure: Phonemic Segmentation Fluency (PSF)

DIBELS 8th Edition measure: Nonsense Word Fluency (NWF)

DIBELS 8th Edition measure: Letter Naming Fluency (LNF)

DIBELS 8th Edition measure: Word Reading Fluency (WRF)

DIBELS 8th Edition measure: Oral Reading Fluency (ORF)

What makes mCLASS with DIBELS 8th Edition different?

mCLASS with DIBELS 8th Edition combines the power of the mCLASS assessment platform and the effectiveness of the DIBELS 8th Edition assessment measures. As a result – educators are empowered with the latest and greatest assessment tool.

More than a test, mCLASS with DIBELS 8th Edition is an integrated system that closes the knowing-doing gap by helping teachers take immediate instructional action that’s right for each and every student.

Assessment systems must enable and compel educators to answer not just the “What” questions, but also the “So What” and “Now What” questions. These are the questions that are essential in transforming classroom instruction, and the questions that mCLASS with DIBELS 8th Edition helps teachers answer with confidence.

What makes mCLASS with DIBELS 8th Edition different?

  1. It gives teachers access to the latest digital version of the DIBELS assessment. Amplify is the only licensed provider of the digital DIBELS 8th Edition assessment. As such, our solution is the only one to enhance the DIBELS 8th Edition assessment with the power, reliability, and quickness of the mCLASS system.
  2. It makes it faster and easier to understand where every student is in their early literacy journey. By combining 1:1 observational diagnostic assessments, dyslexia screening, progress monitoring, instant scoring, rigorous reporting, automatic student grouping, and targeted instruction all in one place, it reduces the instructional delays associated with manual scoring, manual data analysis, and manual lesson planning.
  3. It brings more equity to the classroom. When used in conjunction with mCLASS Lectura, teachers have access to dual language reports that highlight a student’s strengths and weaknesses in both English and Spanish.
  4. It makes every instructional minute count. In addition to one-minute measures that quickly gauge student progress toward reading proficiency, it leverages a teacher’s most powerful instructional tool — their own 1:1 observations.
  5. It drives growth more efficiently. Rather than relying on broad composite scores alone, granular data and in-depth insights for every student help teachers pinpoint exact skill gaps and areas of unfinished learning, making whole-group, small-group, and 1:1 instruction more targeted and effective.
  6. It saves teachers time. Instant reports, automatic student groups, and ready-to-teach lessons mean teachers spend less time cobbling together materials and more time working directly with students and responding to their needs.

How does mCLASS with DIBELS 8th Edition support screening for dyslexia risk?

DIBELS 8th Edition measures have been updated based on the latest research. They now offer stronger measures of processing speed, phonological awareness, and alphabetic principles for dyslexia screening purposes.

To support this, a new subtest in Word Reading Fluency was introduced and revisions were made to Letter Naming Fluency, Phonemic Segmentation Fluency, and Nonsense Fluency subtests to improve their ability to screen for deficits commonly associated with dyslexia risk, such as phonological awareness, rapid naming ability, and alphabetic principle. These measures provide early warning signs for neurological processing difficulties that contribute to risk for dyslexia (Wolf & Bowers, 1999; Denckla & Rudel, 1974).

Moreover, measures in Oral Language and Vocabulary are included to provide additional information to help evaluate additional risk areas associated with dyslexia risk.

How does mCLASS with DIBELS 8th Edition support the use of running records?

Track your students’ reading progress from every angle with the Text Reading and Comprehension (TRC) assessment. When TRC is paired with the DIBELS 8th Edition assessment, classroom teachers unlock the ability to record reading behaviors through running digital records. Available in English and Spanish, it measures reading comprehension and provides insight into how each student finds meaning in text.

A laptop screen displays an educational progress report for a student named Jon Smith, showing reading levels and benchmarks in three categories: BOY, MOY, and EOY.

Measures include:

  • Lesson plans for whole class, small-group, and one-on-one instruction.
  • Small-group advisor, which organizes students into groups based on strengths and gaps.
  • Item-level advisor, which drills deep into student responses to uncover patterns, strengths, and gaps.
  • Instructional resources for each student’s parent/guardian(s).

How does mCLASS with DIBELS 8th Edition turn data into instant action?

mCLASS with DIBELS 8th Edition gives you instant results and clear next steps for each student.

Quick and actionable reports provide detailed insight into students’ reading development across foundational literacy skills for teachers, specialists, administrators, and caregivers.

A tablet screen displays a student assessment summary table with color-coded categories for phonemic awareness, letter sounds, and decoding, comparing results from beginning to end of year.

Diagnostic assessment

mCLASS with DIBELS 8th Edition analyzes individual student response data through a proprietary scoring algorithm that pinpoints a student’s specific area(s) of growth and improvement, providing classroom teachers in-depth insight into a students’ instructional needs.

Ready-to-teach instruction

Immediately following the analysis of individual student responses, mCLASS with DIBELS 8th Edition provides an in-depth diagnostic report complete with suggested next steps, also known as “mCLASS Instruction.”

mCLASS Instruction evaluates each student’s responses on each individual subtest and instantly:

  • Provides a list of specific needs by student, such as struggling with medial vowel sounds or difficulty reading words with consonant blends.
  • Groups students automatically based on similar discrete skill needs, not simply composite scores like other assessment tools.
  • Recommends a variety of ready-to-teach lessons that specifically target each individual student’s areas of need or common areas of need for small-group instruction.

Classroom skill and benchmark summary

The Classroom Skill Summary report is a dashboard showing benchmark performance on each skill. Teachers can use it to determine which skill areas need instructional focus at a classroom level.

The Classroom Benchmark Summary report is a classroom-wide view of overall reading performance. Teachers can use this report to determine if composite scores improved, declined, or remained the same each semester.

Detailed benchmark performance

Teachers can see each student’s performance during the current school year, on each subtest as well as the overall composite. The benchmark goal displays below the subtest name when applicable. The ability to sort the columns in this report gives teachers more flexibility to analyze data the way they prefer.

Dyslexia screening

Identify students who are at risk for reading difficulties, including dyslexia, based on their results from foundational skills measures and additional measures as needed by local policies.

Progress monitoring summary

See which subtests have been assessed since the most recent benchmark assessment, how students performed on the three most recent progress monitoring assessments for each measure, and which students have not been progress monitored since the benchmark assessment.

Goal setting tool

The Zones of Growth (ZoG) analysis uses a rich set of national data to determine student goals for the next benchmark period. Teachers can use the Goal Setting Tool to view these recommended goals or modify the default goals for individual students as they see fit, if the default goal is too challenging or not challenging enough.

Growth outcomes

Teachers and interventionists can see each student’s actual growth achieved and how it compares to the goal that was set for the student.

Caregiver supports

The mCLASS Home Connect website houses literacy resources for parents and caregivers, including at-home lessons organized by skill. Our mCLASS parent/caregiver letters in English and Spanish ensure that families know how to best support their child.

Screenshot of the mCLASS Home Connect webpage showing three phonological awareness activities for grades K-2 with brief descriptions and a PDF download button.

Self-guided tour

Our self-guided tour is a great way to orient yourself to the organization of our mCLASS platform. Click the button below to get started.

A webpage titled "mCLASS overview" featuring text about the mCLASS early literacy suite for grades K-6. The page includes photos of children engaged in reading activities and navigation options on the left.

Demo access

Follow the instructions below to login to your demo account.

  • Click the mCLASS Demo button below.
  • Select Log in with Amplify.
  • Enter the username: d8demoD
  • Enter the password: 1234
  • Click the Reading tile.

 
Once you are logged in:

  • Find the Class/Group dropdown field and select Grade 1.
  • Right above the Class Summary, click Beginning of Year or Middle of Year and explore the data.
  • Scroll down to the class list. Each column within the class list is sortable by clicking the double arrow in the column header.
  • Click on any score to see the measure transcript.
  • Click on a student’s name to see historical data and progress monitoring graphs.

After exploring the Benchmark tab in the purple bar:

  • Click on the Instruction tab.
  • If you don’t see groups, click Updated recommendations.
  • Explore freely! The Groups, Students, and All Activities tabs have rich information.
  • Click the Progress tab.
  • Click on Home Connect to see a sample of our caregiver letters.

Grade 6

Unit 1: Area and Surface Area

Lesson 2: Finding Area by Decomposing and RearrangingShapes on a Plane
Lesson 3: Reasoning to Find AreaLetters
Lesson 4: ParallelogramsExploring Parallelograms, Part 2
Lesson 5: Bases and Heights of ParallelogramsExploring Parallelograms, Part 1
Lesson 6: Areas of ParallelogramsOff the Grid, Part 1
Lesson 7: From Parallelograms to TrianglesTriangles and Parallelograms
Lesson 8: Areas of TrianlgeExploring Triangles
Lesson 10: Bases and Heights of TrianglesOff the Grid, Part 2
Lesson 11: PolygonsPile of Polygons
Lesson 15: More Nets, More Surface AreaRenata’s Stickers

Unit 2: Introducing Rations

Lesson 3: RecipesPizza Maker
Lesson 5: Defining Equivalent RatiosFruit Lab
Lesson 12: Navagating a Table of Equivalent RationsDisaster Preparation

Unit 3: Unit Rates and Percentages

Lesson 1: Anchoring Units of MeasureMany Measurements
Lesson 4: Comparing Speeds and PriceWorld Records
Lesson 5: Interpreting RatesSoft Serve
Lesson 6: Equivalent Ratios Have the Same Unit RatesWelcome to the Robot Factory
Lesson 8: Solving Rate ProblemsMore Soft Serve
Lesson 9: More about Constant SpeedModel Trains
Lesson 11: Representing Percentages with Double Number Line DiagramsLucky Duckies

Unit 4: Dividing Fractions

Lesson 4: How Many Groups? (Part 1)Flour Planner
Lesson 6: Using Diagrams to Find the Number of GroupsFill the Gap
Lesson 13: Rectangles with Fractional Side LengthsPuzzling Areas

Unit 5: Arithmetic in Base 10

Lesson 1: Using Decimals in Shopping ContextDishing Out Decimals

Unit 5: Arithmetic in Base 11

Lesson 2: Using Diagrams to Represent Addition and SubtractionDecimal Diagrams and Algorithms

Unit 5: Arithmetic in Base 12

Lesson 15: Making and Measuring BoxesMovie Time

Unit 6: Expressions and Equations

Lesson 1: Tape Diagrams and EquationsFive Equations
Weight for It
Lesson 3: Staying in BalanceHanging Around
Lesson 4: Practice Solving EquationsHanging It Up
Lesson 5: Represent Situations with EquationsSwap and Solve
Lesson 9: The Distributive Property: Part 1Products and Sums
Lesson 17: Two Related Quantaties, Part 2Subway Fares

Unit 7: Rational Numbers

Lesson 3: Comparing Positive and Negative NumbersOrder in the Class
Lesson 5: Using Negative Numbers to Make Sense in ContextMinimum Wage
Lesson 8: Writing and Graphing InequalitiesTunnel Travels

Unit 8: Data Sets and Distributions

Lesson 5: Using Dot Plots to Answer Statistical QuestionsMinimum Wage
Lesson 6: Interpreting HistogramsThe Plot Thickens
Lesson 11: Variability and MADHoops
Lesson 13: MedianToy Cars

Grade 7

Unit 1: Scale Drawing

Lesson 1: What are scaled copies?Scaling Machines
Lesson 2: Correspond Parts and Scale FactorsMake it Scale
Lesson 3: Making Scaled CopiesScaling Robots
Lesson 5: The Size of the Scale FactorScale Factor Challenges
Lesson 6: Scaling AreaTiles
Lesson 6: Scaling AreaWill It Fit

Unit 2: Introducing Proportional Relationships

Lesson 1: One of These Things is Not Like the OtherPaint
Lesson 5: Two Equations for Each RelationshipTwo and Two
Lesson 10: Introducing Graphs of Proportional RelationshipsDinoPops

Unit 3: Measuring Circles

Lesson 2: Exploring CirclesMeasuring Around
Lesson 7: Exploring the Area of a CircleWhy Pi?
Lesson 9: Applying Area of a CircleArea Challenges

Unit 4: Proportional Relationships and Percentages

Lesson 6: Increasing and DecreasingMosaics
100%
Lesson 7: One Hundred PercentMore and Less
Back in My Day
Lesson 8: Percent Increase and Decrease with EquationsAll the Equations
Lesson 11: Percentage ContextsPercent Machines

Unit 5: Rational Number Arithmetic

Lesson 3: Changing ElevationFloats and Anchors
Lesson 5: Representing SubtractionMore Floats and Anchors
Lesson 6: Finding DifferencesDraw Your Own
Lesson 13: Expressions with Rational NumbersInteger Puzzles

Unit 6: Expressions, Equations, and Inequalities

Lesson 9: Dealing with Negative NumbersKeeping it True
Lesson 13: Reintroducing InequalitiesI Saw the Signs
Lesson 14: Finding Solutions to Inequalities in ContextUnbalanced Hangers
Lesson 15: Efficiently Solving InequalitiesShira the Sheep
Lesson 16: Interpreting InequalitiesBudgeting
Lesson 17: Modeling with InequalitiesWrite Them and Solve Them
Lesson 20: Combining Like Terms (Part 1)Collect the Squares

Unit 7: Angles, Triangles, and Prisms

Lesson 2: Adjacent AnglesFriendly Angles
Lesson 5: Using Equations to Solve For Unknown AnglesMissing Measures
Lesson 7: Building Polygons (Part 2)Can You Build It

Unit 8: Probability and Sampling

Lesson 1: Mystery BagsHow Likely
Lesson 3: What are Probabilities?Prob-bear-bilities
Lesson 4: Estimating Probabilities through Repeated ExperimentsIs It Fair?
Lesson 13: What Make a Good Sample?Crab Island

Grade 8

Unit 1: Rigid Transformations and Congruence

Lesson 1: Moving the PlaneTransformers
Lesson 2: Naming the MovesSpinning, Flipping, Sliding
Lesson 3: Grid MovesMoving Day
Lesson 4: Making MovesTransformation Golf
Lesson 5: Coordinate MovesGetting Coordinated, Part 1
Lesson 6: Describing TransformationsGetting Coordinated, Part 2
Lesson 16: Parallel Lines and Angles in a TrianglePuzzling It Out
Lesson 17: Rotate and TesselateTessellate

Unit 2: Dilations, Similarity, and Introducing Slope

Lesson 1: Projecting and ScalingSketchy Dilations
Lesson 3: Dilations with No GridDilation Mini Golf
Lesson 7: Similar PolygonsSocial Scavenger Hunt

Unit 3: Linear Relationships

Lesson 1: Understanding Proportional RelationshipsTurtle Time Trials
Lesson 5: Introductions to Linear RelationshipsFlags
Lesson 6: More Linear RelationshipsStacking Cups (Optional)
Lesson 8: Translating y=mx+bTranslations
Lesson 9: Slopes Don’t Have to Be PositiveWater Cooler
Lesson 10: Calculating SlopeUps and Downs

Unit 4: Linear Equations and Systems

Lesson 5: Solve Any Linear EquationEquation Roundtable
Lesson 12: Systems of EquationsMake Them Balance
Lesson 13: Solving Systems of EquationsLine Zapper

Unit 5: Functions and Volume

Lesson 1: Inputs and OutputsGuess My Rule
Lesson 5: More graphs of FunctionsTurtle Crossing
Lesson 6: Even More Graphs of FunctionsThe Tortoise and the Hare
Lesson 13: The Volume of a CylinderCylinders
Lesson 15: The Volume of a ConeCones

Unit 6: Associations and Data

Lesson 3: What a Point on a Scatter Plot MeansRobots
Lesson 4: Fitting a Line to DataDapper Cats
Lesson 5: Describing Trends in Scatter PlotsInterpreting Scatter Plots
Lesson 6: Slope of a Fitted LineFind the FIt (called Fit Fights in Desmos Math)
Lesson 7: Observing More Patterns in Scatter PlotsScatter Plot City
Lesson 8: Analyzing Bivariate DataInterpreting Slopes
Lesson 9: Looking for AssociationAnimal Brains
Lesson 10: Using Data Displays to Find AssociationFinding Associations

Unit 7: Exponents and Scientific Notation

Lesson 1: Exponent ReviewCircles
Lesson 6: What about Other Bases?Power Pairs
Lesson 12: Applicatios of Arithmetic with Powers of 10Balance the Scale
Lesson 13: Definition of Scientific NotationSpecific and Scientific (formerly Solar System)

Unit 8: Pythagorean Theorem and Irrational Numbers

Lesson 5: Square Roots on the Number LineRoot Down
Lesson 7: Finding Side Lengths of TrianglesTriangle Tracing Turtle
Lesson 11: Applications of the Pythagorean TheoremTaco Truck

Algebra 1

Intro/Launch

Unit 1: One Variable Statistics

Lesson 12: Standard DeviationFinding Desmo

Unit 2: Linear Equations and Systems

Lesson 4: Equations and Their SolutionsWorking Backwards
Solving Strategies
Same Position
Lesson 5: Equations and Their GraphsShelley the Snail
Five Representations
Lesson 6: Equivalent EquationsSubway Seats
Lesson 7: Explaining Steps for Rewriting EquationsVarious Variables
Lesson 12: Writing and Graphing Systems of Linear EquationsLizard Lines
Lesson 13: Solving Systems by SubstitutionShape It Up

Unit 3: Two Variable Statistics

Lesson 5: Fitting LinesCity Slopes
Penguin Populations
Lesson 6: ResidualsResidual Fruit
Lesson 7: Correlation CoefficientCorrelation Coefficient
City Data
Lesson 8: Using the Correlation CoefficientHow Hot Is It?
Lesson 9: Causal RelationshipsBehind the Headlines

Unit 4: Linear Inequalities and Systems

Lessons 4-6: Graphing Linear Inequalities in Two VariablesPizza Delivery
Lesson 7: Solutions to Systems of Linear Inequalities in Two VariablesQuilts
Seeking Solutions
Lesson 8: Solving Problems with Systems of Linear Inequalities in Two VariablesCarlos’s Fish

Unit 5: Functions

Lesson 1: Describing and Graphing SituationsCraft-a-Graph
Lesson 7: Using Graphs to Find Average Rate of ChangePlane, Train, and Automobile
Lesson 12: Piecewise FunctionsPumpkin Prices
Lesson 15: Inverse FunctionsChip the Robot

Unit 6: Introduction to Exponential Functions

Unit 7: Introduction to Quadratic Functions

Lesson 1: A Different Kind of ChangeRevisiting Visual Patterns, Part 1
Quadratic Visual Patterns
Lesson 10: Graphs of Quadratic Functions in Standard and Factored FormsOn the Fence
Stomp Rockets
Plenty of Parabolas
Two for One
Lesson 11: Graphing Quadratics from the Factored FormParabola Zapper
Shooting Stars
Lesson 14: Quadratic Graphs that Represent SituationsRobot Launch

Unit 8: Quadratic Equations

Lesson 2: When and Why Do We Write Quadratic Equations?Sorting Relationships
Lesson 12-14: Completing the SquareSquare Tactic
Lesson 24: Using Quadratic Equations to Model Situation and Solve ProblemsStomp Rockets in Space

Disclaimer

This document is for informational purposes only; references to third-party programs do not imply endorsement or affiliation, and all trademarks are the property of their respective owners.

What is mCLASS?

mCLASS is a best-in-class assessment platform that houses a suite of proven, gold-standard assessment measures and tools that can be flexibly combined to meet the unique literacy needs of both teachers and students across grades K–6, including:

  • Universal screening
  • Diagnostic assessment
  • Dyslexia screening
  • Progress monitoring
  • Dual language reporting
  • Quick 1-minute assessment measures
  • Real-time results, instant analysis, automatic student grouping
  • Targeted teacher-led instruction with ready-to-use mini-lessons

What is the DIBELS 8th Edition assessment?

Developed by the University of Oregon, the DIBELS 8th Edition is the latest version of the DIBELS® (Dynamic Indicators of Basic Early Literacy Skills) assessment.

With this latest version, the University of Oregon Center on Teaching and Learning (UO CTL) made significant efforts to ensure measures would meet state-level screening requirements for universal screening, diagnostic assessment, and dyslexia screening. To support this, measures were updated based on the latest research to meet increased standards of reliability and validity. In addition, adaptive procedures and discontinue rules focus assessment on priority skills and prevent over-testing.

Summary of changes:

  • Consistent measures within grades will provide improved growth measurement.
  • All subtests have been revised to be grade-specific and to increase in difficulty, covering a full progression of skills and minimizing floor and ceiling effects. This provides the opportunity for students to demonstrate what they know and further pinpoint what they don’t know.
  • Phoneme Segmentation Fluency replaces First Sound Fluency. The expanded coverage minimizes floor effect and provides information about difficulty in PA skills without the additional FSF measure.
  • A new subtest, Word Reading Fluency, helps identify students with poor sight word reading skills that other subtests miss.
  • For all measures, the basic scoring procedures remain the same. For NWF, credit is given for recording words as whole words even if the student misses in the first attempt.
  • Oral Reading Fluency is now only one passage, instead of three. Retell has been removed. Thus, ORF assessment will take a third of the time.

Assessment measures by grade

DIBELS measures at each grade level 
Measure Grade K Grade 1 Grade 2 Grade 3
Letter naming fluency A large, light peach-colored checkmark on a transparent background. A large, light peach-colored checkmark on a transparent background.    
Phonemic segmentation fluency A large, light peach-colored checkmark on a transparent background. A large, light peach-colored checkmark on a transparent background.    
Nonsense word fluency A large, light peach-colored checkmark on a transparent background. A large, light peach-colored checkmark on a transparent background. A large, light peach-colored checkmark on a transparent background. A large, light peach-colored checkmark on a transparent background.
Word reading fluency A large, light peach-colored checkmark on a transparent background. A large, light peach-colored checkmark on a transparent background. A large, light peach-colored checkmark on a transparent background. A large, light peach-colored checkmark on a transparent background.
Oral reading fluency   A large, light peach-colored checkmark on a transparent background. A large, light peach-colored checkmark on a transparent background. A large, light peach-colored checkmark on a transparent background.
Maze (basic comprehension)     A large, light peach-colored checkmark on a transparent background. A large, light peach-colored checkmark on a transparent background.
Amplify measures at each grade level
Oral language A large, light peach-colored checkmark on a transparent background. A large, light peach-colored checkmark on a transparent background. A large, light peach-colored checkmark on a transparent background. A large, light peach-colored checkmark on a transparent background.
Vocabulary A large, light peach-colored checkmark on a transparent background. A large, light peach-colored checkmark on a transparent background. A large, light peach-colored checkmark on a transparent background. A large, light peach-colored checkmark on a transparent background.

Assessment measures sample videos

DIBELS 8th Edition measure: Phonemic Segmentation Fluency (PSF)

DIBELS 8th Edition measure: Nonsense Word Fluency (NWF)

DIBELS 8th Edition measure: Letter Naming Fluency (LNF)

DIBELS 8th Edition measure: Word Reading Fluency (WRF)

DIBELS 8th Edition measure: Oral Reading Fluency (ORF)

How is mCLASS with DIBELS 8th Edition different?

mCLASS with DIBELS 8th Edition combines the power of the mCLASS assessment platform and the effectiveness of the DIBELS 8th Edition assessment measures. As a result – educators across the state are empowered with the latest and greatest assessment tool.

More than a test, mCLASS with DIBELS 8th Edition is an integrated system that closes the knowing-doing gap by helping teachers take immediate instructional action that’s right for each and every student.

Assessment systems must enable and compel educators to answer not just the “What” questions, but also the “So What” and “Now What” questions. These are the questions that are essential in transforming classroom instruction, and the questions that mCLASS with DIBELS 8th Edition helps teachers answer with confidence.

How is mCLASS with DIBELS 8th Edition different?

  1. It gives teachers access to the latest digital version of the DIBELS assessment. Amplify is the only licensed provider of the digital DIBELS 8th Edition assessment. As such, our solution is the only one to enhance the DIBELS 8th Edition assessment with the power, reliability, and quickness of the mCLASS system.
  2. It makes it faster and easier to understand where every student is in their early literacy journey. By combining 1:1 observational diagnostic assessments, dyslexia screening, progress monitoring, instant scoring, rigorous reporting, automatic student grouping, and targeted instruction all in one place, it reduces the instructional delays associated with manual scoring, manual data analysis, and manual lesson planning.
  3. It brings more equity to the classroom. When used in conjunction with mCLASS Lectura, teachers have access to dual language reports that highlight a student’s strengths and weaknesses in both English and Spanish.
  4. It makes every instructional minute count. In addition to one-minute measures that quickly gauge student progress toward reading proficiency, it leverages a teacher’s most powerful instructional tool — their own 1:1 observations.
  5. It drives growth more efficiently. Rather than relying on broad composite scores alone, granular data and in-depth insights for every student help teachers pinpoint exact skill gaps and areas of unfinished learning, making whole-group, small-group, and 1:1 instruction more targeted and effective.
  6. It saves teachers time. Instant reports, automatic student groups, and ready-to-teach lessons mean teachers spend less time cobbling together materials and more time working directly with students and responding to their needs.

How does mCLASS with DIBELS 8th Edition support screening for dyslexia risk?

DIBELS 8th Edition measures have been updated based on the latest research. They now offer stronger measures of processing speed, phonological awareness, and alphabetic principles for dyslexia screening purposes.

To support this, a new subtest in Word Reading Fluency was introduced and revisions were made to Letter Naming Fluency, Phonemic Segmentation Fluency, and Nonsense Fluency subtests to improve their ability to screen for deficits commonly associated with dyslexia risk, such as phonological awareness, rapid naming ability, and alphabetic principle. These measures provide early warning signs for neurological processing difficulties that contribute to risk for dyslexia (Wolf & Bowers, 1999; Denckla & Rudel, 1974).

Moreover, measures in Oral Language and Vocabulary are included to provide additional information to help evaluate additional risk areas associated with dyslexia risk.

How does mCLASS with DIBELS 8th Edition turn data into instant action?

mCLASS with DIBELS 8th Edition gives you instant results and clear next steps for each student.

Quick and actionable reports provide detailed insight into students’ reading development across foundational literacy skills for teachers, specialists, administrators, and caregivers.

Chart comparing student assessment performance across the year in categories: beginning, middle, and end, with a breakout box summarizing results by percentage and student count.

Diagnostic assessment

mCLASS with DIBELS 8th Edition analyzes individual student response data through a innovative scoring algorithm that leverages an item-level evaluation of individual student responses in order to provide deeper insights into specific student weaknesses and areas of improvement.

Ready-to-teach instruction

Immediately following the analysis of individual student responses, mCLASS with DIBELS 8th Edition provides an in-depth diagnostic report complete with suggested next steps, also known as “mCLASS Instruction.”

mCLASS Instruction evaluates each student’s responses on each individual subtest and instantly:

  • Provides a list of specific needs by student, such as struggling with medial vowel sounds or difficulty reading words with consonant blends.
  • Groups students automatically based on similar discrete skill needs, not simply composite scores like other assessment tools.
  • Recommends a variety of ready-to-teach lessons that specifically target each individual student’s areas of need or common areas of need for small-group instruction.

Classroom skill and benchmark summary

The Classroom Skill Summary report is a dashboard showing benchmark performance on each skill. Teachers can use it to determine which skill areas need instructional focus at a classroom level.

The Classroom Benchmark Summary report is a classroom-wide view of overall reading performance. Teachers can use this report to determine if composite scores improved, declined, or remained the same each semester.

Detailed benchmark performance

Teachers can see each student’s performance during the current school year, on each subtest as well as the overall composite. The benchmark goal displays below the subtest name when applicable. The ability to sort the columns in this report gives teachers more flexibility to analyze data the way they prefer.

Dyslexia screening

Identify students who are at risk for reading difficulties, including dyslexia, based on their results from foundational skills measures and additional measures as needed by local policies.

Progress monitoring summary

See which subtests have been assessed since the most recent benchmark assessment, how students performed on the three most recent progress monitoring assessments for each measure, and which students have not been progress monitored since the benchmark assessment.

Goal setting tool

The Zones of Growth (ZoG) analysis uses a rich set of national data to determine student goals for the next benchmark period. Teachers can use the Goal Setting Tool to view these recommended goals or modify the default goals for individual students as they see fit, if the default goal is too challenging or not challenging enough.

Growth outcomes

Teachers and interventionists can see each student’s actual growth achieved and how it compares to the goal that was set for the student.

Caregiver supports

The mCLASS Home Connect website houses literacy resources for parents and caregivers, including at-home lessons organized by skill. Our mCLASS parent/caregiver letters in English and Spanish ensure that families know how to best support their child.

Screenshot of the mclass home awareness webpage displaying educational games and activities for children, categorized by setting and skill level.

Explore our self-guided tour

Our self-guided tour is a great way to orient yourself to the organization of our mCLASS platform. Click the button below to get started.

mCLASS self-guided tour

What’s included in our grades K–2 language arts curriculum

Amplify Core Knowledge Language Arts® (CKLA) is a comprehensive early literacy curriculum, grounded in the Science of Reading. The K–2 curriculum sequences deep content knowledge-building with research-based foundational skills. With Amplify CKLA, you’ll have the instruction and guidance of proven, evidence-based practices to help all of your students become strong readers, writers, and thinkers.

Choose Level

Year at a glance

The Amplify CKLA curriculum is modeled after proven research in early literacy that supports a two-strand approach to literacy instruction in the early years. With this approach, students in Grades K–2 complete one full lesson per day that builds foundational reading skills in the Skills Strand, as well as one full lesson that builds background knowledge in the Knowledge Strand. The deep content knowledge is sequenced together with research-based foundational skills in Grades K–2 so that students develop the early literacy skills necessary to help them become confident readers, as well as build the context to understand what they’re reading. 

In Grades 3–5, lessons combine skills and knowledge with increasingly complex texts, close reading, and a greater emphasis on writing. Students start to use their skills to go on their own independent reading adventures, further opening up their worlds.

Units & domains at a glance

The number of days to complete each Skills Unit and Knowledge Domain varies based on instructional purpose.

Nursery Rhymes and Fables

Well-known fables introduce students to new vocabulary, build phonological awareness, and prompt discussion of character, virtues, and behavior.

Number of Lessons: 12

The Five Senses

Students explore how they learn about the world using their five senses: sight, hearing, smell, taste, and touch.

Number of Lessons: 8

Stories

Students develop an awareness of language and recurring themes in children’s literature, including classic stories, trickster tales, and fiction from other cultures.

Number of Lessons: 10

Plants

Read-aloud texts introduce students to basic knowledge of ecology, parts of plants, how plants grow, and the interdependence of all living things.

Number of Lessons: 11

Farms

Students identify several farm animals and crops and contrast how plants make their food with how animals get their food.

Number of Lessons9

Native Americans

Students explore cultures of three Native American groups, as well as how conditions in different geographical regions influence their ways of life.

Number of Lessons: 8

Kings and Queens

Students listen to read-aloud texts, both fiction and nonfiction, about kings, queens, and royal families, which build students’ understanding of royal customs.

Number of Lessons: 8

Seasons and Weather

This is an introduction to weather and the seasons, where students learn that regions of Earth experience different characteristic weather patterns throughout the year.

Number of Lessons: 8

Columbus and the Pilgrims

A look at the first contact between Europe and the Americas and some of its results.

Number of Lessons: 9

Colonial Towns and Townspeople

Students are introduced to the early history of the United States as they explore what life was like for people in colonial times.

Number of Lessons: 10

Taking Care of the Earth

Students are introduced to the importance of environmental awareness and conservation as they become familiar with the earth’s natural resources.

Number of Lessons: 10

Presidents and American Symbols

Students learn about the legacies of five famous presidents, several national symbols, the branches of government, the role of the president, and elections.

Number of Lessons: 9

Students build phonological awareness through environmental noises, words within sentences, and sounds within words. They learn basic strokes used to form letters.

Students learn how to blend syllables together to form multisyllabic words. They orally produce two- and three-sound words by blending sounds.

Students learn eight new sounds and practice blending them into words. They learn how to write letters that represent the new sounds.

With oral language games, chaining exercises, and shared reading, students practice blending eight new sounds into words and writing the sound-letter correspondences.

Eight new sounds are introduced, including a spelling alternative for /k/. Students continue to practice previously learned sound-letter correspondences.

Students are introduced to consonant clusters, letter names, and rhyming words. Students begin to read text independently using decodable Student Readers.

Students learn about various digraphs. Students practice blending and segmenting the sounds through phonemic awareness and phonics activities, chaining exercises, and reading.

This unit introduces students to double-letter spellings for consonant sounds, as well as seven new high-frequency Tricky Words.

Students practice writing uppercase letters and learn 17 new Tricky Words. Students answer comprehension questions about stories in the Student Reader.

Students learn the basic code spelling for the five long vowel sounds. Students are administered a cumulative end-of-year assessment.

Fables and Stories

Students are introduced to fables and stories, increase vocabulary and reading comprehension skills, and become familiar with the key elements of a story.

Number of Lessons: 10

The Human Body

Students are introduced to the systems of the human body, care of the body, germs and disease, vaccines, and keys to good health.

Number of Lessons: 10

Different Lands, Similar Stories

Students encounter cultures from around the world as they explore the ways in which folktales from different lands treat similar themes or characters.

Number of Lessons: 9

Early World Civilizations

Students explore Mesopotamia and Egypt and learn about the importance of rivers, farming, writing, laws, art, and beliefs.

Number of Lessons: 16

Early American Civilizations

Students compare and contrast key features of the early civilizations of the Maya, Aztec, and Inca, and explore the development of cities.

Number of Lessons: 11

Astronomy

In this introduction to the solar system, students learn about Earth in relation to the moon, other planets, the sun, and the stars.

Number of Lessons: 9

The History of the Earth

Students learn about the geographical features of Earth’s surface, the layers of the earth, rocks and minerals, volcanoes, geysers, fossils, and dinosaurs.

Number of Lessons: 8

Animals and Habitats

Students focus on the interconnectedness of living things as they learn what a habitat is and explore specific types of habitats.

Number of Lessons: 9

Fairy Tales

Students learn about the Brothers Grimm, identify common elements of fairy tales, make interpretations, and compare and contrast different tales.

Number of Lessons: 9

A New Nation: American Independence

Students are introduced to important historical figures and events in the story of how the 13 colonies became an independent nation.

Number of Lessons: 12

Frontier Explorers

Students are introduced to exploration of the American West, its key figures, and how colonists spread westward, including their interactions with native peoples.

Number of Lessons: 11

Unit 1 provides a review of the sounds/spellings taught in the CKLA Kindergarten curriculum. Teachers administer the beginning-of-year assessment.

Students read and write words with long vowel spellings and learn new Tricky Words. The unit also includes grammar lessons on nouns.

Work continues on vowel sounds and their spellings. Grammar focus is on verbs and verb tense. Formal instruction in the writing process begins.

Students work with /r/-controlled vowel sounds. Students practice segmenting two-syllable words. Adjectives are introduced as students practice descriptive writing.

Students work with spelling alternatives for sounds. Students also learn to identify sentence types. They plan, draft, and edit opinion letters.

Students continue to work with several spelling alternatives for sounds. Students review nouns and pronouns. They plan, draft, and edit personal narratives.

Students focus on spelling alternatives for sounds. Students plan, draft, and edit an informative/explanatory text. Students are administered an end-of-year assessment.

Fairy Tales and Tall Tales

Students consider characteristic elements of fairy tales and tall tales and consider problems faced by the characters and lessons each story conveys.

Number of Lessons: 8

Early Asian Civilizations

Students are introduced to Asia, specifically India and China. In addition, students are introduced to related folktales and poetry.

Number of Lessons: 14

Ancient Greek Civilization

Students explore the civilization of ancient Greece, which lives on in many ways—in our language, government, art, architecture, the Olympics, and more.

Number of Lessons: 12

Greek Myths

Building on the Ancient Greek Civilization domain, students explore common characteristics and story elements of several well-known Greek myths and mythical characters.

Number of Lessons: 10

The War of 1812

Students are introduced to major figures and events in the War of 1812, sometimes called America’s “second war for independence.”

Number of Lessons: 8

Cycles in Nature

Students are introduced to natural cycles that make life on Earth possible, such as seasonal cycles, life cycles, and the water cycle.

Number of Lessons: 9

Westward Expansion

Students are introduced to an important period in the history of the United States—the time of westward expansion during the 1800s.

Number of Lessons: 9

Insects

Students learn about the helpful and harmful characteristics of insects, insect life cycles, and social insects such as bees and ants.

Number of Lessons: 8

The U.S. Civil War

Students learn about the controversy between the North and the South over slavery and about key historical figures during that time.

Number of Lessons: 11

Human Body: Building Blocks and Nutrition

Students learn about the human body, including body systems, good nutrition, keys to good health, and the advances in microbiology made by Anton van Leeuwenhoek.

Number of Lessons: 9

Immigration

Students explore the idea of e pluribus unum and the importance of immigration in the history of the United States.

Number of Lessons: 10

Women in early 20th-century clothing march with signs for voting rights and justice in front of a yellow bus labeled "Cleveland Ave.," making history that can inspire lessons in a K–2 language arts curriculum.
Fighting for a Cause

Students explore the connection between ideas and actions, and see how people can do extraordinary things to change the dominant ideas and actions of an entire nation.

Number of Lessons: 9

Un contorno simplificado de un gato saltando para atrapar una mariposa, sobre un fondo verde con varias ilustraciones relacionadas con gatos y palabras como "saltar" y "leche".

Sound-spellings with an emphasis on consonant sounds, one- and two-syllable words, and Tricky Words are reviewed. The beginning-of-year assessment is administered.

Ilustración de un animal verde sobre un fondo verde con varios objetos delineados como una cama, un conejo, una nube y sonidos fonéticos.

The unit focus is on various sound-spellings and words with one- and two-syllables. Students begin the writing process, writing narratives and opinions.

Fondo verde con el contorno blanco de un birrete de graduación en el centro, rodeado de varios garabatos educativos y relacionados con logros, como un trofeo, una cinta y una portería de fútbol.

Practice with spelling alternatives continues. Grammar focuses on capitalization, quotation marks, ending punctuation, and common and proper nouns. Students write personal narratives.

Ilustración de un paisaje urbano con varios símbolos que incluyen un tren subterráneo, una panadería, la Estatua de la Libertad y carteles que dicen "ahora contratando" y "ciudad/ee" sobre un fondo verde.

Students practice a range of spelling alternatives. Students practice persuasive writing as part of a friendly letter. Students learn more about nouns and verbs.

Students practice chunking sounds as they read multisyllabic words. Grammar work includes adjectives, subjects, and predicates. Writing includes rewriting a story ending.

Students review advanced phonics and grammar skills. Students are introduced to expository/report writing. Students take an end-of-year assessment.

Program components

The program includes instructional guidance and student materials for a year of instruction, with lessons and activities that keep students engaged every day.

Component

FORMAT

Knowledge Strand Teacher Guide

Knowledge Strand Teacher Guides contain Amplify CKLA’s cross-curricular read-alouds and application activities, all of which are standards-based to build mastery of content knowledge and literacy skills. There is one Teacher Guide per Knowledge Domain.

Print or digital

Knowledge classroom materials

Amplify CKLA includes oversized Flip Books and smaller Image Cards that bring each topic to life through vivid visuals.

Print or digital

Skills Strand Teacher Guide

Amplify CKLA Skills Strand Teacher Guides include comprehensive research-based instruction in phonological and phonemic awareness, phonics, print concepts, the alphabetic principle, grammar, writing mechanics, comprehension, spelling, and other critical foundational literacy skills.

Print or digital

Hands-on Skills ancillaries

Dynamic classroom materials include student Chaining Folders, Small and Large Letter Cards, Spelling Cards, Sound Cards, Big Books, Vowel and Consonant Code Flip Books, Code Charts, and more.

Print or digital

Assessment and Remediation Guide

The unit-by-unit Assessment and Remediation Guide provides thousands of pages of activities for reteaching, differentiation, and additional practice.

Print or digital

Digital experience

The Amplify CKLA digital experience delivers ready-made, customizable, slides-based lesson presentations to enhance instruction and save time. Everything needed to plan and present high-quality, engaging early literacy instruction is in one convenient place.

Digital

Component

FORMAT

Knowledge Strand Activity Books

Knowledge Strand Activity Books provide students with the opportunity to deepen world and word knowledge by responding to text in a diversity of ways.

Print

Skills Strand Student Reader

Unique decodable Student Readers provide direct practice with just-learned sound-spelling patterns, using compelling stories and characters to integrate phonics and comprehension.

Print

Skills Strand Activity book

Skills Strand Activity Books support the program’s connected approach to reading and writing, providing ample opportunities to respond to text while building core skills.

Print

Digital experience

The Amplify CKLA digital experience delivers ready-made, customizable, slides-based lesson presentations to enhance instruction and save time. Everything needed to plan and present high-quality, engaging early literacy instruction is in one convenient place.

Digital

Explore more programs

Our programs are designed to support and complement one another. Learn more about our related programs.

Administrators, welcome to Amplify Science!

Here you’ll find information about enrollment and licensing, technical requirements, professional learning resources, and more.

Onboarding: What to expect

Welcome to Amplify Science! There are six basic steps to onboarding. Use this visual as a reference, but also know that our dedicated implementation team will be there to support you during the entire process.

Technology requirements and guidelines

To ensure that your hardware and network meet the minimum technical requirements for performance and support of your curriculum products, please see Amplify’s customer requirements page.

You’ll also want to add the URLs on this page to the corresponding district- or school-level filters so that your teachers and students can access their Amplify Science materials.

Data sharing agreement

Partnering with Amplify through our data sharing program deepens learning outcomes and gives you the performance analysis you need to make impactful decisions within your district or school. By signing our data sharing agreement, your district will help us to better understand student performance as it relates to your state’s standards. It also allows us to compare results with the curriculum-embedded assessments and state-level assessments. These analyses will help you identify the areas where your teachers and students are excelling or may be experiencing challenges.

Stay tuned for additional updates.

Enrollment and licensing overview

During the enrollment and licensing call, your Amplify implementation partner will walk you through the enrollment process. We recommend exploring the enrollment web tool ahead of the call for suggestions on which enrollment method may be best for your district.

The following guides provide additional information about enrollment methods and the data sharing process.

Preparing for your materials

Each unit of Amplify Science comes with a hands-on materials kit.

Each hands-on materials kit arrives in 1–3 boxes and contains the following:

  • Consumable materials
  • Nonconsumable materials
  • Classroom wall materials
  • Premium print materials (cards, maps, etc.)
  • 18 copies of each Student Book (K–5)
  • A blackline master copy of the Student Investigation Notebook (K–5)

You can find complete materials lists for each unit in the following PDFs. This information is also available in the digital Teacher’s Guide within the program.

Once your district’s purchase order has been sent to Amplify and is processed, Amplify will provide tracking information on your materials kits and any additional print materials you’ve ordered.

Administrator Reports

Self-service Administrator Reports allow insight into teacher and student usage and student performance data for the current school year.

Access is limited to district and school administrators. Administrators can directly access these reports at my.amplify.com/admin-reports.

Get more information.

Announcements

Summer extension
With summer fast approaching, we recognize that some districts may be extending the school year and/or continuing the use of Amplify curriculum and programs for summer instruction. If your summer instruction will continue past June 30 and/or you need to make rostering or enrollment changes, follow our guidance on extending your rollover date.

Use stimulus funding to drive transformation
Learn about ESSER I, II, and III funding (or CARES, CRRSA, and ARP) and how to use these funds to help with learning recovery and acceleration. Districts have significant flexibility in how to use the ESSER money, with ESSER II and III specifying that some of the funds should be used to address unfinished learning. All Amplify programs and services meet the criteria for the funding. Get more information about funding and guidelines.

Next steps: How do I support my teachers?

Pre-launch checklist for teachers
Please share our Program Hub with your educators. It will provide helpful information as they prepare to implement Amplify in their classrooms, including a pre-launch checklist. Note that they’ll need to be logged into Amplify Science to access the Hub. If they don’t have a login yet, you can also download and share the  Amplify Science pre-launch checklist for teachers PDF.

Professional learning
We partner with every district to make sure the Amplify Science rollout meets their unique needs. Check out these sample agendas to get a better understanding of what our team has to offer.

Advice and answers
The Science help website is filled with step-by-step resources to address educators’ questions. Encourage your educators to read through these tutorials and search for topics they want to learn more about.

Contact us

Powerful (and free!) pedagogical support
Amplify provides a unique kind of support you won’t find from other publishers. We’ve developed an educational support team of former teachers and administrators who provide pedagogical support at no cost to educators using our programs. This free service includes:

  • Information on where to locate standards and other planning materials.
  • Recommendations and tips for day-to-day teaching with Amplify Science.
  • Support with administering and interpreting assessment data and more.

To reach our pedagogical team, click the orange icon while logged into the curriculum to get immediate help, call (866) 629-2446, or email edsupport@amplify.com.

Timely technical and program support
Our Customer Care and Support team is available Monday through Friday, 7 a.m. to 9 p.m. ET, and Sunday, 10 a.m. to 6 p.m. ET, through a variety of channels:

  • Live chat: Click the orange icon while logged into the curriculum to get immediate help in the middle of the school day.
  • Phone: Call our toll-free number: (800) 823-1969.
  • Email: Send an email to help@amplify.com.

Join our community
Our Amplify Science Facebook group is a community of Amplify Science educators from across the country. It’s a space to share best practices, ideas, and support on everything from implementation to instruction. Join today.

Daily math routines that spark student curiosity

It’s the educator’s eternal question: How do I keep students engaged?

When designing daily math practice, teachers are always working to make real-world math problems fresh and relevant, find new entrance points for concepts, or simply come up with surprises. All of these approaches can be very effective.

And though it may seem counter-intuitive, so can routines.

The power of instructional routine

The word routine can connote a sense of doing something mechanically, even without thinking. But teachers know that well-placed classroom routines can open opportunities for creative thought.

Routines provide a way for you and your students to build and maintain a sense of familiarity and structure throughout the school year. They also free up time teachers would otherwise spend giving directions. When students know exactly how a certain activity should run, and understand all instructions and expectations, everything goes more smoothly.

That’s why a core set of shared routines can be a powerful, practical force for establishing an effective classroom learning community..

Bringing math routine into the classroom

We know routines can be effective in any classroom. Now, we also have research offering direct evidence that certain routines are particularly effective in math classrooms.

Think-pair-share

Do you want your students to have more time to think before solving and sharing about a problem? 

GOAL: Provides opportunities to identify, compare, and contrast multiple strategies

TIP: During partnered discussion, consider displaying sentence frames such as, “ First they… Next they…” “Their strategy was to…” or “I see a/an… in both strategies.”.

How to do it:

  • Invite students to solve a problem that can be solved with multiple strategies. Then, display two or more different responses representing different strategies.
  • Give students time to analyze the strategies on their own and then invite them to discuss them with a partner.
  • Facilitate a class discussion to describe, compare, contrast, and connect the different strategies. Utilize open-ended questions like, “Why did different strategies lead to the same outcome?” or, “What was helpful about each strategy?”

Where to learn more

We worked with our curriculum team to develop routine cards for math teachers, so you can implement routines that are part of our math program in your classroom. Most of the routines you’ll find throughout Amplify Desmos Math have been specifically proven effective in math classrooms. All of them have been adapted from established teaching practices.

We invite you to access a sample set of some of our most popular routines and decide which ones to try out in your classroom!

Resources

Download free math instructional routine cards.

Explore Desmos Classroom.

Learn more about Amplify Desmos Math.

Collaborative learning strategies in math

Why is collaborative learning important?

Just ask this third grader: “It is important to work together, because when you work together you can get smarter by other people’s ideas.”

That just about sums it up!

Let’s take a closer look at what math looks like in a collaborative classroom, why collaboration matters, and how teachers can build a culture of collaboration for their K–8 math students.

What is collaborative learning in mathematics education?

Kristin Gray, executive director of Amplify’s math suite, is a veteran math teacher. (The answer above came from one of her very astute third graders.) And according to her, collaboration in math is so much more than just kids chatting. Gray paints a picture of collaborative math learning in elementary math and beyond as kids who are:

  • Grouped around a table, not isolated at separate desks.
  • Engaging in animated conversation.
  • Explaining their thinking and justifying their answers.
  • Comparing their various approaches.
  • Connecting math to their own lived experiences.
  • Connecting their ideas to the ideas of others.

Taken together, collaboration supports connections—among experiences, math concepts, and others’ ideas and experiences.

Collaboration means making the time and space to take these widely varied things that each student brings uniquely to our math classroom and bring them out in a really safe and collaborative culture.

– Kristin Gray, executive director of Amplify’s math suite

Why is collaborative learning important in math?

Substantial research shows that collaborative learning promotes active learning, critical thinking, communication skills, social development, a positive learning environment, deeper understanding of concepts, and preparation for real-life situations.

Gray cites a few findings in particular:

  • 2014 NCTM study found that mathematical conversations and discourse among students—at all grade and ability levels—helps build a shared understanding of mathematical ideas.
  • Hope A. Walter’s article “Beyond Turn and Talk: Creating discourse” (Teaching Children Mathematics, 2018) asserted that meaningful math discourse supports metacognition and teaches students how to discuss, debate, and reevaluate mathematical situations in a respectful manner .
  • 2018 NCTM study found that when students have the chance to analyze and compare each other’s approaches, any sense of hierarchy in the classroom is reduced and replaced with a classroom culture that values input from all students.

Hands-on math activities and more: Components of a collaborative classroom

What conditions best set up a math class for collaboration?

Above all, students need hands-on activities that truly engage—or, in Gray’s words, “tasks worth talking about.” Teachers should emphasize the importance of the process of getting to the answer, encouraging the sharing of “rough draft ideas” that students can develop together. Gray also recommends stopping the groups’ conversations before they’re done, so that they can reflect on what they’re doing rather than just report what they did.

Other resources:

Problem-based learning offers a powerful approach to collaborative learning in math. Our guide around making the shift to problem-based learning through Learning Labs will walk teachers through what problem-based learning is, why it’s critical to math instruction, and how to support the shift to this approach through Learning Labs. A tried-and-true STEM strategy that Gray has often used with teachers, Learning Labs break the typical mold of siloed professional development days by encouraging collaborative professional learning within the classroom!

Desmos Classroom lessons

Desmos Classroom activities let students share their thinking with each other. The teacher dashboard provides educators a window into this thinking in real time, as well as a powerful toolkit to turn those ideas into still more productive conversations and effective learning. Check out all the Featured Collections Desmos Classroom has to offer.

More to explore

Strengthening critical thinking with a content-first approach: How Amplify CKLA is closing gaps in an elementary classroom

In my first-grade classroom, we’ve been studying early world civilizations. My students and I have pretended to hop in our time machines and travel back—first to ancient Mesopotamia, then to ancient Egypt. We’ve written our names on clay tablets in cuneiform and learned what it means for a religion to be polytheistic. We’ve compared and contrasted early farming systems and places of worship. As I prepared to read aloud another lesson a few days ago, I mentioned to the class that it was the eleventh lesson in the unit of study, prompting widened eyes and a chorus of “Already!?

I teach eighteen six- and seven-year olds in a Title I school, where half of the students are low-income, 75% are non-white, and over half are multilingual/English learners or speak another language at home. In my job, I’m honored to empower students who schools and society have not always served well. I became a teacher to help end that inequity—to close the knowledge gap and ensure that low-income, non-white, and immigrant children receive the tools they need to build a bright future. A growing body of research tells us that a strong base of content knowledge is essential for student growth and success in literacy. We also know that students who come from low-income backgrounds are less likely to come to school possessing the academic background knowledge of their peers, presumably because they have more limited opportunities to come across this type of knowledge at home. For this reason, I’m grateful that around a year and a half ago, my district adopted the knowledge-based literacy curriculum CKLA.

Scenes from a knowledge-based curriculum

What does knowledge-based learning look like in practice? Here’s one powerful example of how a knowledge-forward lesson helped my students succeed in practicing an important literacy skill. We were reading about Howard Carter, the British archaeologist who wanted to locate Tutenkhaman’s tomb. The lesson lends itself well to one of our state’s curriculum standards for the quarter: to make and confirm predictions about nonfiction text. Part one of the Read-Aloud ends on a cliffhanger: After a years-long search with no success, encountering dead ends and tomb robbers, Carter uncovers a hidden door marked with a royal seal.

“A prediction,” I explained, “is a careful guess about what you think might happen, based on the clues you already know. Think about what you know from the story, and predict what Carter might find behind the door.” We quickly reviewed some of the main points as I scribed on chart paper: Carter had been searching for Tutenkhaman’s tomb for six years, pharaohs were often buried with treasure or gold, the door they found was in the last possible place to look in the Valley of the Kings. I handed out papers I’d prepared with sentence frames for students to record or dictate their ideas. We hadn’t yet spent much time this year explicitly practicing prediction-making—in fact, I wondered how many of my students even knew what the word prediction meant—but I could see the wheels already turning behind most of my students’ eyes as they wiggled with excitement, envisioning gold, ghosts, King Tut’s tomb, or a pile of bones.

“Maybe nothing,” one student—a six-year-old who speaks primarily Spanish at home—told me with a shrug as I helped him write down his ideas. “Maybe the tomb robbers took it all.”

How to improve critical thinking—with knowledge

Even though my students might or might not have been familiar with the literacy skill of making and confirming predictions, the rich and meaty Read-Aloud set them up for success. It was rife with topics of interest to many a six- or seven-year-old—exploration, tomb robbers, golden treasure, mummies—which kept them engaged. And it included plenty of details through which they could actually draw a meaningful inference about what Carter might have found. I had to explain only once that a prediction should be based on information you already have—not a random guess—and every one of my eighteen students successfully generated a plausible idea.

This is the magic of a knowledge-based curriculum. It levels gaps in learning by generating a rich, shared base of content knowledge that supports the development of key literacy skills. My students were successful in plausibly guessing what might happen next in the story because they had a strong grasp of the information about Howard Carter. I might have chosen to teach an entire mini-lesson on prediction-making first and then asked my students to apply the skill to a less thoughtfully selected text, or to an independently selected book on their own, but if they weren’t already familiar with the topics it covered, my guess is that they would have been far less successful.

The curriculum standards for literacy in both the Common Core and Virginia (my school’s state) emphasize critical thinking skills and specific comprehension strategies, such as inferencing, over content knowledge. This is understandable: Students must learn to make meaning of a text in front of them, not just read the words on the page. But as Natalie Wexler puts it, “The ability to think critically…is inextricably linked to how much knowledge you have about the situation at hand” (The Knowledge Gap, 39). How could my students make a prediction about a future event in a text if they didn’t understand the textual clues they were given in the first place? Especially given that students from low-income homes are likely to possess less background knowledge about the curriculum they will encounter in school, a focus on teaching skills in isolation can contribute to a far-from-level playing field.

Teaching “comprehension skills” first and then expecting students to apply them is common practice in the method of literacy instruction frequently referred to as balanced literacy. Though the conversation about literacy is, thankfully, moving toward a research-backed approach focused on the Science of Reading, we still have a long way to go. While student teaching during my education master’s program less than three years ago, I was encouraged to teach mini-lessons on topics such as “finding the main idea” and “using topic headings to understand,” which students would then practice with independently selected texts. This approach is not supported by research as a best practice—and it assumes a shared base of cultural knowledge. In that way, it entrenches inequality by privileging students who may already possess more background knowledge, allowing our most vulnerable learners to fall even further behind.

By contrast, a knowledge-based curriculum creates that base together, giving all students a better chance at success. My own experience confirms the research. CKLA empowers my students to take ownership of their learning, expand their vocabularies, make connections, and passionately engage. I’m grateful to use an evidence-based curriculum designed to ensure that every student—including those too often left behind by our schools and other institutions—can learn to read.

More to explore

Engaging digital and print math lessons for K–12 educators

Remember memorizing? That is, being a student in a math classroom focused mainly on teacher lectures, repetitive problem sets, and rote memorization?

Fortunately for today’s students, educators are increasingly recognizing that when it comes to math curriculum, engagement must come first—and that when it does, better learning outcomes follow. This shift toward student-centered, engaging math instruction is paving the way for deeper understanding, greater retention, and even a lifelong love of math.

Engaged students develop a deeper understanding of math concepts, retain information better, think critically, and are more likely to solve problems creatively. They tend to have a more positive attitude toward math, which reduces potential math anxiety and helps them build confidence. What’s more, access to engaging math programs promotes collaborative learning and the development of communication skills, supporting students in all classrooms (and beyond).

That’s why it’s important to find math products, activities, and instructional materials that center student engagement. Students need tools designed to not just teach them how to calculate, but also actively involve them in their own learning journeys, making math both meaningful and fun.

Free math lessons and more: Meet Desmos Classroom

Built by a dedicated team of math educators, Desmos Classroom is a free teaching and learning platform packed with interactive lessons that place student engagement at the center of instruction.

What are Desmos Classroom activities like in practice? Well, for starters, students take control of their learning! Students learn by interacting with mathematical representations, illustrations of the world, and their classmates. They represent their developing ideas with sketches, text responses, card sorts, number responses, multiple-choice questions, and more.

With a free account, you can access both customizable and pre-made Desmos Classroom—with new content appearing frequently for you to add to your lesson plans. An easy-to-use dashboard and real-time visuals allow you to monitor and react to student work. Creative teacher facilitation tools also help you promote collaborative and intentional classroom conversations. For example, the optional Anonymize feature reduces self-consciousness and competition, encouraging all students to participate and interact freely. Check out more examples below!

K–5 Lesson: Awesome Aquariums

A laptop screen displays a bar graph comparing aquarium animal numbers (goldfish, frogs, shrimp) with the prompt "Compare: How are the representations similar or different?" This visual aid is an integral part of comprehensive math programs designed to enhance analytical skills.

In the Awesome Aquariums activity, students experiment with bar graphs and tape diagrams to represent and compare the quantities of various aquatic inhabitants. Teachers guide students in a Notice and Wonder activity, with an optional Think-Pair-Share.

6–12 Lesson: DinoPops

A computer screen displays an educational activity about making scaled copies of DinoPops in different box sizes. Perfect for math teachers, the activity involves completing a table for box width and height.

In the DinoPops activity, students use proportions to understand what size boxes will fit (proportionally) varying sizes of Dino Pops. They’ll understand how graphs can represent proportional relationships, use graphs to make predictions, and use communications skills to describe and defend their work.

How you can get started

Create a free Desmos Classroom account at teacher.desmos.com, then check out the on-demand webinar Intro to Desmos Activities to learn how to assign a free pre-made lesson to students and use features such as anonymizing the class, pacing students during a lesson, and pausing classroom work to facilitate conversation. You can also register for another upcoming Desmos Classroom webinar to learn more about our full suite of math offerings, including our new, curiosity-driven K–12 program, Amplify Desmos Math.

Welcome, K–8 Reviewers!

We’re honored to introduce you to Amplify Desmos Math California. We’re confident you’ll find this comprehensive program to be a powerful tool for bringing the vision of the California Math Framework to life in classrooms across the state.

Please start with the video on the right to learn how to navigate the program and access key features referenced within our submission. Below you’ll find additional resources to support your review.

Your Review Samples

As a curriculum that incorporates both print and digital resources, it’s important that you explore both our physical materials (delivered to you in grade-specific tubs) and our digital materials (accessible through our platform). We invite you to explore both types of resources using the instructions and tips below.

Print Samples

Your print samples should have arrived in grade-specific tubs with a copy of two Reviewer binders. The K-5 Reviewer binder is contained within the Grade K shipping box and the Grade 6-8 Reviewer binder can be located in the Grade 6 shipping box. As you begin the process of organizing your materials, please refer to the inventory checklist found inside each tub as well as within your Reviewer Binder.

Digital Samples

In order to access your digital samples, you’ll need to log into our platform using your unique login credentials found on a Digital Access Flyer inside of your Reviewer Binder. Once you have located the flyer:

  • Click the orange button below to access the platform.
  • Click “Log in with Amplify.”
  • Enter the username and password provided on your Digital Access Flyer.

Navigation Tips

Below you will find helpful tips for navigating Amplify Desmos Math California. We recommend reading these pages alongside the program’s print materials and digital experience to gain a deeper understanding of the program. 

Click the links below to read about navigating program features including:

Built for California

The Amplify Desmos Math California program is designed around the vision articulated in the California Mathematics Framework to enable all California students to become powerful users of mathematics. Our program incorporates the latest research in student learning, meaning that we:

  • Focus on the Big Ideas: Amplify Desmos Math California’s courses, units, and lessons are centered around the Big Ideas. Big Ideas, like standards, are not considered in isolation. In addition to each unit and lesson’s focal Big Ideas, Amplify Desmos Math California also provides connections among the Big Ideas across units and lessons.
  • Center on open and engaging tasks: Amplify Desmos Math California is grounded in engaging tasks meant to address students’ often-asked question: “Why am I learning this?”  Students are invited into learning with low-floor, high-ceiling tasks that provide an entry point for all. Open tasks in Amplify Desmos Math California provide the space for students to try on multiple strategies and represent their thinking in different ways, and allow student explanation and discussion to serve as the center of the classroom. All lessons offer both print and digital representations of lessons.
  • Provide enhanced digital experiences: Amplify Desmos Math California includes digitally-enhanced lesson activities, incorporating interactive digital tools alongside print materials. These purposefully-placed resources allow students to visualize mathematical concepts, receive actionable feedback while practicing, encounter personalized learning support from an onscreen tutor, and engage in discussions about their thinking and approaches.
  • Treat core instruction and differentiation as integral partners: The Amplify Desmos Math California curriculum provides teachers with lessons, strategies, and resources to eliminate barriers and increase access to grade-level content without reducing the mathematical demand of tasks. Every activity has multiple entry points to ensure that all students are supported and challenged. Intervention and personalized learning activities are directly connected to lesson content and offer students the individualized support as they dive into the mathematics.

Category 1: Mathematics Content/Alignment with the Standards

Standards Maps

The links below provide the Standards Maps for Amplify Desmos Math California for each grade level.

Evaluation Criteria Map

Linked here is the Evaluation Criteria Map for grades K–8. Please note that you will need to be logged into the digital platform to access the links in the Evaluation Criteria Map.

Standards for Mathematical Practice

The links below provide the alignment of Amplify Desmos Math California to the Standards for Mathematical Practice at each grade level.

Drivers of Investigation and Content Connections

Amplify Desmos Math California incorporates the Drivers of Investigation (DIs) and Content Connection (CCs) throughout the program. Throughout the year, students engage with open and authentic tasks of varying durations — from lesson activities to unit-level Explore lessons and longer course-level Investigations. Every lesson and investigation opportunity is grounded around the why, how, and what of the learning experience, and helps teachers bring mathematical concepts to life. 

A three-column chart details: Drivers of Investigation, Standards for Mathematical Practice, and Content Connections, each with their respective codes and brief descriptions.

California English Language Development Standards

The links below provide the alignment of Amplify Desmos Math California to the California English Language Development Standards at each grade level.

California Environmental Principles and Concepts

Select lessons, performance tasks, and investigations across grade levels in Amplify Desmos Math California are aligned to one or more of the California Environmental Principles and Concepts. Click the links below to view how the California Environmental Principles and Concepts are represented in each grade level.

Category 2: Program Organization

Amplify Desmos Math California thoughtfully combines conceptual understanding, procedural fluency, and application. Each lesson is designed to tell a story by posing problems that invite a variety of approaches before guiding students to synthesize their understanding of the learning goals.

Big Ideas

Amplify Desmos Math California’s courses, units, and lessons are centered around the Big Ideas. In addition to each unit and lesson’s focal Big Ideas, Amplify Desmos Math California also provides connections among the Big Ideas across units and lessons. Please refer to Keeping the Big Ideas at the Center (linked below) for specific lesson designs and alignment with the Big Ideas for each grade level.

Program Structure

Amplify Desmos Math California combines the best of problem-based lessons, intervention, personalized practice, and assessments into a coherent and engaging experience for both students and teachers.

A diagram showing three stages: Core instruction, Integrated personalized learning, and Embedded intervention, under Screening and progress monitoring with daily tiered support.

Lessons and units in Amplify Desmos Math California are designed around a Proficiency Progression, a model that steps out problem-based learning by systematically building students’ curiosity into lasting grade-level understanding.

Five steps for learning: 1. Activate prior knowledge, 2. Collaborate, 3. Refine ideas, 4. Guide to understanding, 5. Practice and extend for lasting understanding.

In the Proficiency Progression, lessons begin by activating students’ natural curiosity and offering opportunities to generate new ideas through collaboration. Teachers are then able to refine ideas through intentional facilitation and guide students to grade-level understanding, while students retain the ability to use different strategies and methods to show their comprehension of the content. Students are provided ample opportunities to develop lasting understanding.

Scope and Sequence

Below you can view the scope and sequence for each grade level. 

A chart displaying seven kindergarten math units with themes, number of instructional days, and assessment days, totaling 136 suggested instructional days.
Grade 1 instructional units overview showing 7 units on math topics, total suggested days is 153, with each unit listing instructional and assessment days.
Grade 2 math curriculum map showing 8 units with topics, number of instructional and assessment days, and total days; suggested instructional days: 156.
Seven instructional units are shown, each with a title, icon, number of instructional and assessment days, and total days; a note suggests 150 instructional days in total.
A Grade 4 math curriculum overview showing seven units with titles, number of instructional days, and assessment days; the suggested total instructional days is 152.
A curriculum map displays seven math units with icons, titles, instructional days, and assessment days, totaling 149 suggested instructional days.
A chart showing Grade 6 math units, each with instructional days, assessment days, and optional days. Total suggested instructional days is 142, plus 19 optional days.
Overview of Grade 7 math curriculum units, showing unit titles, number of instructional, assessment, and optional days for each, with a total of 125 instructional days plus 22 optional days.
Eight illustrated cards display Grade 8 math units, each with the unit title, topics covered, number of instructional and assessment days, and a total of 131 suggested instructional days.
Curriculum chart showing eight units split into two volumes, with topics, instructional days, assessment days, and optional days listed for each unit over an accelerated 6th-grade year.
A chart displays the breakdown of Accelerated 7 math units, indicating topics, number of instructional days, assessment days, and optional days for each of the nine units across two volumes.

Lesson Design and Structure

A four-part diagram shows: Warm-Up, Activities with a graph of student ideas to grade-level understanding, Synthesis with notes, and Practice and differentiation with students building a structure.

Amplify Desmos Math California is designed with a structured approach to problem-based learning that systematically builds on students’ curiosity and allows students to grapple with the Big Ideas of the California Framework. Every lesson activity is organized into a Launch, Monitor, Connect format.

  • Launch: The launch is a short, whole-class conversation that creates a need or excitement, provides clarity, or helps students connect their prior knowledge or personal experience, which ensures that everyone has access to the upcoming work.  
  • Monitor: As students work individually, in pairs, or in groups, teachers explore student thinking, ask questions, and provide support to help move the conversations closer to the intended math learning goal. 
  • Connect: Teachers connect students’ ideas to the key learning goals of the lesson, facilitating class discussions that help synthesize and solidify the Big Ideas 

Each lesson within Amplify Desmos Math California follows the same structure. 

  • Warm-Up: Every Amplify Desmos Math California lesson begins with a whole class Warm-Up. Warm-Ups are an invitational Instructional Routine intended to provide a social moment at the start of the lesson in which every student has an opportunity to contribute. Warm-Ups may build fluency or highlight a strategy that may be helpful in the current lesson or act as an invitation into the math of the lesson.
  • Lesson Activities: Each lesson includes one or two activities. These activities are the heart of each lesson. Students notice, wonder, explore, calculate, predict, measure, explain their thinking, use math to settle disputes, create challenges for their classmates, and more. Guidance is provided to help teachers launch, monitor, and connect student thinking over the course of the activity.
  • Synthesis and Show What You Know: The Synthesis is an opportunity for the teacher and students to pull all the learning of the lesson together into a lesson takeaway. Students engage in a facilitated discussion to consolidate and refine their ideas about the learning goals, and the teacher synthesizes students’ learning. Show What You Know is a daily assessment opportunity for students to show what they know about the learning goals and what they are still learning.
  • Centers (K–5): Centers are hands-on activities for students in grades K–5 to play collaboratively to strengthen their understanding of key skills and concepts. In grades K–1, students have Daily Center Time built into every lesson. 
  • Practice and Differentiation: Daily practice problems for the day’s lesson are included both online and in the print Student Edition, including fluency, test practice, and spiral review.

Kindergarten–Grade 1

A lesson plan timeline showing phases: Warm-Up (5–10 min, whole class), Lesson Activities (25–30 min), Synthesis (10 min), Centers (15 min), and Practice (time varies).

Grades 2–5

A horizontal flowchart shows a classroom lesson sequence: Warm-Up (5–10 min), Lesson Activities (35 min), Synthesis (10 min), and Practice (time varies); groupings vary.

Grades 6–8

A horizontal timeline shows four lesson segments: Warm-Up (5 min), Lesson Activities (30 min), Synthesis (10 min), and Practice (time varies).

Routines

Amplify Desmos Math California features a variety of lesson routines. Instructional routines and Math Language Routines (MLRs) are used within lessons to highlight student-developed language and ideas, cultivate conversation, support mathematical sense-making, and promote meta-cognition. Both are called out at point-of-use within the Teacher Edition and Teacher Presentation Screens. Below are the types of routines used throughout the Amplify Desmos Math California curriculum:

  • MLR1: Stronger and Clearer Each Time
  • MLR2: Collect and Display
  • MLR3: Critique, Correct, Clarify
  • MLR5: Co-Craft Questions
  • MLR6: Three Reads
  • MLR7: Compare and Connect
  • MLR 8: Discussion Supports
  • Decide and Defend
  • Notice and Wonder
  • Number Talk
  • Tell a Story
  • Think-Pair-Share
  • Which One Doesn’t Belong?

Category 3: Assessments

A variety of performance data in Amplify Desmos Math California provides evidence of student learning, while helping students bolster their skills and understanding.

Unit-Level Assessment

Amplify Desmos Math California has embedded unit assessments that offer key insights into students’ conceptual understanding of math. These assessments provide regular, actionable information about how students are thinking about and processing math, with both auto-scoring and in-depth rubrics that help teachers anticipate and respond to students’ learning needs.

  • Pre-Unit Check: Each unit in grades 2–8 begins with a formative assessment designed to identify the student skills that will be particularly relevant to the upcoming unit. This check is agnostic to the standards covered in the following unit and serves not as a deficit-based acknowledgment of what students do not know, but rather as an affirmation of the knowledge and skills with which students come in.
  • End-of-Unit Assessment: Students engage with rigorous grade-level mathematics through a variety of formats and tasks in the summative End-of-Unit Assessment. A combination of auto-scored (when completed digitally) and rubric-scored items provides deep insights into student thinking. All Amplify Desmos Math California End-of-Unit Assessments include two forms.
  • Sub-Unit Quizzes: Sub-Unit Quizzes are formative assessments embedded regularly in Grades Kindergarten through Algebra 1. In these checks, students are assessed on a subset of conceptual understandings from the unit, with rubrics that help illuminate students’ current understanding and provide guidance for responding to student thinking.
  • Sub-Unit Checklists: These checklists enable teachers to observe key skills and concepts that cannot be assessed on a pencil-and-paper assessment in Kindergarten–Grade 1. The checklists outline the supports students need to achieve mathematical growth and success.
  • Performance Tasks: At the end of each unit in grades 3–8, there is a summative assessment performance task provided to evaluate students’ proficiency with the concepts and skills addressed in the unit. 

Lesson-Level Assessments

Amplify Desmos Math California lessons include daily moments of assessment to provide valuable evidence of learning for both the teacher and student. Beyond formative, summative, and benchmark assessments, students also have opportunities for self-reflection with Watch Your Knowledge Grow. Students take ownership of their learning by reflecting and tracking their progress before and after each unit.

  • Show What You Know: Each lesson has a daily formative assessment focused on one of the key concepts in the lesson. Show What You Know moments are carefully designed to minimize completion time for students while maximizing daily teacher insights to attend to student needs during the following class. 
  • Responsive Feedback™: Teachers have the ability to see and provide in-the-moment feedback as students progress through a digital lesson. Responsive Feedback motivates students and engages them in the learning process.

Diagnostic Assessment

Every grade level features an asset-based diagnostic assessment designed to be administered at the beginning of the year.  Delivered digitally and to the whole class, our diagnostic assessment is uniquely designed to reveal underlying math thinking and identify what students know about grade-level math. With data beyond just right and wrong, teachers have the type of deeper level of insights need to take the right next step.

CAASPP-Aligned Assessment Preparation

Amplify Desmos Math is designed to support students’ mathematical development through problem-based learning, differentiation, and embedded assessments. The program’s emphasis on conceptual understanding, procedural fluency, and application aligns with the mathematical practices and content standards assessed by the CAASPP.

Amplify Desmos Math California includes a CAASPP-aligned Item Bank. This standards-aligned bank of questions allows teachers to filter and search by grade and standard to find items. Once assigned on the digital platform, students will experience CAASPP-like practice with the online digital tools.

Data and Reporting

Amplify Desmos Math California provides teachers and administrators with unified reporting and insights so that educators have visibility into what students know about grade-level math—and can plan instruction accordingly for the whole class, small groups, and individual students. Reporting functionality integrates unit assessments, lesson assessments, diagnostic data, and progress monitoring for a comprehensive look at student learning. Program reports show proficiency and growth by domain, cluster, standard, and priority concept using performance data from unit assessments, then highlight areas of potential student need to allow teachers to modify their instruction and target differentiated support.

Administrator reporting provides a complete picture of student, class, and district performance, allowing administrators to implement instructional and intervention plans.

Category 4: Access and Equity

The Amplify Desmos Math California curriculum provides teachers with lessons, strategies, and resources to eliminate barriers and increase access to grade-level content without reducing the mathematical demand of tasks. Our lessons are developed using the Universal Design for Learning (UDL) framework to proactively ensure that all learners can access and participate in meaningful, challenging learning opportunities.

Every activity has multiple entry points to ensure that all students are supported and challenged. Intervention and personalized learning activities are directly connected to the day’s content and offer students the individualized supports they need to be successful.

Each lesson and unit contains guidance for teachers on how to identify students who may need support, students who need to keep strengthening their understanding, and students who may be ready to stretch their learning. In addition, teachers are provided with recommendations for resources to use with each group of students.

Universal Design for Learning

Each lesson in the program incorporates opportunities for engagement, representation, action, and expression based on the guidelines of Universal Design for Learning (UDL).

  • Multiple Means of Engagement: Students engage in both print and digital learning, and are regularly participating in discussions and hands-on activities. Students are invited to build their own challenge for other students to solve, which provides opportunities for choice and
    autonomy, as well as joy and play.
  • Multiple Means of Representation: Students are encouraged to demonstrate their learning using mathematical representations, both print and digital, and regularly engage with their peers in analyzing multiple possible solutions. Classes engage in open-ended discussions about what individual students notice and wonder about mathematical concepts.
  • Multiple Means of Action and Expression: Learners differ in how they navigate learning environments and express what they know. Students can communicate their ideas in multiple ways, including in print, sketching, uploading photos, or recording an audio response.

Accessibility

Lesson facilitation supports

Every lesson includes at least one specific suggestion the teacher can use to increase access to the lesson without reducing the mathematical demand of the tasks. These suggestions address the following areas:

  • Visual-spatial processing
  • Conceptual processing
  • Executive functioning
  • Memory and attention
  • Fine motor skills

Accessibility tools

Students have the ability to control accessibility tools so that each learning experience is customized to their individual needs. In many instances, these tools can be turned on or off at any point of instruction.

  • Text to speech: Reads text instructions to students in multiple languages
  • Enlarged font: Increases the size of all text on screen
  • Braille mode: Includes narration of digital interactions
  • Language selection: Toggles between languages

Differentiation: In-Lesson Teacher Moves

Within every lesson activity, teachers can use the suggestions in the Differentiation Teacher Moves table to provide in-the-moment instructional support while students are engaged in the work of the lesson. This table can help teachers anticipate the ways students may approach the activity, and provides prompts that they can use during the lesson to Support, Strengthen, and Stretch individual students in their thinking. Teachers are provided with clear student actions and understanding to look for, each matched with immediately usable suggestions for how to respond to the student thinking illustrated in each row of the table. In addition to using these suggestions in the moment as teachers monitor student work, teachers can review the Differentiation table in advance to help them anticipate how students are likely to approach the activity.

A table showing differentiation teacher moves with examples of representing groups in different ways, support prompts, and a stretch question about patterns with more teams.

Differentiation: Beyond the Lesson

Teachers are provided with recommendations for resources to use with each group of students needing support, strengthening, and stretching after each lesson. Support, Strengthen, and Stretch resources include:

  • Mini-Lessons: 15-minute, small-group direct instruction lessons targeted to a specific concept or skill
  • Item Banks: Space for teachers to create practice and assessments by using filters and searching for standards, summative-style items, and more
  • Fluency Practice: Adaptive, personalized practice built out for basic operations and more
  • Centers (K–5): Lesson-embedded routines and practice for students that are vertically aligned across grade levels
  • Extensions: Lesson-embedded Teacher Moves including possible stretch questions and activities for students
  • Lesson Practice: Additional practice problems support every lesson
  • Math Adventures: Strategy-based math games where students engage with math concepts and practice skills in a fun digital environment
  • Lesson Summary Support: Support for students and caregivers that provides efficient explanation of the learning goal with clear examples

Math Identity and Community

The Math Identity and Community feature supports teachers in helping students build confidence in their own mathematical thinking, develop skills to work with and learn from others when doing math, and learn how math is an interwoven part of their broader community. The embedded prompts throughout the lessons are designed to highlight what it means to be good at math, the value of sharing ideas, and the power of flexible and creating thinking. Here are some examples of the Math Identity and Community supports embedded in each lesson:

  • I can be all of me in math class. You will work with partners every day in math class. What do you want your partners to know about you? 
  • We are a math community. What does good listening look like and sound like in a math community? 
  • I am a doer of math. What math strengths did you use today?

Unit Stories

Every unit in grades K–5 contains a Unit Story. These Unit Stories are brief fiction stories read aloud by the teacher at the beginning of each unit that connect to the math of the unit and introduce characters that students will get to know as they engage in the unit. Teachers read the story aloud from their Teacher Edition while projecting illustrations for students from the story, found in the Teacher Presentation Screens for the story. Across the unit, the Unit Story context and characters are used at appropriate points to inspire and engage students in the math as well as in reflections about their math identity and community.

Math Language Development

Every lesson in Amplify Desmos Math California includes opportunities for all students to develop mathematical language as they experience the content. Amplify Desmos Math California purposefully progresses language development from lesson to lesson and across units by supporting students in making their arguments and explanations stronger, clearer, and more precise. This systematic approach to the development of math language can be broken down into the following four categories of support:

  • Vocabulary: Units and lessons start by surfacing students’ language for new concepts, then building connections between their language and the new vocabulary for that unit. This honors the language assets that students bring into their learning.
  • Language goals: Language goals attend to the mathematics students are learning, and are written through the lens of one or more of four language modalities: reading, writing, speaking, and listening.
  • Math Language Routines: Math Language Routines are used within lessons to highlight student-developed language and ideas, cultivate conversation, support mathematical sense-making, and promote meta-cognition.
  • Multilingual/English learner supports: Supports for multilingual/English learners (ML/ELs) are called out at intentional points within each lesson. These specific, targeted suggestions support ML/ELs with modifications that increase access to a task, or through development of contextual or mathematical language (both of which can be supportive of all learners). 

Multilingual and English Learner Supports

Amplify partnered with the English Learner Success Forum (ELSF), a national nonprofit organization that advocates for high-quality instructional materials that are inclusive of multilingual learners. ELSF reviewed Amplify Desmos Math California, and provided directional guidance and feedback to ensure that the program reflects their research-based instructional strategies for multilingual/English learners.

Our Math Language Development Resources book contains lesson-specific strategies and activities for all levels of English Learners (i.e., Emerging, Expanding, Bridging). With support for every lesson, teachers are empowered to help all students, regardless of their language skills, to participate fully, grasp the material, and excel in their mathematical journey.

Amplify Desmos Math California includes a digital glossary for languages other than Spanish. Translations will be provided for up to nine languages.

Amplify Desmos Math California will include Spanish student-facing materials beginning in the 2026–27 school year.

Category 5: Instructional Planning and Support

Amplify Desmos Math California includes a variety of embedded instructional supports to empower teachers to lead effectively and gain actionable insights into student growth and progress. Teachers are equipped with a comprehensive set of resources designed to fulfill the requirements of Category 5.

Within the Teacher Edition front matter:

  • Scope and sequence
  • Big Ideas, Drivers of Investigation, and Content Connections
  • Grade level standards
  • Standards for Mathematical Practice
  • English Language Development Standards
  • Environmental Principals and Concepts

Within each Unit and Sub-Unit Overview:

  • Big Ideas, Drivers of Investigation, and Content Connections
  • Math that Matters Most
  • Grade level standards
  • Standards for Mathematical Practice
  • English Language Development Standards
  • Environmental Principals and Concepts

Within each Lesson:

  • Big Ideas, Drivers of Investigation, and Content Connections
  • Grade level standards
  • Standards for Mathematical Practice
  • English Language Development Standards
  • Environmental Principals and Concepts

At the course level (within the Teacher Edition front matter):

  • Navigating the Program (both print and digital)
  • Facilitating Lesson Activities with Launch, Monitor and Connect
  • Overview of the Digital Facilitation Tools

At the lesson level:

  • Suggestions for timing
  • What materials to prep
  • How to organize and group students 
  • Key lesson takeaways with the Synthesis
  • Recommendations for Differentiation
  • Strategies for intervention and extensions (in the Intervention, Extensions, and Investigation Resources book)

At the activity level:

  • Differentiation recommendations
  • Accessibility tips
  • ML / EL tips
  • Teacher look-fors
  • Recommended Teacher Moves
  • Prompts for guiding student thinking 
  • Sample student responses

A variety of language development supports are provided within the Student and Teacher Editions and Math Language Development Resources book. 

At the lesson level:

  • Diagrams and visuals
  • Sentence frames and word banks
  • Graphic organizers, including Frayer models
  • Vocabulary routines
  • Embedded language supports aligned to the CA ELDs
  • Lesson-specific strategies for Emerging, Expanding, and Bridging

At the unit level: 

  • Words With Multiple Meanings
  • Contextual vocabulary

At the course level:

  • English/Spanish cognates
  • Multilingual Glossary 
  • Additional Practice Resources book
  • Assessment Resources book 
  • Assess and Respond guidance paired with each assessment opportunity
  • Show-What-You-Know activities
  • Answer keys and rubrics 
  • Performance tasks

End-of-year data show significant reading gains for students receiving consistent, high-impact tutoring in school districts across nation

BROOKLYN, NY (October 31, 2023) — Amplify, a publisher of next-generation curriculum and assessment programs, shared a research brief on national end-of-school-year (EOY) reading data for K–5 students in several districts engaged in Amplify Tutoring. The data reveal that students who received high-dosage tutoring were more likely to make outsized gains in reading and narrow skills gaps on a nationally normed reading assessment compared to similarly at-risk peers who attended the same schools but did not participate in tutoring.

According to the data, during the 2022–23 school year, students who scored well-below or below benchmark on the nationally-normed mCLASS® DIBELS 8th Edition assessment (an indicator that students are not on track for grade-level reading proficiency) and attended Amplify Tutoring sessions regularly demonstrated significant growth.

Compelling growth was demonstrated in districts using both Amplify’s tutors and district-sourced tutors from the local community to deliver mCLASS Intervention lessons for elementary tutoring programs with coaching and training provided by Amplify.

  • Within a single semester in a Midwest urban district, 36% of K–2 students and 37% of grade 3–5 students who scored well-below or below benchmark at the beginning of the semester and regularly attended Amplify Tutoring achieved above-average or well-above-average growth compared to national norms on mCLASS DIBELS 8th Edition. In comparison, only 25% of similarly at-risk readers in the same schools who did not participate saw gap-closing growth during the same semester.
  • In a large, urban district in the West, 58% of the K–2 students who started the semester scoring well-below benchmark or below benchmark on mCLASS DIBELS 8th Edition and attended full-service Amplify Tutoring sessions more than twice a week, on average, made above-average or well-above-average growth, compared to national norms. Comparatively, only 42% of similarly at-risk peers who attended the same schools but did not participate in Amplify Tutoring made gap-closing growth.
  • In a large, urban Northeast district implementing Amplify Tutoring’s full-service solution for kindergarten through 5th grade students, 23% of at-risk readers who participated in Amplify Tutoring at least once per week changed risk levels by moving from well-below and below benchmark at the beginning of year to at or above benchmark by the end of the year. In comparison, only 14% of similarly at-risk peers in the same schools who were not participating in Amplify Tutoring changed performance level.

In the state of Texas, students who participated in small-group tutoring using mCLASS Intervention lessons were more likely to achieve above-average or well-above-average reading growth on mCLASS Texas Edition, compared to similarly at-risk Texas students not accessing Amplify Tutoring materials. In addition, the thousands of Texas students with access to Amplify Tutoring materials were more likely to raise their reading proficiency level from mid-year to the end of year, as measured by their benchmark composite scores on mCLASS Texas Edition, compared to similar Texas students without access to the materials.

“Providing post-pandemic support to students and educators around the country has been our purpose and privilege,” said Alanna Phelan, vice president of Amplify Tutoring. ”High-impact tutoring is another important way Amplify can fulfill its goal of supporting students in becoming confident, proficient readers and extending the reach of classroom teachers.”

Amplify launched its tutoring program in the summer of 2020. By providing high-quality instructional materials, training and ongoing coaching for tutors hired by districts, as well as hiring and managing tutors directly, the program has since scaled to serve over 200,000 students and is a trusted tutoring partner to hundreds of school districts and states nationally.

Students are engaged in Amplify Tutoring in various ways based on each local education agency’s needs. Models include:

  • full-service tutoring programs that include sessions with trained Amplify-provided tutors administering lessons virtually to students throughout the school day, outside core instructional time, with an emphasis on creating a consistent, positive student-tutor relationship. Tutors and school/district leaders receive consistent coaching and program management from Amplify staff to support program quality and student success.
  • equipping school staff, community partners and other tutoring providers with research-backed tutoring materials, training and program management.
  • consultancies with local education agencies to design and launch high-impact tutoring programs.

The data was collected using the mCLASS platform, which automates the data collection of Dynamic Indicators of Basic Early Literacy Skills (DIBELS). DIBELS is a widely-used series of short tests developed by the University of Oregon that assess K–8 literacy. It is an observational assessment collected by educators interacting with students one-on-one, either live or over video. DIBELS is typically administered three times a year (beginning, middle and end of year) and is used to identify reading difficulty, monitor progress and inform instruction, especially for struggling readers.

About Amplify
A pioneer in K–12 education since 2000, Amplify is leading the way in next-generation curriculum and assessment. Our captivating core and supplemental programs in literacy, math, and science engage all students in rigorous learning and inspire them to think deeply, creatively, and for themselves. Our formative assessment products turn data into practical instructional support to help all students build a strong foundation in early reading and math. All of our programs provide teachers with powerful tools that help them understand and respond to the needs of every student. Today, Amplify reaches more than 15 million students in all 50 states. To learn more, visit amplify.com.

Media Contact

Kristine Frech
media@amplify.com

As national data shows dismal literacy scores, Amplify Reading program demonstrates strong outcomes for academically vulnerable students

BROOKLYN, N.Y.–Amplify, a publisher of next-generation curriculum and assessment programs, released the results of a year-long study on the impact of Amplify Reading, a data-based personalized learning program for K–5 built on the Science of Reading. Across all grades, Amplify Reading students outperformed non-Amplify Reading students after using the program during the 2020–21 school year, with particularly striking outcomes for students identified as ‘at-risk’ for not reaching grade-level benchmarks.

The study compared more than 50,000 K–5 students who used Amplify Reading for 30 minutes per week during the 2020–21 school year with a group of over 160,000 students who did not use Amplify Reading, matched on key student and school characteristics across the United States. Students were measured by educators using mCLASS® with DIBELS® 8th Edition, the gold-standard literacy assessment developed by the University of Oregon. Students who used Amplify Reading in all grades made significantly greater gains from the beginning to end of year in word reading, oral reading fluency and comprehension. Additionally, Amplify Reading students who began the year ‘at risk’ were 36% more likely to end the year at or above benchmark compared to a matched comparison group of students who did not use Amplify Reading. Students made these gains during the 2020–21 school year despite interrupted instruction and other challenges related to the pandemic.

“Amplify Reading consistently drives student growth, even in inconsistent times,” said Melissa Ulan, senior vice president and general manager of supplementals at Amplify. “Given the enormous toll COVID disruptions have taken on our early literacy learners, it’s heartening to see students clearly making gains, especially our most academically vulnerable students, so that educators can implement the most effective strategies to catch students up and accelerate growth.”

The research study, which meets the Every Student Succeeds Act’s (ESSA) Tier 2 Moderate Evidence showed significant and positive effects on student reading outcomes for all grade levels. Notably, 65% of kindergarten students in the Amplify Reading group finished the year on track for reading success, compared to 50% of the comparison group. Across all grades, Amplify Reading students outperformed non-Amplify Reading students, with 59% finishing the year at benchmark compared to 52% of students in the comparison group.

Students were considered on track for reading success if their mCLASS DIBELS composite score was at benchmark or above.

Amplify Reading is a reading acceleration program for grades K–5 that leverages the power of compelling storytelling to engage students in personalized reading instruction and practice. Whether students are just learning to read or mastering comprehension, Amplify Reading presents the skills that they need, at a pace that supports their individual development. It provides students with targeted and engaging instruction and practice in the key skills that students need to become successful readers: Phonological Awareness, Phonics, Decoding, Fluency, Vocabulary, Comprehension, and Close Reading.

About Amplify

A pioneer in K–12 education since 2000, Amplify is leading the way in next-generation curriculum and assessment. Our core and supplemental programs in ELA, math, and science engage all students in rigorous learning and inspire them to think deeply, creatively, and for themselves. Our formative assessment products help teachers identify the targeted instruction students need to build a strong foundation in early reading and math. All of our programs and services provide educators with powerful tools that help them understand and respond to the needs of every student. Today, Amplify serves more than 14 million students in all 50 states. For more information, visit amplify.com.

Contacts
Kristine Frech
media@amplify.com

Pandemic is putting more kids at risk of not learning to read

(Brooklyn, NY – March 1, 2021) Amplify, a publisher of next-generation curriculum and assessment programs, released a research brief today on middle-of-school-year K-5 reading data, revealing learning losses due to the COVID-19 pandemic, especially in Grades K and 1 and among Black and Hispanic students.

While more students in all elementary grades and demographic groups have fallen behind, the COVID-related reading losses are concentrated in kindergarten and first grade and disproportionately among Black and Hispanic students in those grades. Compared to last year, there are now twice as many Black kindergarten students at great risk for not learning to read.

The opportunities to learn that students have lost due to COVID may have life-long consequences if they are not provided with additional instructional support. Several research studies show that absent such additional support, there is nearly a 90 percent chance that a poor reader in first grade will remain a poor reader.

“Given this data, we encourage districts and schools to think about a comprehensive and coherent two-year plan to overcome these gaps,” said Larry Berger, Amplify chief executive officer. “If we take an all-hands-on-deck approach, use research-based practices, and provide plenty of support for educators, we can catch these students up and help them grow into confident, joyful readers.”

“Students will need a double dose of strong core foundational skills instruction — current grade-level instruction as well as missing instruction — and some students will need additional intervention,” said Susan Lambert, chief academic officer, elementary humanities at Amplify. “Addressing lost instruction will require a deep commitment and will likely involve changes to scheduling and staffing. These efforts will support students as they catch up and grow into the strongest readers they can be.”

The analysis compared mCLASS with DIBELS 8th Edition benchmark data from the middle of the school year 2019–20 and 2020–21 school years. Approximately 400,000 students in a matched set of over 1,400 schools in 41 states are represented.

The number of students assessed in the 2020–21 cohort is similar to the number in the 2019–20 cohort; as a percent of the prior cohort, the current year’s numbers are approximately 90 percent, which implies an attrition rate of 10 percent, assuming that enrollment for both years was identical. That said, the differences could reflect changes in enrollment, attendance issues at time of assessment, and changes in assessment practices (some students, excluded here, have received only partial assessments).

The data was collected using the mCLASS platform, which automates the data collection of DIBELS (Dynamic Indicators of Basic Early Literacy Skills). DIBELS is a widely used series of short tests that assess K-8 literacy developed by the University of Oregon. DIBELS is an observational assessment, collected by teachers interacting directly with students one-on-one, either live or over video. DIBELS is typically administered three times a year (beginning, middle, and end of year), and is used to identify reading difficulty, monitor progress, and inform instruction, especially for struggling readers.

About Amplify

A pioneer in K–12 education since 2000, Amplify is leading the way in next-generation curriculum and assessment. Our captivating core and supplemental programs in ELA, math, and science engage all students in rigorous learning and inspire them to think deeply, creatively, and for themselves. Our formative assessment products turn data into practical instructional support to help all students build a strong foundation in early reading and math. All of our programs provide teachers with powerful tools that help them understand and respond to the needs of every student. Today, Amplify serves more than seven million students in all 50 states.

New report: because of the pandemic, more of the nation’s youngest students are still struggling to learn to read

BROOKLYN, NY (February 16, 2022) — Amplify, a publisher of next-generation curriculum and assessment programs, released a research brief on middle-of-school-year reading data. It shows good news that K–5 students are recovering from the loss of literacy instruction caused by COVID-19. However, it also shows that in every elementary grade, there are still more students at risk of not learning to read than there were before the pandemic. The cohorts of students currently in kindergarten, grade1, and grade 2 are furthest behind compared to their pre-pandemic counterparts; Black and Hispanic students currently in those three early grades are still suffering disproportionately from COVID-related instructional loss.

The latest data show that as elementary students have returned to in-class instruction, schools have made terrific progress toward recovering the instruction they missed during the pandemic. However, at the middle of the 2021–22 school year, in every elementary grade (K–5), the number of students at risk of not reading is still higher than it was at the same point in the 2019–20 school year. The number of at-risk students has risen the most in the youngest grades (K–2), and in those grades, nationally, the gaps in early reading skills between Black and Hispanic students and their white counterparts are now wider than they were before the pandemic.

Susan Lambert, chief academic officer of elementary humanities at Amplify, says the data in this report is a clarion call to help this generation of young students get on track in reading. “It’s really an all-hands on deck moment,” she says. “But aiming for recovery is the wrong goal, because pre-pandemic literacy rates were already a problem. Literacy instruction for the K–2 age group has always been critical. Now we’re seeing second grade students who have spent their entire school lives in the pandemic losing the most instructional time at the most important moments for learning to read. The struggles of students who have fallen behind are not going to go away on their own. If we don’t address them, those struggles will compound. The older these students become, the longer it will take them to catch up.”

What should be done to help these students? “There are many things schools are addressing right now: morale of teachers, well-being of children, reducing the spread of the virus, and helping kids catch up,” Lambert says. “With reading, teacher-student relationships matter. Teaching practices should be evidence-based. High quality instructional materials, grounded in the Science of Reading, should be used daily. Instructional content should develop both word recognition and language skills. Learning must be regularly monitored and learning gaps addressed immediately.”

Lambert is optimistic about how much progress can be made. “When kids get good instruction based in the Science of Reading, outcomes improve. When students receive that instruction in the early grades, 95 percent of them can develop as proficient readers regardless of their background.”

Lambert calls for both accelerating student literacy outcomes through quality grade-level instruction and for targeted instruction and interventions to close existing gaps.

She specifically recommends that each district make a two-year, highly integrated plan for the population of kids that are at high risk. Those integrated plans should ensure that schools:

  • Administer benchmark assessments three times per year to monitor levels of risk for reading difficulties.
  • Spend more time on literacy instruction, and make sure it is evidence-based instruction (based in the Science of Reading).
  • Organize the daily calendar to include time beyond grade-level instruction.
  • Be creative about scheduling and staffing to ensure this time is prioritized.
  • Support instructional staff in gaining knowledge about the Science of Reading.

The report highlights the effects of COVID-19 disruptions by comparing Amplify mCLASS with DIBELS® 8th Edition benchmark data from the 2019–20, 2020–21 and 2021-22 school years. Approximately 400,000 students in a matched set of more than 1,300 schools in 37 states are represented. The schools in the source data are slightly more likely to be in large urban metropolitan areas than the nation overall.

The data was collected using the mCLASS platform, which automates the data collection of DIBELS (Dynamic Indicators of Basic Early Literacy Skills). DIBELS is a widely-used series of short tests that assess K–8 literacy developed by the University of Oregon. DIBELS is an observational assessment collected by teachers interacting with students one-on-one, either live or over video. DIBELS is typically administered three times a year (beginning, middle, and end of year), and is used to identify reading difficulty, monitor progress, and inform instruction, especially for struggling readers.

About Amplify
A pioneer in K–12 education since 2000, Amplify is leading the way in next-generation curriculum and assessment. Our captivating core and supplemental programs in ELA, math, and science engage all students in rigorous learning and inspire them to think deeply, creatively, and for themselves. Our formative assessment products turn data into practical instructional support to help all students build a strong foundation in early reading and math. All of our programs provide teachers with powerful tools that help them understand and respond to the needs of every student. Today, Amplify serves more than 10 million students in all 50 states.

Contact:
Molly McCue
media@amplify.com

Literacy crisis in America’s schools persisting beyond COVID-19, with students making some recovery

BROOKLYN, NY (October 21, 2022) — Amplify, a publisher of next-generation curriculum and assessment programs, released a research brief about national beginning-of-school-year (BOY) reading data today. While students in elementary grades are making progress toward early literacy levels that pre-date the pandemic, only about half of students in grade three are on track for learning to read, and nearly a third are in the highest risk category. In kindergarten, half of the nation’s students are starting school already in need of intensive intervention in early literacy skills.

Compared to where they were before pandemic disruptions, more of today’s elementary students are still in the highest risk category for not learning to read. Moreover, students in grades that did not experience the disruptions as acutely are showing gaps, with only about one-third of kindergarteners and less than half of first graders starting the year on track for core instruction in early literacy.

“The data in this report are another signal that we need to do even more to support teachers so they can help this generation of young students get on track in reading,” says Susan Lambert, chief academic officer of elementary humanities at Amplify. “We won’t see early literacy improve beyond pre-pandemic proficiencies if we don’t make changes across our educational system. It is a crisis that can be turned around — with focused efforts on evidenced-based practices.”

Literacy rates in the United States remain a crisis today, with many students urgently needing support. The good news: research-based reading instruction reduces the need for intervention and enables children to move forward as capable, confident learners. When students receive instruction based in the Science of Reading, outcomes improve. When that instruction takes place in the early grades, research shows that most students can be taught to read at or approaching grade level. Schools and districts need to invest in reliable universal screeners, high-quality core curriculum, evidence-based interventions, and professional development for educators based in the Science of Reading.

The report compares mCLASS® with DIBELS® 8th Edition benchmark data from the 2019-20, 2020-21, 2021-22, and 2022-23 school years. Approximately 300,000 students in a matched set of 1,400 schools in 43 states are represented. The schools in the source data are slightly more likely to be in large urban metropolitan areas than the nation overall.

The data was collected using the mCLASS platform, which automates the data collection of DIBELS (Dynamic Indicators of Basic Early Literacy Skills). DIBELS is a widely-used series of short tests developed by the University of Oregon that assess K–8 literacy. DIBELS is an observational assessment collected by teachers interacting with students one-on-one, either live or over video. DIBELS is typically administered three times a year (beginning, middle, and end of year), and is used to identify reading difficulty, monitor progress, and inform instruction, especially for struggling readers.

About Amplify
A pioneer in K–12 education since 2000, Amplify is leading the way in next-generation curriculum and assessment. Our core and supplemental programs in ELA, math, and science engage all students in rigorous learning and inspire them to think deeply, creatively, and for themselves. Our formative assessment products help teachers identify the targeted instruction students need to build a strong foundation in early reading and math. All of our programs and services provide educators with powerful tools that help them understand and respond to the needs of every student. Today, Amplify serves more than 10 million students in all 50 states. For more information, visit amplify.com.

Media Contact
Kristine Frech
media@amplify.com

Amid ongoing national literacy crisis, Boost Reading demonstrates strong outcomes for academically vulnerable students

BROOKLYN, NY (November 29, 2023) — Amplify, a publisher of next-generation curriculum and assessment programs, released the results of a second year-long study on the impact of Boost Reading, a personalized learning program for elementary grades powered by the Science of Reading. Students in grades K–5—including English/multilingual learners—who used Boost Reading for 30 minutes a week significantly outperformed their peers. Students at risk for reading difficulty who used Boost Reading were 26 percent more likely than students not using Boost Reading to meet or exceed grade-level benchmarks by the end of the school year.

The study compared more than 43,000 K–5 students who used Boost Reading for at least 30 minutes a week with a group of more than 130,000 students who did not use Boost Reading, matched on key student and school characteristics. Educators measured student reading skills using DIBELS® 8th Edition, the gold-standard early reading assessment developed by the University of Oregon.

A digital, student-driven program for grades K–5, Boost Reading enables educators to support every reader in their classrooms through its adaptive technology and powerful storytelling. Boost Reading aligns with Amplify’s other early literacy programs and pairs with Boost Lectura to provide personalized English and Spanish instructional parity.

“Seeing such clear and compelling outcomes for two years in a row is just the kind of promising data we could all use as we continue to navigate a post-COVID world,” said Melissa Ulan, senior vice president of the literacy suite at Amplify. “When educators have research-backed tools to personalize instruction, they are able to meet the needs of every student and drive significant growth in reading skills. The data confirm it.”

The research is rigorous: This national study from the 2021–22 school year meets the Every Student Succeeds Act’s (ESSA) Tier 2 Moderate Evidence criteria, showing significant and positive effects on student outcomes. Notably, 62 percent of at-risk English/multilingual kindergarten students in the Boost Reading group finished the year at benchmark or above, compared to 47 percent of students in the comparison group.

About Amplify
A pioneer in K–12 education since 2000, Amplify is leading the way in next-generation curriculum and assessment. Our core and supplemental programs in literacy, math, and science engage all students in rigorous learning and inspire them to think deeply, creatively, and for themselves. Our formative assessment products turn data into practical instructional support to help all students build a strong foundation in early reading and math. All of our programs and services provide educators with powerful tools that help them understand and respond to the needs of every student. Today, Amplify serves more than 15 million students in all 50 states. For more information, visit amplify.com.

Media Contact
Kristine Frech
media@amplify.com

Three-Dimensional Learning 101: What’s So Phenomenal About Phenomena

Wednesday, 4pm ET

Discover how phenomena-based instruction allows students to build a deeper understanding of science through real-world applications. Join us and learn the basics of phenomena-based learning, how it compares to a traditional science approach, and what phenomena-rich instruction looks like in a classroom. You’ll walk away with the knowledge and tools you need to begin your shift to phenomena-based learning.

Amplify’s mCLASS approved as screener for K–2 reading difficulties in California

BROOKLYN, NY (December 23) – Amplify, a publisher of next-generation curriculum and assessment programs, today announced that its mCLASS® system has been approved by the California Reading Difficulties Risk Screener Selection Panel (RDRSSP) as one of only three recommended screeners for identifying K–2 students with reading difficulties in English and Spanish. Of the three, mCLASS is the only approved screener with a dual language report that compares Spanish and English assessment results and offers instructional guidance on transferable skills across languages. 

mCLASS DIBELS® 8th Edition and mCLASS Lectura combine to create an all-in-one system of universal screening, dyslexia screening, progress monitoring, and instruction, grounded in the Science of Reading for grades K–6 in both English and Spanish. They are brief, easy-to-use measures and provide teachers with clear next steps for developing confident readers. 

“We are thrilled that California has recognized the value of mCLASS in supporting educators in identifying and addressing students’ literacy needs,” said Melissa Ulan, executive vice president for literacy at Amplify. “Through direct observation of students and detailed reports, mCLASS helps teachers better understand student performance and develop strategies that meet them where they are, closing gaps and strengthening each student’s foundational literacy skills.”

The RDRSSP, which comprises literacy experts with extensive experience evaluating early literacy screening tools, praised the mCLASS program for: 

  • Strong research foundation: mCLASS DIBELS 8th Edition and mCLASS Lectura were developed in partnership with the University of Oregon, a leading research institution in literacy assessment. Strong reliability and validity evidence shows that these assessments can effectively assess students in key skills linked to dyslexia and broader reading difficulty.
  • Cultural and linguistic responsiveness: The program effectively addresses the diverse dialects spoken by California students, including offering assessments in both English and Spanish, with the unique flexibility of allowing students to take the English test with a Spanish-speaking proctor. 
  • Efficient and effective screening: The gating and discontinuation rules—the criteria within an assessment that determines when to stop administering more test items to a student—ensure that assessments are appropriately targeted, preventing unnecessary or prolonged testing. 
  • Actionable insights: mCLASS allows educators to interpret and act on data in real-time with instant instructional guidance based on screening and progress monitoring results. In just one click, teachers can access differentiated skill-based groups and targeted resources to better support their students.

With this approval, California school districts can begin reviewing mCLASS as their state-approved K–2 screener for use in the 2025-2026 school year. 

About Amplify
A pioneer in K–12 education since 2000, Amplify is leading the way in next-generation curriculum and assessment. Our core and supplemental programs in ELA, math and science engage all students in rigorous learning and inspire them to think deeply, creatively and for themselves. Our formative assessment products help teachers identify the targeted instruction students need to build a strong foundation in early reading and math. All of our programs and services provide educators with powerful tools that help them understand and respond to the needs of every student. Today, Amplify serves more than 15 million students in all 50 states and on six continents. For more information, visit Amplify.com.

Media Contact: Kristine Frech; media@amplify.com

3D Learning 101: What’s So Phenomenal About Phenomena

Wednesday, 4pm ET

Discover how phenomena-based instruction allows students to build a deeper understanding of science through real-world applications. Join us and learn the basics of phenomena-based learning, how it compares to a traditional science approach, and what phenomena-rich instruction looks like in a classroom. You’ll walk away with the knowledge and tools you need to begin your shift to phenomena-based learning.

Early reading data reveal progress overall, with varying outcomes for boys and girls 

BROOKLYN, NY (July 2, 2025) – Amplify, a publisher of next-generation curriculum and assessment programs, today released a research brief on the latest K–2 end-of-school-year literacy data. Findings suggest that overall, more young students are on track to learn to read and fewer are behind than during the pandemic—8 percent more second graders, 14 percent more first graders, and 21 percent more kindergartners are at or above benchmark compared to the 2020-21 school year. 

However, year-over-year improvements have slowed. Since the 2023-24 school year, the percentage of students on track has only improved by 1-2 points in each grade.

The data also show a nuanced picture of gender disparities in early reading. Across K–2, boys score the same or better than girls in reading readiness at the beginning of the year. But as the year progresses, girls show more improvement than boys, narrowing gaps and sometimes outperforming them by the end of the year.

“Five years out from the pandemic, we’re seeing encouraging signs that early literacy recovery is taking hold as more students across all early grades are on track to learn to read, with kindergarteners and first graders leading the recovery,” said Paul Gazzerro, director of customer data at Amplify.

Despite these successes, literacy trends across the United States remain a concern, as year-over-year progress remains slow. 

“Grades K–2 remain critical years for literacy development,” said Susan Lambert, chief academic officer of elementary humanities at Amplify. “To support young readers, educators need data-driven insights into student reading development and instructional practices that are based in the Science of Reading.” 

Amplify encourages districts and schools to analyze end-of-year data by school, grade, and classroom, and create integrated plans that:

  • Administer benchmark assessments three times per year to monitor levels of risk for reading difficulties. 
  • Analyze student data and make informed decisions to support students who are at risk for not learning to read.
  • Allocate additional instructional time and resources for at-risk students.
  • Regularly monitor progress for students, making adjustments as needed.
  • Ensure all students receive instruction that is evidence-based. 
  • Instill a love of reading during school programs, with caregiver and community support.

About Amplify

A pioneer in K–12 education since 2000, Amplify is leading the way in next-generation curriculum and assessment. Our core and supplemental programs in ELA, math and science engage all students in rigorous learning and inspire them to think deeply, creatively and for themselves. Our formative assessment products help teachers identify the targeted instruction students need to build a strong foundation in early reading and math. All of our programs and services provide educators with powerful tools that help them understand and respond to the needs of every student. Today, Amplify serves more than 15 million students in all 50 states and on six continents. For more information, visit Amplify.com.

Media Contact: Kristine Frech; media@amplify.com

Amplify launches custom speech recognition technology using AI to power next-generation voice-enabled learning

Brooklyn, NY – Amplify, a publisher of next-generation curriculum and assessment programs, announced the development of a custom Automatic Speech Recognition (ASR) system designed to power voice-enabled education products.

The Amplify ASR system converts spoken language into written text, enabling users to interact with educational software using voice command while providing detailed feedback on pronunciation, prosody, and more. The technology supports multiple applications, including reading assessment, conversational tutoring, digital activity input, and classroom monitoring. Amplify’s ASR application will also compare student speech to target texts and identify areas where teachers can provide additional support for reading fluency and comprehension.

“Voice interaction is becoming increasingly important for young students using educational software, and we’re seeing tremendous potential for growth in this area,” said Amplify’s Chief Product Officer, Alexandra Walsh. “By developing our own ASR solution, we can test, refine, and deliver voice-enabled features that directly support student learning outcomes while meeting our high standards for safety, accountability, fairness, and efficacy.”

The Amplify ASR application will support Amplify’s voice-interactive instructional programs for the 2025-2026 school year across four key categories:

1. Reading assessment and practice, focusing on phonics, automaticity, and prosody

2. Conversational tutoring systems

3. Voice input for digital activities and assessments

4. Classroom monitoring tools that provide teacher feedback and student insights

The Amplify ASR application will initially replace Soapbox’s ASR functionality in Amplify’s mCLASS Literacy and Boost Reading programs, with plans for organization-wide expansion.

About Amplify

A pioneer in K–12 education since 2000, Amplify is leading the way in next-generation curriculum and assessment. Our core and supplemental programs in ELA, math and science engage all students in rigorous learning and inspire them to think deeply, creatively and for themselves. Our formative assessment products help teachers identify the targeted instruction students need to build a strong foundation in early reading and math. All of our programs and services provide educators with powerful tools that help them understand and respond to the needs of every student. Today, Amplify serves more than 15 million students in all 50 states and on six continents. For more information, visit Amplify.com.

Media Contact: Kristine Frech; media@amplify.com

New efficacy study finds Desmos Math 6-8 significantly improves student learning outcomes in middle grades

Brooklyn, NY (March 24, 2023) – A new study from WestEd, an education research nonprofit organization, found that schools using the Desmos Math curriculum for 6th, 7th, and/or 8th grade math instruction had significantly higher math achievement compared to similar schools that did not use Desmos Math. The Desmos Math 6–8 curriculum became part of the Amplify suite of high-quality instructional programs last spring, along with the Desmos Classroom teaching and learning platform. With a focus on helping teachers celebrate student brilliance, build flexible mathematical understanding and create the conditions for every student to be successful, the Desmos Math 6-8 lessons are standards-aligned, easy-to-use, and fully customizable by educators.

The WestEd retrospective study looked at data from the 2021-2022 school year and used a matched comparison design of almost 900 schools (~150 experimental sites and ~750 control sites) in nine focal states–California, Colorado, Connecticut, Massachusetts, Minnesota, Missouri, New York, North Carolina and Texas. The study found that use of the Desmos Math 6-8 curriculum correlated with increased average math achievement. These results show that there is a positive effect with even a basic usage of Desmos Math 6-8 in increasing middle-grade-wide math achievement.

“We are thrilled with the results of this study, which validate the power of teachers putting student ideas at the center of instruction in order to build strong math proficiency,” said Dan Meyer, dean of research, Desmos Classroom, at Amplify. “We believe that all students – and teachers – deserve to experience engagement, challenge, and success in their math classrooms every day, and we are excited to build out a comprehensive K-12 curriculum to make that vision a reality in more and more classrooms.”

The schools in this study were from nine states with a concentration of Desmos Math 6-8 usage, and the schools used it with varying levels of fidelity. As such, the WestEd researchers believe the full impact of Desmos Math 6-8 may be higher than the effect reported in this study.

“The results are encouraging for educators in search of curricular materials designed to help students meet more rigorous math content standards,” says Kirk Walters, senior managing director, WestEd. “Most state standards and assessments emphasize conceptual understanding and application, which are key features of the Desmos Math Curriculum. Further research could determine the causal effects of the program, which may be even larger if the program is implemented under ideal conditions.”

About Amplify and Desmos Classroom
A pioneer in K–12 education since 2000, Amplify is leading the way in next-generation curriculum and assessment. In June 2022, Desmos split into two entities: “Desmos Studio,” a Public Benefit Corporation that builds and supports the Desmos Calculators, and “Desmos Classroom,” the team and technology behind Desmos Math 6-A1. Together Amplify and Desmos Classroom are building a comprehensive core math curriculum called Amplify Desmos Math that will build off of Desmos Math 6–A1 and be available for pilot and review in Fall 2024. Today, Amplify and Desmos Classroom serve more than 18 million students in all 50 states. For more information about Desmos Math 6-A1, visit amplify.com/desmosmath. For more information about the in-development Amplify Desmos Math, visit amplify.com/math.

About WestEd
WestEd is a nonpartisan, nonprofit agency that conducts and applies research, develops evidence-based solutions, and provides services and resources in the realms of education, human development, and related fields, with the end goal of improving outcomes and ensuring equity for individuals from infancy through adulthood. For more information, visit WestEd.org.

Contact: Kristine Frech; media@amplify.com

New report: Data highlights significant summer instructional loss from the youngest students, reinforcing the importance of strong core instruction in early literacy

BROOKLYN, NY (October 31, 2024) – Amplify, a publisher of next-generation curriculum and assessment programs, today released a research brief on beginning-of-school-year reading data for K–3 students. Findings reveal that recent gains in K–3 early literacy have stalled overall, and that the youngest learners are demonstrating concerning instructional loss over the summer. Students progressing from kindergarten to first grade are the most vulnerable because they have received the least amount of explicit instruction to reinforce foundational reading skills: as many as one in four students return from their summer break no longer on track for core instruction. 

The report compares K–3 literacy data from the past six school years to analyze the effect of instructional loss on student learning. Across grades K–3, the number of students at risk for not learning to read has yet to improve more than pre-pandemic levels, and only half of students are on track to read at grade level. 

“What this really points to is the importance of quality core instruction for young students. Quality instruction should be systematic, cumulative, and explicit. And of course, reading instruction should be informed by assessment data,” said Susan Lambert, chief academic officer of elementary humanities at Amplify. “This data helps educators identify strengths and areas for growth, enabling them to provide strong foundational support for their youngest students.”

In the report, Amplify outlines recommendations for educators as they begin the school year. Schools and districts can support students by:

  • Ensuring that all students receive quality instruction grounded in evidence-based practices such as the Science of Reading
  • Identifying students who need additional support and developing a plan for addressing their needs
  • Allocating resources for additional support and implementing those plans
  • Regularly monitoring progress for students and making adjustments as needed

“Schools and districts should consider explicit instructional practices that provide more frequent opportunities for students to reinforce their reading skills,” continued Lambert. “The good news is that when evidence-based instruction takes place in the earliest possible grades, research shows that most students can be taught to read at or approaching grade level.”

About Amplify
A pioneer in K–12 education since 2000, Amplify is leading the way in next-generation curriculum and assessment. Our core and supplemental programs in ELA, math and science engage all students in rigorous learning and inspire them to think deeply, creatively and for themselves. Our formative assessment products help teachers identify the targeted instruction students need to build a strong foundation in early reading and math. All of our programs and services provide educators with powerful tools that help them understand and respond to the needs of every student. Today, Amplify serves more than 15 million students in all 50 states and on six continents. For more information, visit Amplify.com.

Media Contact: Kristine Frech; media@amplify.com

High-impact, evidence-based programs that help students make gap-closing gains in reading and math

Amplify Tutoring engages students and drives measurable academic gains. We partner with districts to ensure that children become confident, proficient readers and mathematical thinkers.

A student and an adult sit at a table, both looking at a laptop screen. The background features blue and yellow geometric shapes with a star icon.

About Amplify Tutoring

Grounded in evidence-based practices and taught by caring, consistent tutors, our high-impact tutoring programs use high-quality instructional materials and data-driven mCLASS® products to support and engage students.

  • Personalized, data-driven instruction
  • Research-backed solutions tailored to support your Multi-Tiered System of Supports (MTSS) framework
  • Customizable—before, during, or after school; year-long, semester-long, and summer programming
  • Comprehensive, hands-on program management and staffing support

Amplify Literacy Tutoring supports K–6 readers through engaging, systematic instruction aligned to the Science of Reading and driven by mCLASS DIBELS® data.

Amplify Math Tutoring accelerates student achievement in grades 3–5 and builds students’ confidence in speaking, writing, and thinking mathematically.

More than a program: a true partner

Hear directly from district leaders and educators who’ve experienced the Amplify Tutoring difference. In these candid conversations, they share how we partner to deliver solutions for schools, gains for students, and support for teachers.

What district leaders and teachers are saying

“Students’ enthusiasm for Amplify Tutoring is evident! From the moment they sit down for their session, you can see how motivated and engaged they are while working with their tutor and peers. … It is very helpful that the tutors provide real-time feedback to students, and it has allowed them to be more confident and committed to their own learning paths.”

—Jennifer Quartano, Teacher, NYC Public Schools

What district leaders and teachers are saying

“There has been an increase in many students’ scores. The students are always excited to participate and the small group instruction truly is making a difference … I am passionate about reaching students who require support. This initiative was very much needed in our school. Thank you, Amplify Tutoring!”

—Denise Bishop, Assistant Principal, Prince George’s County Public Schools

What district leaders and teachers are saying

“I appreciate the support and quick response we have received from Amplify Tutoring this year. We have seen lots of growth with our fourth graders with phonics, decoding, vocabulary, and comprehension that we likely would not have seen without the program!”

—Heather Wasburn, Instructional Coach, Springfield City Schools

Bar chart showing that students with 2–3 literacy tutoring sessions per week outperform national growth norms across grades K–5, compared to students not in tutoring.
Bar chart showing percent correct in performing multi-digit arithmetic for Grades 3, 4, and 5 before and after Amplify Math Tutoring; scores improved in Grades 4 and 5 after tutoring.

Our impact

Amplify Tutoring accelerates learning for students who need it most. Students in Amplify Tutoring are more likely to achieve outsized academic gains than similarly at-risk peers in the same schools who are not enrolled in the program.

A hexagonal badge labeled "National Student Support Accelerator Tutoring Program Design, Amplify Tutoring 2024-2027," recognizing high impact tutoring programs that boost reading competency.

Amplify Tutoring has been awarded the National Student Support Accelerator (NSSA) Tutoring Program Design Badge by Stanford University!

Learn more

Reliable, easy-to-read data

With valid and reliable mCLASS assessments and real-time reporting always within reach, everyone involved in a child’s learning journey—from teachers and tutors to school leaders and families—can support student growth.

  • Teachers have visibility into students’ data and all tutoring lesson content.
  • School and district administrators receive regular tutoring attendance and progress-monitoring reports.
  • Caregivers receive Home Connect letters and activities to help their child practice foundational skills at home.
Screenshot of mCLASS Home Connect dashboard displaying reading assessment data, scores, and activity details with charts and text descriptions.

High-quality instructional materials that power Amplify Literacy Tutoring

Amplify Literacy Tutoring includes high-quality resources to support students’ growth.

Targeted lessons generated by precise data

mCLASS Intervention is a research-backed, ESSA rated program that targets instruction based on students’ mCLASS DIBELS 8th Edition assessment results. With engaging lessons aligned to the Science of Reading that adapt based on students’ progress monitoring results, mCLASS Intervention streamlines time-consuming data analysis for teachers and makes sure that tutoring focuses on the literacy skills students need.

A line graph displays students' letter-sound fluency scores from June to May, showing progress toward a custom goal of 90, with benchmark and performance data points.
A screenshot of the mCLASS Reading assessment dashboard showing student scores, benchmarks, and assessment categories for Bolton Grade 1.

Transparency into student performance

mCLASS DIBELS 8th Edition is our nationally normed benchmarking and progress monitoring assessment tool to measure students’ foundational literacy skills. Students take the benchmark assessment three times a year and progress monitoring occurs every 7–10 lessons in between.

Proven impact for students who need it most

Boost Reading delivers targeted, adaptive practice that meets students where they are, while teachers get simple and meaningful insights into student progress. The program consistently moves students toward grade-level proficiency with just 30 minutes of use per week. Students can continue learning through Boost Reading between tutoring sessions or at home.

High-quality instructional materials that power Amplify Math Tutoring

Amplify Math Tutoring includes high-quality resources to support students’ growth.

Intervention Mini-Lessons aligned to core instruction

Amplify Desmos Math Mini-Lessons provide targeted intervention for students who require additional support or need more time. These lessons are aligned to the most critical topics throughout a unit; they enhance conceptual understanding while improving procedural fluency and application.

Two overlapping math worksheets on a white background with blue and orange squares; worksheets show graphs, equations, and instructional text about graph rotations.

Valuable insights into student mathematical thinking

mCLASS Math is our benchmarking and progress monitoring assessment tool. Students take the benchmark assessment three times a year; progress monitoring occurs every 7–10 lessons in between.

Personalized practice—anytime and at home

Fact fluency practice provides students with regular practice beyond rote memorization. The program is used during tutoring sessions and is available on non-tutoring days. Students also have access to Boost Math’s independent learning activities, to continue practicing between tutoring sessions or at home.

A woman and a boy sit at a table, looking at a tablet together. The background includes blue and orange graphic elements with a clipboard icon.

Consultation and collaboration

Amplify Tutoring tailors our support for educators, schools, districts, caregivers, and state-level leaders, helping to realize the promise of high-impact tutoring programs. Through collaborative partnerships at every level, Amplify Tutoring engages communities in driving academic improvement and boosting attendance.

Our services can include:

Program design consultation: Amplify Tutoring offers expert program design consultation services to help schools and districts create effective and scalable high-impact tutoring programs.

Tailored onboarding: We provide customized training sessions for school, district, and state leaders, ensuring that Amplify Tutoring services are integrated smoothly into existing systems.

Ongoing professional development and coaching: Our program management includes continuous training, coaching support, and office hours with pedagogical experts to fortify the program’s success and adaptability.

Caregiver engagement: We offer resources and support for families and caregivers, including tips for at-home support, helping them stay informed and involved in their child’s progress.

Seamless communication and support: We provide transparent communication and engage all stakeholders—district and school leaders, teachers, caregivers, and students—to keep everyone aligned and informed.

Data reporting: We provide detailed reports and analytics to district and school leaders, giving them the power to monitor progress, make data-driven decisions, and celebrate successes.

Amplify Tutoring is part of a connected early literacy and math suite.

Our literacy and math suite programs are designed to support and complement each other in a Multi-Tiered System of Supports (MTSS). Learn more about our related programs.

The promise of Next Generation Science Standards

The Next Generation Science Standards (NGSS), and other state standards like them, represent more than just new expectations—they embody a transformative vision for science education. Instead of asking students to memorize isolated facts, NGSS calls for students to think like scientists and engineers while grappling with real-world phenomena that matter to them and their communities.

This shift from learning about to figuring out develops the critical-thinking skills and problem-solving mindset students need to tackle complex challenges throughout their lives.

Two children wearing safety goggles conduct an NGSS-inspired science experiment at a table, mixing substances in clear plastic cups with plastic spoons.

Three-dimensional (3D) learning that engages and inspires

Two girls conduct a science experiment in a classroom, holding a clear cup with water and a straw, while observing and taking notes at their desks.

At the heart of NGSS lies three-dimensional learning, where Science and Engineering Practices (SEPs), Crosscutting Concepts (CCCs), and Disciplinary Core Ideas (DCIs) work together to create rich, meaningful learning experiences.

Science and Engineering Practices are the approaches and habits of real scientists and engineers: asking questions, developing models, planning investigations, and constructing evidence-based explanations and arguments. Working with these practices awakens student curiosity, drives student-centered learning, encourages deep and critical thinking, and creates opportunities for students to articulate their understanding in a variety of meaningful ways. 

Crosscutting Concepts are the big-picture thinking tools that scientists use every day. When students use Crosscutting Concepts as a lens to examine common themes in science such as patterns, cause and effect, systems, and energy, they begin to identify and connect science ideas across disciplines.

Disciplinary Core Ideas represent the essential knowledge of science. Students figure out these science ideas through their investigation of real-world scientific phenomena, and consequently develop deep understandings of science ideas.

The student experience: from passive to passionate

Four children sit at a classroom table examining a small object together, surrounded by open notebooks and colorful classroom decorations.

In three-dimensional science learning, students become active investigators, gathering evidence from multiple sources and constructing increasingly sophisticated scientific arguments and models about real-world phenomena. They engage in evidence-based debates, collaborate on engineering challenges, and make connections between their investigations and their own communities, as well as the world beyond. See it in action.

An adult and a child sit cross-legged on the floor in a classroom, reading a book together. The classroom setting includes chairs, tables, and colorful decorations.

The literacy-rich nature of NGSS instruction means students read, write, speak, and listen like real scientists and engineers, actively questioning, analyzing, and communicating findings. This integrated approach develops both scientific understanding and communication skills—skills that transfer across all subjects and even beyond the classroom.

How Amplify Science delivers as an HQIM curriculum

Amplify Science was built from the ground up to fulfill the NGSS vision and is an HQIM (high-quality instructional materials) curriculum, characterized by the following:

  • All green on EdReports. Amplify Science has been evaluated by EdReports, an independent K–12 curriculum review organization, and received the esteemed all-green rating (“meets expectations”) across all three of its gateways: Alignment to the NGSS, Coherence and Scope, and Usability. Learn more about our all-green rating.
A circular badge with the text "Read the Report" at the top, "EdReports" logo in the center, and "Review Year 2021" at the bottom.
  • The real-world anchor phenomenon is deeply woven throughout each unit as the central thread. In Amplify Science, students assume the role of a real scientist or engineer to investigate a compelling phenomena in K–5 and grades 6–8. Over the course of the unit, they gather and make sense of a variety of evidence sources and develop increasingly sophisticated explanations and models as their understanding deepens. Whether investigating a mysterious fossil discovery as geologists or designing emergency supply delivery pods as mechanical engineers, students experience the kind of work done by real scientists and engineers.  
Two boys wearing safety glasses sit at a classroom table. One holds a cup with a white liquid; the other holds a pencil and notebook. Bulletin boards with colorful labels are in the background.
  • All three dimensions of the NGSS are intentionally and thoughtfully integrated throughout every unit and across all grades. As they built Amplify Science as an HQIM curriculum, the experts at UC Berkeley’s Lawrence Hall of Science deliberately crafted each unit, chapter, and lesson with the following guiding questions in mind:
    • What do we want students to figure out (specifically, what Disciplinary Core Idea or part of a DCI)? 
    • How do we want them to figure it out (i.e., what Scientific and Engineering Practice will they engage in to reach understanding)? 
    • What Crosscutting Concept can scaffold students’ understanding and connect it to other ideas about the natural world that they have learned? 

This systematic approach ensures that every learning experience is purposefully designed to engage students in authentic scientific thinking while building connections across concepts and grades.

A teacher observes and assists a group of four students working on a science activity at a classroom table.
  • Educators receive comprehensive implementation support. Through lesson-planning resources, science background materials, built-in assessments, and expert coaching—all provided directly through Amplify—teachers are able to confidently implement the program’s NGSS-aligned, high-quality instructional curriculum with greater ease and success. 
Two women sitting at a table looking down at documents, appearing focused and engaged in discussion or review.
  • Multimodal learning experiences support all learners. Amplify Science ensures that everyone can access scientific concepts through the Do, Talk, Read, Write, Visualize multimodal approach that includes hands-on investigations, digital simulations, collaborative discussions, and literacy-rich activities. 
Two boys work together at a desk with a laptop and notebooks, while other students sit and work in the background.
Bar chart comparing percent growth in three skills—reading comprehension, science vocabulary, and science content knowledge—for “Business as usual” vs. “Amplify Science,” aligned with NGSS standards.

Ready to transform your science instruction with an HQIM curriculum?

Please contact your sales representative today, or download a sample unit to experience three-dimensional learning firsthand. Your future scientists, engineers, and citizens of the world are waiting!

Explore a unit

Five fundamentals of high-quality materials in action

So what do we mean by high quality instructional materials, or HQIM?  We can start with how EdReports.org, the leading third-party reviewer of curriculum, defines it:

  • Materials that help educators teach to rigorous standards. 
  • Materials that are relatively easy to use.

Beyond these important starting points, what does high quality curriculum look like in action—in real classrooms?  Here are five fundamentals of how we think about it at Amplify.

Dos estudiantes en un salón de clases realizando un experimento científico. Uno sostiene una pequeña taza transparente con líquido y una pipeta, mientras el otro observa atentamente. Los útiles escolares y los papeles están sobre el escritorio.

1. It looks like ALL students engaged and thinking.

Students at all levels are able to engage deeply with important questions, to think deeply, creatively, and for themselves. 

There’s a commitment to fairness and a “low floors/high ceilings” approach: all students get the scaffolding they need to grapple with the things great minds in the subject area find important, beautiful, and true.

Two girls sit at a classroom table, looking at a laptop screen together. One is typing while the other watches, surrounded by colorful decorations and High Quality Instructional Materials in the background.

2. It looks like teachers using materials that work harder for them.

Teachers find the program easy and enjoyable to teach. The rich content inspires them to do some of their best teaching. 

Teachers also have powerful tools and data that enable them to understand their students more deeply and give more precise feedback.

A teacher helps two young students with their reading and writing at a classroom desk.

3. It looks like a vibrant classroom community.

The pedagogy of the program supports the formation of a classroom community where teachers and students wonder, share, debate, and learn together. 

It looks like a model of civil society.

high quality informational materials five fundamentals

4. It looks like a culture of continuous learning for educators, districts, and publishers.

Professional development is not one and done. The district not only provides teachers with high-quality training upfront, but also ongoing ways for teachers to compare notes and share best practices in implementing a new program.

The publisher also collaborates with districts on the initial training as well as provides ongoing support to teachers with on-demand resources, customer support, and online communities. Both the publisher and district continuously respond to teacher feedback and data to keep improving the program and classroom-level implementation.

Two women sit at a table working together. One types on a laptop while the other writes on a spiral-bound notebook. Posters and office supplies are in the background.

5. Finally and most importantly, it looks like improved learning outcomes for students.

The program has demonstrated the ability to raise student achievement.  It may start with growth on benchmark assessments and then, over time, you can see it on state tests. 

The district continues to track how well the program is helping to drive strong learning outcomes, and the publisher also continues to seek ever higher levels of efficacy through ongoing product improvement and measurement.

high quality informational materials five fundamentals

Boost Reading sample site

To view this protected page, enter the password below:


Amplify literacy curriculum sample boxes – TX

To view this protected page, enter the password below:


Amplify literacy curriculum sample boxes – CA

To view this protected page, enter the password below:


What instructional coherence really looks like

What instructional coherence really looks like

To view this protected page, enter the password below: